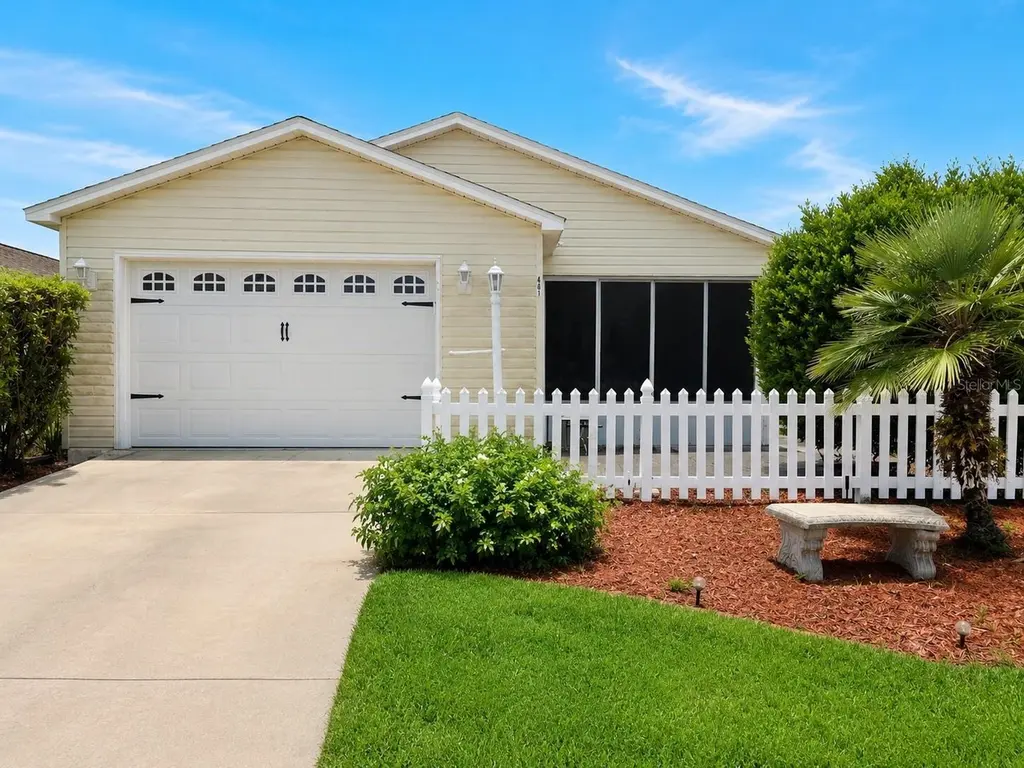
481 Hildalgo Dr · The Villages, FL
Flood risk 1/10 · Minimal
- FEMA flood zone
- X (unshaded)
- Chance of flooding over 30 yrs
- 0.0%
- Est. flood insurance / yr
- $507 – $1,088
Fire risk 4/10 · Minor
- Est. fire insurance / yr
- $947 – $1,759
Heat risk 9/10 · Severe
- Hot days now (above 108°F)
- 7 days/yr
- Hot days in 30 yrs
- 22 days/yr
Wind risk 9/10 · Severe
- Chance of severe wind over 30 yrs
- 99.0%
Air-quality risk 3/10 · Minor
- Unhealthy air days now
- 2 days/yr
- Unhealthy air days in 30 yrs
- 3 days/yr
Risk factors via First Street. Map © Google.
Why this score? — see what drove the C- grade
The composite is a weighted blend of 9 inputs, each scored 0–100. Each bar is that input's sub-score; the figure is the points it added to the 100-point composite (weight × sub-score).
- Cash flow +17.2/30.0
- ARV discount +13.1/15.0
- DSCR +5.3/10.0
- Schools +5.2/10.0
- 1% rule +4.6/10.0
- Rent growth +3.5/5.0
- Livability +3.5/5.0
- Condition / age +2.5/5.0
- Appreciation +0.0/10.0
$219,995
🖨 Deal sheet 📄 Offer letter ✓ Due diligence
Listing remarks
Bond Paid! No HOA! Priced Below Market for Quick Sale in The Villages. Welcome to The Villages lifestyle at an exceptional value! This 2-bedroom, 2-bath villa is ideally located in the desirable Village of De La Vista West and offers a rare opportunity to own in one of Florida's premier active adult communities at a price that allows room for your personal updates and improvements. (Roof 2015, AC 2012) Home does need some cosmetic repairs. Inside, you'll find a spacious open-concept living and dining area, a functional kitchen with breakfast bar, a large primary suite featuring an oversized walk-in closet, and a comfortable guest bedroom for visiting family and friends. The enclosed porch
Key facts
- Enclosed porch
- Breakfast bar
- 6,324 sq ft lot
Tags
Property features AI
Finance
- Other: Unfurnished; Directions available; Living area and building area recorded in public records
- Financial info: Total monthly association fees approximately $147; Total annual association fees approximately $1,764; Other annual assessment approximately $285; Annual taxes listed
- HOA & community: Association recreation owned; Clubhouse; Community mailbox; Deed restrictions; Dog park; Fitness center; Golf and golf cart friendly; Pool; Sidewalks; Tennis courts; Street lights; 24-hour guard; Maintenance of grounds included; Recreational facilities and security included; Senior community; Pets allowed (max ~40 lbs)
Exterior
- Parking: Driveway; Attached garage with garage door opener (1 car)
- Security: Smoke detector(s)
- Utilities: Public water; Public sewer; High-speed internet available; Cable connected; Electricity connected; Phone available; Water connected; Sewer connected
- Home design: Residential villa; One story; Faces northeast; Homestead property; CDD present
- Construction: Vinyl siding with frame construction; Shingle roof; Slab foundation; Built using standard frame materials
- Exterior features: Enclosed patio/porch; Exterior lighting; Sliding doors; Paved road access; Lot approximately 0.15 acres
Interior
- Kitchen: Dishwasher; Range; Microwave; Refrigerator
- Bedrooms: 2 bedrooms
- Flooring: Linoleum
- Bathrooms: 2 full bathrooms
- Heating & cooling: Electric heating; Central air conditioning
- Interior features: Ceiling fans; Kitchen/family room combo; Open floorplan; Walk-in closet(s); Window treatments; Blinds
- Laundry & utility: Washer; Dryer; Laundry located in garage; Irrigation equipment
Neighborhood map
What this means for you Summary
Snapshot
- This is a 2-bed/2.0-bath single-family listed at $220k.
Deal economics
- At list price, monthly cash flow is $155 ($2k/yr) — positive.
- The deal already cash-flows at list — no discount required.
- To meet the 1% rule (rent ≥ 1% of price), the offer needs to be $212k (3.6% below list).
- Recommended offer: $212k (3.6% below list) — sets the bar for 1% rule.
- Cap rate 7.1% vs local median 5.0% in The Villages — top-decile yield for the area; either an underpriced asset or a hidden risk that comps aren't pricing in. Stress-test before assuming the spread holds.
Location & tenants
- Location reads 70/100 on livability (#431 in FL) — a middle-class / working-renter tenant base. Strengths: schools A+, crime A+, housing A; Watch: amenities F, commute F, health & safety F.
- Sumter (rural): math 61% / reading 61% proficiency, ranked #11 of 73 in FL (top 15%) — acceptable for families but not a draw, mixed tenant base, ~2y average lease.
- Market conditions: Rents rising fast (+4.0%/yr); 576 active listings in the ZIP; 14 comparable units currently listed for rent nearby; rentals at typical pace (median 21d on market — plan ~3-4 weeks tenant-placement turnaround); 3,961 units permitted in Sumter County in 2024 (248 in 5+ unit buildings).
- This rent runs 43% of the median local income ($59k/yr) — at the standard rent-burdened threshold; future hikes will face affordability resistance.
Forward outlook
- Local home prices are declining (-3.0%/yr); year-one equity from $2k of loan paydown is wiped out by about $7k of value loss. Plan a longer hold.
- Sumter County population projected at +45% by 2050 — long-run rental-demand tailwind backs the buy-and-hold thesis.
Negotiation context
- Only 11 days on market — expect competitive offers; lowballing is unlikely to land.
- Current owner paid $136k; list at $220k implies a 62% gain — meaningful room to come down on a strong offer.
Risks & watch-outs
- Climate carrying-cost: severe wind risk, 99% chance of damaging wind over 30y; extreme-heat days projected 7→22/yr by 2055 (HVAC capex compounding) — expect insurance premiums to compound above CPI over the hold.
Questions for the listing agent
- What does the HOA fee cover, when was the last increase, and are there any pending special assessments or reserve-fund shortfalls?
- Is there a deadline driving the sale (1031 exchange, divorce, estate, relocation)? That informs how much negotiation room exists.
- Schools are A-rated — typically a magnet for longer-tenancy family renters. What's the average tenant stay here, and is there a school-zone premium baked into asking?
- What's the average days-on-market for RENTAL listings here right now (not sales)? A rising rental-DOM trend means longer vacancies and softer asking-rent achievability than the comps imply.
- What's the recent tenant-quality profile in this submarket — average credit score on applications, eviction rate, late-payment / NSF rate, and stable-employment percentage? A property-management company in the area should have these aggregated.
- How much new for-sale + rental construction is in the pipeline within 1–3 miles? Heavy new supply typically softens prices + rents 12–24 months out; constrained supply supports both.
Investment metrics
- 1% rule
- 0.96% ✗
- Cap rate
- 7.14%
- Cash-on-cash
- 3.02%
- DSCR
- 1.13
- GRM
- 8.6
CMA / ARV
- ARV (on-the-fly)
- $251,104
- Comps found
- 12
Show comp detail 12 sales within ~0.75 mi
| Address | Dist | Beds/Ba | Sqft | Sold | Price | $/sf | Match |
|---|---|---|---|---|---|---|---|
| 1721 Sonora St | 0.06mi | 2/2.0 | 1,121 (0%) | 1mo | $235,000 | $210 | 97 |
| 1710 Morelos Rd | 0.07mi | 2/2.0 | 1,121 (0%) | 2mo | $230,000 | $205 | 95 |
| 432 Hildalgo Dr | 0.11mi | 2/2.0 | 1,121 (0%) | 2mo | $230,000 | $205 | 93 |
| 221 Montoya Dr | 0.44mi | 2/2.0 | 1,121 (0%) | 2mo | $269,000 | $240 | 78 |
| 1546 Lozano Ave | 0.49mi | 2/2.0 | 1,139 (+2%) | 0mo | $230,000 | $202 | 74 |
| 1501 Alfonso Ln | 0.33mi | 2/2.0 | 1,014 (-10%) | 2mo | $233,000 | $230 | 67 |
| 1657 Zadora Ln | 0.64mi | 2/2.0 | 1,098 (-2%) | 2mo | $285,000 | $260 | 65 |
| 620 Nuevo Leon Ln | 0.49mi | 2/2.0 | 1,210 (+8%) | 1mo | $300,000 | $248 | 63 |
| 242 Juarez Way | 0.63mi | 2/2.0 | 1,066 (-5%) | 0mo | $197,000 | $185 | 62 |
| 342 San Marino Dr | 0.53mi | 2/2.0 | 1,230 (+10%) | 1mo | $255,000 | $207 | 59 |
| 419 Santa Clara Cir | 0.52mi | 2/2.0 | 1,248 (+11%) | 1mo | $280,000 | $224 | 56 |
| 604 Nuevo Leon Ln | 0.44mi | 2/2.0 | 970 (-14%) | 2mo | $249,000 | $257 | 55 |
Match score weights: distance 35% · size 25% · config 20% · recency 20%. Top-matched comps best support the ARV.
Projected returns pro-forma
-3.0% appreciation · 4.03% rent growth · sell at horizon
- IRR
- -10.4%
- Equity multiple
- 0.62×
- Total profit
- $-23,518
- Equity at exit
- $32,802
- IRR
- 0.4%
- Equity multiple
- 1.03×
- Total profit
- $1,674
- Equity at exit
- $19,021
Cash invested: $61,599 (down + closing). Projections, not guarantees.
Landlord ↔ Tenant lean methodology
- Overall (STATE)
- 87 Strongly Landlord-Friendly
- State Florida
- 87 Strongly Landlord-Friendly · R+3
- County
- — inherits STATE
- City
- — inherits STATE
ZIP-level market 32159
- Home prices YoY
- -16.0%
- Rents YoY
- 4.0%
- Active inventory
- 576
- Price-to-rent
- 8.6×
Monthly cashflow live
- Estimated rent
- $2,121 high interval (Pro) →
- Mortgage (P&I)
- −$1,154
- Tax from tax record
- −$128 /mo · $1,536/yr
- Insurance
- −$92
- HOA
- −$147
- Vacancy / Maint / Mgmt
- −$445
- Net cashflow
- $155
Break-even live
UW: 25.0% down · 7.5% · 30yr · 1.5% tax · 5.0% vac · 8.0% maint · 8.0% mgmt
Financing live
Cash to close
- Down payment
- $54,999
- Closing costs
- $6,600
- Reserves months
- —
- Total cash needed
- —
Loan-product check · same deal, 3 products live
Conventional
25% down · 7.5% · 30yr
- Down + closing
- —
- Monthly P&I
- —
- Monthly cashflow
- —
- DSCR
- —
- Eligible?
- —
Personal DTI + credit; lowest rate.
DSCR
20% down · 8.5% · 30yr
- Down + closing
- —
- Monthly P&I
- —
- Monthly cashflow
- —
- DSCR
- —
- Eligible?
- —
No personal income docs; deal must DSCR.
Hard money
10% down · 12.0% · 12mo
- Down + closing
- —
- Monthly P&I
- —
- Monthly cashflow
- —
- DSCR
- —
- Eligible?
- —
Short-term bridge; refi at stabilization.
Rent comps 14 comps
| Address | Beds | Baths | Sqft | Rent | $/sqft | DOM | Units | Dist |
|---|---|---|---|---|---|---|---|---|
| 1688 Garcia Ct Lady Lake, FL | 2.0 | 2.0 | 1075 | $1,700 | $1.58 | 21d | 1 | 0.23mi |
| 722 Camino del Rey Dr Lady Lake, FL | 3.0 | 2.0 | 1205 | $2,000 | $1.66 | 21d | 1 | 0.47mi |
| 613 Enconto St Unit 1525268P The Villages, FL | 2.0 | 2.0 | 1097 | $1,788 | $1.63 | 21d | 1 | 0.48mi |
| 314 Juarez Way Lady Lake, FL | 2.0 | 2.0 | 1200 | $1,800 | $1.50 | 21d | 1 | 0.52mi |
| 1330 La Jolla Cir The Villages, FL | 2.0 | 2.0 | 1214 | $3,000 | $2.47 | 21d | 1 | 0.65mi |
| 628 Dominguez Dr Lady Lake, FL | 2.0 | 2.0 | 1214 | $2,245 | $1.85 | 21d | 1 | 0.75mi |
| 1524 Martinez Dr Lady Lake, FL | 2.0 | 2.0 | 1199 | $2,095 | $1.75 | 21d | 1 | 0.78mi |
| 716 Dominguez Dr Lady Lake, FL | 2.0 | 2.0 | 1094 | $2,450 | $2.24 | 21d | 1 | 0.80mi |
| 1304 Santa Rosa Ct Lady Lake, FL | 2.0 | 2.0 | 1286 | $4,500 | $3.50 | 21d | 1 | 0.94mi |
| 10840 NE 89th Dr The Villages, FL | 1.0–3.0 | 1.0–2.0 | 919 | $1,634 | $1.78 | 21d | 21 | 1.06mi |
| 943 Mendoza Blvd Lady Lake, FL | 2.0 | 2.0 | 1268 | $5,800 | $4.57 | 23d | 1 | 1.13mi |
| 932 Chula Ct Lady Lake, FL | 2.0 | 2.0 | 1346 | $3,000 | $2.23 | 3d | 1 | 1.27mi |
| 323 Chula Vista Ave Lady Lake, FL | 2.0 | 2.0 | 1486 | $2,700 | $1.82 | 23d | 1 | 1.28mi |
| 2006 Cardona Way Lady Lake, FL | 2.0 | 2.0 | 1428 | $3,900 | $2.73 | 21d | 1 | 1.37mi |
HOA detail
- Monthly dues
- $147 · $1,764/yr
Listing history 10 events
-
2026-06-19pricedays on market $219,995 Active 11 DOM
-
2026-06-18days on market $225,000 Active 10 DOM
-
2026-06-17days on market $225,000 Active 9 DOM
-
2026-06-16days on market $225,000 Active 8 DOM
-
2026-06-15days on market $225,000 Active 7 DOM
-
2026-06-14days on market $225,000 Active 5 DOM
-
2026-06-13days on market $225,000 Active 4 DOM
-
2026-06-10days on market $225,000 Active 2 DOM
-
2026-06-09remarks 699-char remark
-
2026-06-09$225,000 Active 1 DOM
ⓘ Source: listings_history table (triggers on properties + properties_extension) + one-shot
backfill from property_details.listing_events for pre-trigger history.
Tax reassessment forecast FL · Resets to sale price
- Current annual tax
- $1,536 · $128/mo
- Projected year-2 tax
- $1,826 · $152/mo
- Expected delta
- +$290/yr (+$24/mo · 18.9%)
ⓘ Screening estimate from a state-policy table — verify with the county assessor before closing.
Climate risk First Street
- Flood 1/10 Low FEMA zone X (unshaded) · 0% chance over 30 yrs
- Wildfire 4/10 Moderate
- Heat 9/10 Extreme 7 d/yr ≥108°F today · 22 d/yr by 30 yrs out
- Wind 9/10 Extreme 99% chance of damaging wind over 30 yrs
- Air quality 3/10 Moderate 2 unhealthy d/yr today · 3 by 30 yrs out
Nearby sold comps map
Loading sold comps map…
Walkable amenities ~0.75 mi
Loading nearby amenities…
Taxation est. · year 1
- Rental income
- $25,450
- − Mortgage interest
- −$12,323
- − Property taxes
- −$1,536
- − Insurance
- −$1,100
- − Repairs & maintenance
- −$2,036
- − Management
- −$2,036
- − HOA
- −$1,764
- − Depreciation
- −$6,400
- Taxable loss
- −$1,745
- Est. tax savings @ 24.0%
- +$419
- After-tax cash flow
- $2,280/yr
For passive investors: Depreciation is non-cash, so a rental often shows a tax loss while cash-flowing — sheltering income. Rental losses are passive: they offset passive income freely, and up to $25,000/yr can offset ordinary (W-2) income if you actively participate and your MAGI is under $100k (phasing out to $0 by $150k); unused losses carry forward. On sale, claimed depreciation is recaptured at up to 25%, and gains may owe capital-gains tax (a 1031 exchange can defer both). Figures are a year-1 estimate at your 24.0% rate — not tax advice; consult a CPA.
Schools (NCES district)
- District
- Sumter
- NCES district ID
- 1201800
- Math proficiency
- 61% ▼ -4.00%
- Reading proficiency
- 61% ▼ -2.00%
- Median HH income
- $48,240
- Composite
- 51.74/100
- National rank
- #1682
- State rank
- #11 of 73 in FL
Livability — The Villages
- Score
- 70/100
- State rank
- #431
- US rank
- #7363
Category grades
Schools grade is shown separately in the Schools card above.
Census & demographics
- Census place
- The Villages, FL
- County
- Lake County · 364,602 people
- City population
- 83,973
- Metro
- Orlando-Kissimmee-Sanford, FL
- Population (ZIP)
- 32,107
- Household income
- $58,518
- Rent vs Own
- Severe rent burden
- 1047.0
Population outlook (Sumter County) Hauer SSP2
- Today (2025)
- 161,172 people
- By 2030
- 180,083 · +11.7%
- By 2040
- 209,892 · +30.2%
- By 2050
- 234,186 · +45.3%
- By 2075
- 284,602 · +76.6%
- By 2100
- 317,039 · +96.7%
Race, ethnicity, and origin ACS 2023
- Neighborhood character
- Predominantly White (86%)
- Race & ethnicity
- White 86% Hispanic / Latino 6% Two or more races 5% Black 4% Asian 1%
- Hispanic origin (detail)
- Puerto Rican 3%
- Common ancestry
- Romanian 4% Lithuanian 3% Slovak 3%
- Foreign-born
- 5% · Canada, Jamaica
- Languages at home
- 93% English-only · Spanish 4% German/W. Germanic 1% Other Indo-European 1%
Political lean MEDSL · Sumter
- 2024 margin
- Solid R (+37.6) · D 30.9% · R 68.6%
- 2008→2024 swing
- -10.6pp toward R · 2008: -27.0pp · 2024: -37.6pp
- All cycles
- 2024: R+37.6 2020: R+36.1 2016: R+39.2 2012: R+34.9 2008: R+27.0
Not yet ingested
- Civics
- —
Market trends
- HPI YoY
- ▼ -45.24%
- Current HPI
- 237.6208
- Rent YoY
- ▲ 4.03%
- Metro
- Orlando-Kissimmee-Sanford, FL
- State GDP YoY
- ▲ 3.28%
- F500 in state
- 36
Industry mix (Fortune 500 HQ in FL)
| Industry | F500 HQs | Revenue |
|---|---|---|
| Industrial Technology | 2 | $29B |
|
||
| Insurance | 2 | $17B |
|
||
| Retail | 1 | $60B |
|
||
| Technology Distribution | 1 | $58B |
|
||
| Homebuilding | 1 | $35B |
|
||
| Technology Manufacturing | 1 | $35B |
|
||
Price history
+196.1% since first listed5 events — show timeline
- 2026-06-08 Price Changed $225,000 Stellar MLS as Distributed by MLS Grid
- 2026-06-08 Listed $219,000 Stellar MLS as Distributed by MLS Grid
- 2009-08-20 Sold (Public Records) $136,000 Public Records
- 1998-12-31 Sold (Public Records) $83,000 Public Records
- 1996-12-20 Sold (Public Records) $76,000 Public Records
Property tax history
+2.1%/yrLatest (2025): $1,536 · +1.3% YoY. Source: county tax records.
Cash-flow waterfall
monthlySold comps — $/sqft
last 12 mo · ≤1 miLoading sold comps…