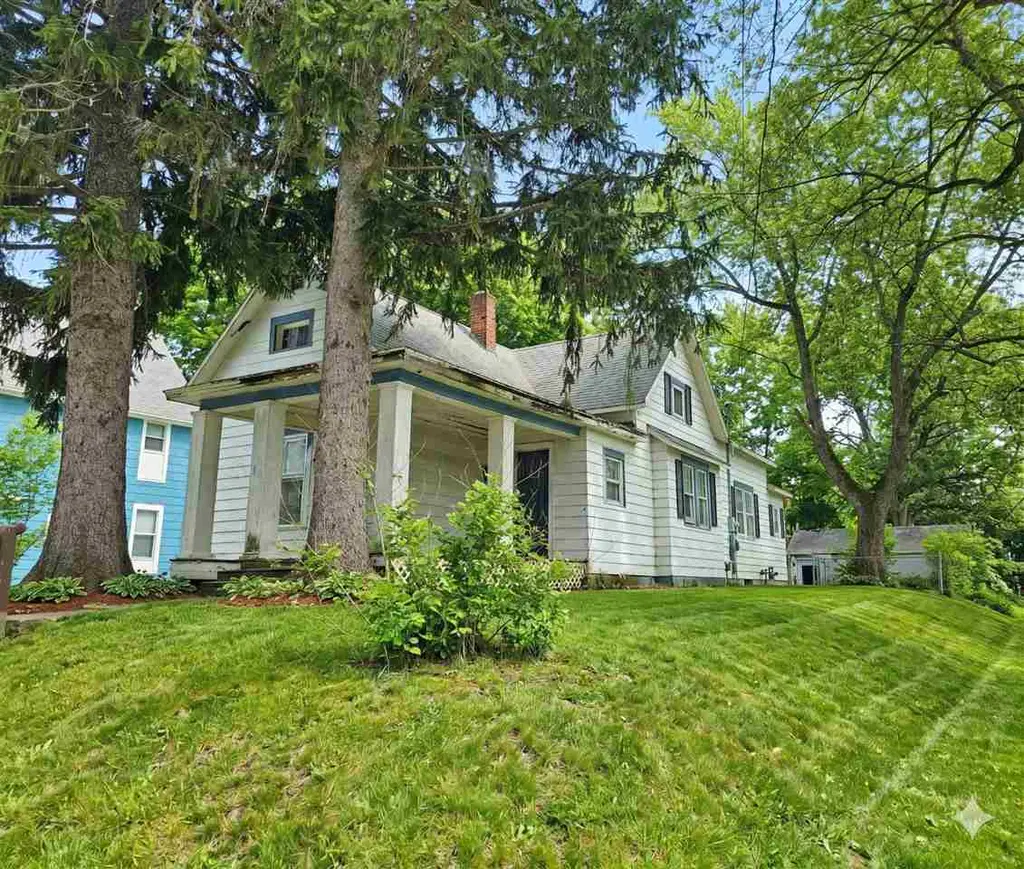
125 W 20th St · Marion, IN
Flood risk 1/10 · Minimal
- FEMA flood zone
- X (unshaded)
- Chance of flooding over 30 yrs
- 0.0%
- Est. flood insurance / yr
- $473 – $860
Fire risk 1/10 · Minimal
- Est. fire insurance / yr
- $717 – $1,331
Heat risk 3/10 · Minor
- Hot days now (above 100°F)
- 7 days/yr
- Hot days in 30 yrs
- 18 days/yr
Wind risk 2/10 · Minimal
- Chance of severe wind over 30 yrs
- —
Air-quality risk 2/10 · Minimal
- Unhealthy air days now
- 1 days/yr
- Unhealthy air days in 30 yrs
- 2 days/yr
Risk factors via First Street. Map © Google.
Why this score? — see what drove the B grade
The composite is a weighted blend of 9 inputs, each scored 0–100. Each bar is that input's sub-score; the figure is the points it added to the 100-point composite (weight × sub-score).
- Cash flow +30.0/30.0
- 1% rule +10.0/10.0
- DSCR +10.0/10.0
- ARV discount +5.1/15.0
- Appreciation +5.0/10.0
- Livability +3.2/5.0
- Rent growth +2.5/5.0
- Condition / age +2.5/5.0
- Schools +1.7/10.0
$64,599
🖨 Deal sheet 📄 Offer letter ✓ Due diligence
Listing remarks
SELLER FINANCING AVAILABLE! Welcome to 125 West 20th Street, Marion, Indiana—a property brimming with potential and opportunity. This charming home is sold as is, making it an excellent canvas for your creative vision. The property boasts a nice-sized yard, perfect for outdoor activities, as well as a detached one-car garage that offers ample storage space and convenience. Inside, you'll find three bedrooms, beautiful hardwood floors, enhancing the property's appeal. The home's layout is versatile, ideal for both investors looking to add value and homebuyers seeking a project to make their own. Located in a friendly neighborhood, this property is close to local amenities, schools, and
Key facts
- Close to parks
- Close to schools
- Nice sized yard
Tags
Property features AI
Exterior
- Parking: Has garage (1.5 garage spaces)
- Utilities: Public water; Public sewer
- Home design: Single-family residence; One story
- Construction: Aluminum siding
- Exterior features: Chain link fencing; Shingle roof
Interior
- Bedrooms: 5 total rooms (bedroom count not specified)
- Bathrooms: 1 full bathroom
- Interior features: Basement
Neighborhood map
What this means for you Summary
Snapshot
- This is a 3-bed/1.0-bath single-family listed at $65k.
Deal economics
- At list price, monthly cash flow is $522 ($6k/yr) — positive.
- The deal already cash-flows at list — no discount required.
- Meets the 1% rule at list price ($1k rent vs $65k).
- Recommended offer: $63k (3.0% below list) — sets the bar for market timing.
- Cap rate 16.0% vs local median 8.7% in Marion — top-decile yield for the area; either an underpriced asset or a hidden risk that comps aren't pricing in. Stress-test before assuming the spread holds.
Location & tenants
- Location reads 65/100 on livability (#337 in IN) — a middle-class / working-renter tenant base. Strengths: crime A+, cost of living A+, housing A+; Watch: schools F, amenities F, commute F.
- Marion Community Schools (town): math 18% / reading 24% proficiency, ranked #277 of 301 in IN (top 92%) — low school quality limits family demand, transient renter base, plan for 1-2y turnover; 67% free/reduced lunch — lower-income household profile, screen leases tightly.
- Market conditions: 1 active listings in the ZIP; 1 comparable units currently listed for rent nearby; 52 units permitted in Grant County in 2024 (8 in 5+ unit buildings).
Forward outlook
- In year one you build about $2k of equity ($446 loan paydown + $2k appreciation (3.0% local appreciation)).
- Grant County population projected at -18% by 2050 — secular population decline; favor cash flow + early exit over multi-decade hold.
- At projected returns (3.0% appreciation + 3.0% rent growth), your $18k cash investment doubles in ~3 years — after that, you're playing with house money.
Negotiation context
- It's been on market 46 days — a 3% lower offer ($63k) is reasonable based on typical stale-listing flexibility.
Risks & watch-outs
- Watch-outs: built in 1900 — expect roof / HVAC / electrical / plumbing capex.
Questions for the listing agent
- It's been on market 46 days. Have you received any prior offers? Is the seller open to a 3% concession, seller financing, or rate buy-down credit?
- Built in 1900 — when were the roof, HVAC, electrical panel, plumbing, and water heater last replaced?
- Is there a deadline driving the sale (1031 exchange, divorce, estate, relocation)? That informs how much negotiation room exists.
- Schools are F-rated, which usually means shorter tenancies and higher turnover. Who's the typical renter profile here, and what's been the actual vacancy rate?
- What's the average days-on-market for RENTAL listings here right now (not sales)? A rising rental-DOM trend means longer vacancies and softer asking-rent achievability than the comps imply.
- What's the recent tenant-quality profile in this submarket — average credit score on applications, eviction rate, late-payment / NSF rate, and stable-employment percentage? A property-management company in the area should have these aggregated.
- How much new for-sale + rental construction is in the pipeline within 1–3 miles? Heavy new supply typically softens prices + rents 12–24 months out; constrained supply supports both.
Investment metrics
- 1% rule
- 1.86% ✓
- Cap rate
- 15.99%
- Cash-on-cash
- 34.62%
- DSCR
- 2.54
- GRM
- 4.5
CMA / ARV
- ARV (median comp)
- $61,332
- List price
- $64,599
- Delta
- 5.33%
- Verdict
- FAIR
- Comps
- 20 within 1.0 mi
Show comp detail 12 sales within ~0.75 mi
| Address | Dist | Beds/Ba | Sqft | Sold | Price | $/sf | Match |
|---|---|---|---|---|---|---|---|
| 617 E 27th St | 0.57mi | 3/1.0 | 1,212 (-2%) | 2mo | $40,000 | $33 | 69 |
| 2520 S Selby St | 0.44mi | 3/1.0 | 1,152 (-6%) | 10mo | $105,000 | $91 | 60 |
| 120 W 14th St | 0.39mi | 2/1.0 (-1) | 1,276 (+4%) | 14mo | $64,900 | $51 | 59 |
| 114 W 30th St | 0.60mi | 3/1.0 | 1,188 (-4%) | 13mo | $25,000 | $21 | 55 |
| 2911 S Nebraska St | 0.60mi | 2/1.0 (-1) | 1,260 (+2%) | 15mo | $6,000 | $5 | 51 |
| 2711 S Washington St | 0.45mi | 3/1.0 | 1,360 (+10%) | 14mo | $25,000 | $18 | 50 |
| 2447 S Meridian St | 0.45mi | 3/1.5 | 1,368 (+11%) | 12mo | $119,400 | $87 | 48 |
| 2500 S Waite St | 0.75mi | 3/1.0 | 1,180 (-4%) | 13mo | $47,000 | $40 | 48 |
| 916 S Nebraska St | 0.70mi | 3/1.0 | 1,088 (-12%) | 2mo | $30,000 | $28 | 46 |
| 2922 S Nebraska St | 0.63mi | 2/1.0 (-1) | 1,160 (-6%) | 12mo | $500 | — | 46 |
| 1003 W 12th St | 0.72mi | 3/1.0 | 1,120 (-9%) | 14mo | $50,000 | $45 | 40 |
| 2809 S Landess St | 0.68mi | 2/1.0 (-1) | 1,054 (-14%) | 9mo | $90,000 | $85 | 32 |
Match score weights: distance 35% · size 25% · config 20% · recency 20%. Top-matched comps best support the ARV.
Projected returns pro-forma
3.0% appreciation · 3.0% rent growth · sell at horizon
- IRR
- 40.3%
- Equity multiple
- 3.27×
- Total profit
- $41,023
- Equity at exit
- $29,047
- IRR
- 40.2%
- Equity multiple
- 6.50×
- Total profit
- $99,477
- Equity at exit
- $44,764
Cash invested: $18,088 (down + closing). Projections, not guarantees.
Landlord ↔ Tenant lean methodology
- Overall (STATE)
- 90 Strongly Landlord-Friendly
- State Indiana
- 90 Strongly Landlord-Friendly · R+11
- County
- — inherits STATE
- City
- — inherits STATE
ZIP-level market 47953
- Active inventory
- 1
- Price-to-rent
- 4.5×
Monthly cashflow live
- Estimated rent
- $1,200 medium interval (Pro) →
- Mortgage (P&I)
- −$339
- Tax from tax record
- −$60 /mo · $726/yr
- Insurance
- −$27
- HOA
- −$0
- Vacancy / Maint / Mgmt
- −$252
- Net cashflow
- $522
Break-even live
UW: 25.0% down · 7.5% · 30yr · 1.5% tax · 5.0% vac · 8.0% maint · 8.0% mgmt
Financing live
Cash to close
- Down payment
- $16,150
- Closing costs
- $1,938
- Reserves months
- —
- Total cash needed
- —
Loan-product check · same deal, 3 products live
Conventional
25% down · 7.5% · 30yr
- Down + closing
- —
- Monthly P&I
- —
- Monthly cashflow
- —
- DSCR
- —
- Eligible?
- —
Personal DTI + credit; lowest rate.
DSCR
20% down · 8.5% · 30yr
- Down + closing
- —
- Monthly P&I
- —
- Monthly cashflow
- —
- DSCR
- —
- Eligible?
- —
No personal income docs; deal must DSCR.
Hard money
10% down · 12.0% · 12mo
- Down + closing
- —
- Monthly P&I
- —
- Monthly cashflow
- —
- DSCR
- —
- Eligible?
- —
Short-term bridge; refi at stabilization.
Rent comps 1 comps
| Address | Beds | Baths | Sqft | Rent | $/sqft | DOM | Units | Dist |
|---|---|---|---|---|---|---|---|---|
| 703 E 28th St Marion, IN | 2.0 | 1.0 | 1085 | $1,200 | $1.11 | 43d | 1 | 0.65mi |
Listing history 17 events
-
2026-06-19days on market $64,599 Active 46 DOM
-
2026-06-18days on market $64,599 Active 45 DOM
-
2026-06-17days on market $64,599 Active 44 DOM
-
2026-06-16days on market $64,599 Active 43 DOM
-
2026-06-15days on market $64,599 Active 42 DOM
-
2026-06-14days on market $64,599 Active 40 DOM
-
2026-06-12days on market $64,599 Active 39 DOM
-
2026-06-09days on market $64,599 Active 36 DOM
-
2026-06-08days on market $64,599 Active 35 DOM
-
2026-06-07days on market $64,599 Active 34 DOM
-
2026-06-02days on market $64,599 Active 29 DOM
-
2026-06-01days on market $64,599 Active 28 DOM
-
2026-05-31days on market $64,599 Active 27 DOM
-
2026-05-30days on market $64,599 Active 26 DOM
-
2026-05-04$64,599 Active 895-char remark
-
2025-11-18price $64,599
-
2025-05-23price $64,600
ⓘ Source: listings_history table (triggers on properties + properties_extension) + one-shot
backfill from property_details.listing_events for pre-trigger history.
Tax reassessment forecast IN · Partial reset (capped growth)
- Current annual tax
- $726 · $60/mo
- Projected year-2 tax
- $726 · $60/mo
- Expected delta
- $0/yr ($0/mo · 0.0%)
ⓘ Screening estimate from a state-policy table — verify with the county assessor before closing.
Climate risk First Street
- Flood 1/10 Low FEMA zone X (unshaded) · 0% chance over 30 yrs
- Wildfire 1/10 Low
- Heat 3/10 Moderate 7 d/yr ≥100°F today · 18 d/yr by 30 yrs out
- Wind 2/10 Low
- Air quality 2/10 Low 1 unhealthy d/yr today · 2 by 30 yrs out
Nearby sold comps map
Loading sold comps map…
Walkable amenities ~0.75 mi
Loading nearby amenities…
Taxation est. · year 1
- Rental income
- $14,400
- − Mortgage interest
- −$3,619
- − Property taxes
- −$726
- − Insurance
- −$323
- − Repairs & maintenance
- −$1,152
- − Management
- −$1,152
- − Depreciation
- −$1,879
- Taxable income
- $5,549
- Est. tax owed @ 24.0%
- −$1,332
- After-tax cash flow
- $4,930/yr
For passive investors: Depreciation is non-cash, so a rental often shows a tax loss while cash-flowing — sheltering income. Rental losses are passive: they offset passive income freely, and up to $25,000/yr can offset ordinary (W-2) income if you actively participate and your MAGI is under $100k (phasing out to $0 by $150k); unused losses carry forward. On sale, claimed depreciation is recaptured at up to 25%, and gains may owe capital-gains tax (a 1031 exchange can defer both). Figures are a year-1 estimate at your 24.0% rate — not tax advice; consult a CPA.
Schools (NCES district)
- District
- Marion Community Schools
- NCES district ID
- 1806390
- Math proficiency
- 18% ▼ -9.00%
- Reading proficiency
- 24% ▼ -6.00%
- Median HH income
- $33,415
- Composite
- 17.13/100
- National rank
- #9115
- State rank
- #277 of 301 in IN
Livability — Marion
- Score
- 65/100
- State rank
- #337
- US rank
- #13006
Category grades
Schools grade is shown separately in the Schools card above.
Census & demographics
- Census place
- Marion, IN
Population outlook (Grant County) Hauer SSP2
- Today (2025)
- 64,394 people
- By 2030
- 62,145 · -3.5%
- By 2040
- 57,252 · -11.1%
- By 2050
- 52,968 · -17.7%
- By 2075
- 45,986 · -28.6%
- By 2100
- 39,400 · -38.8%
Not yet ingested
- Political lean
- —
- Race & ethnicity
- —
- Common origin
- —
- Civics
- —
Market trends
- HPI YoY
- —
- Current HPI
- —
- Rent YoY
- —
- Metro
- —
- State GDP YoY
- ▲ 2.90%
- F500 in state
- 18
Industry mix (Fortune 500 HQ in IN)
| Industry | F500 HQs | Revenue |
|---|---|---|
| Industrial Machinery | 2 | $37B |
|
||
| Healthcare | 1 | $177B |
|
||
| Pharmaceuticals | 1 | $45B |
|
||
| Metals / Steel | 1 | $18B |
|
||
| Agriculture | 1 | $17B |
|
||
| Packaging | 1 | $12B |
|
||
Price history
-0.0% since first listed3 events — show timeline
- 2026-05-04 Listed $64,599 RRELMS
- 2025-11-18 Price Changed $64,599 RRELMS
- 2025-05-23 Price Changed $64,600 RRELMS
Property tax history
+3.3%/yrLatest (2025): $726 · +9.7% YoY. Source: county tax records.
Cash-flow waterfall
monthlySold comps — $/sqft
last 12 mo · ≤1 miLoading sold comps…