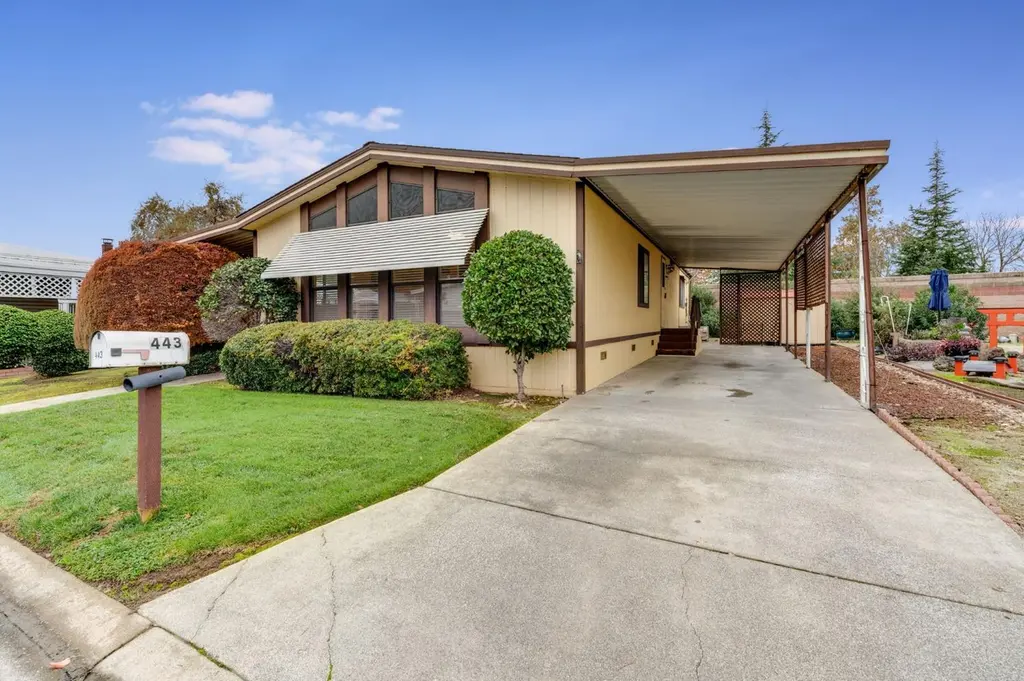
443 Royal Crest Cir · Rancho Cordova, CA
Flood risk 1/10 · Minimal
- FEMA flood zone
- X (unshaded)
- Chance of flooding over 30 yrs
- 0.0%
- Est. flood insurance / yr
- $507 – $1,088
Fire risk 5/10 · Moderate
- Est. fire insurance / yr
- $659 – $1,223
Heat risk 7/10 · Major
- Hot days now (above 102°F)
- 7 days/yr
- Hot days in 30 yrs
- 16 days/yr
Wind risk 1/10 · Minimal
- Chance of severe wind over 30 yrs
- —
Air-quality risk 10/10 · Severe
- Unhealthy air days now
- 33 days/yr
- Unhealthy air days in 30 yrs
- 35 days/yr
Risk factors via First Street. Map © Google.
Why this score? — see what drove the B+ grade
The composite is a weighted blend of 9 inputs, each scored 0–100. Each bar is that input's sub-score; the figure is the points it added to the 100-point composite (weight × sub-score).
- Cash flow +30.0/30.0
- ARV discount +14.6/15.0
- 1% rule +10.0/10.0
- DSCR +10.0/10.0
- Schools +4.4/10.0
- Livability +3.4/5.0
- Rent growth +2.7/5.0
- Condition / age +2.5/5.0
- Appreciation +0.0/10.0
$94,888
🖨 Deal sheet 📄 Offer letter ✓ Due diligence
Listing remarks
Attractive mobile home clean includes built in microwave, refrigerator, washer and dryer. Kitchen has laminate flooring. Large laundry room with space for freezer. This double wide unit is available for quick move in. Quiet and well-maintained park with many highlights. Newly painted.
Key facts
- Built in microwave
- Large laundry room
- 2 parking spots
Tags
Neighborhood map
What this means for you Summary
Snapshot
- This is a 2-bed/2.0-bath manufactured listed at $95k.
Deal economics
- At list price, monthly cash flow is $1k ($13k/yr) — positive.
- The deal already cash-flows at list — no discount required.
- Meets the 1% rule at list price ($2k rent vs $95k).
- Recommended offer: $84k (12.0% below list) — sets the bar for market timing.
- Cap rate 19.5% vs local median 3.0% in Rancho Cordova — top-decile yield for the area; either an underpriced asset or a hidden risk that comps aren't pricing in. Stress-test before assuming the spread holds.
Location & tenants
- Location reads 68/100 on livability (#268 in CA) — a middle-class / working-renter tenant base. Strengths: housing A+, employment B; Watch: schools C-, commute C-, crime D.
- San Juan Unified (suburban): math 40% / reading 62% proficiency, ranked #138 of 517 in CA (top 27%) — acceptable for families but not a draw, mixed tenant base, ~2y average lease.
- Market conditions: Rents flat; 223 active listings in the ZIP; 23 comparable units currently listed for rent nearby; rentals at typical pace (median 20d on market — plan ~3-4 weeks tenant-placement turnaround); solid renter incomes; 6,825 units permitted in Sacramento County in 2024 (1,752 in 5+ unit buildings).
Forward outlook
- Local home prices are declining (-3.0%/yr); year-one equity from $656 of loan paydown is wiped out by about $3k of value loss. Plan a longer hold.
- Sacramento County population projected at +17% by 2050 — long-run rental-demand tailwind backs the buy-and-hold thesis.
- At projected returns (-3.0% appreciation + 0.9% rent growth), your $27k cash investment doubles in ~3 years — after that, you're playing with house money.
Negotiation context
- It's been on market 133 days — a 12% lower offer ($84k) is reasonable based on typical stale-listing flexibility.
- Current owner paid $44k; list at $95k implies a 118% gain — meaningful room to come down on a strong offer.
Risks & watch-outs
- Climate carrying-cost: moderate wildfire risk; extreme-heat days projected 7→16/yr by 2055 (HVAC capex compounding) — expect insurance premiums to compound above CPI over the hold.
Questions for the listing agent
- It's been on market 133 days. Have you received any prior offers? Is the seller open to a 12% concession, seller financing, or rate buy-down credit?
- Why hasn't it sold? Are there any deal-killer items the seller is aware of (foundation, flood, title, zoning, code violations)?
- Is there a deadline driving the sale (1031 exchange, divorce, estate, relocation)? That informs how much negotiation room exists.
- Crime grade is D in this area — have there been break-ins, vandalism, or insurance claims at this property in the last 3 years? What carrier currently insures it and at what premium?
- What's the average days-on-market for RENTAL listings here right now (not sales)? A rising rental-DOM trend means longer vacancies and softer asking-rent achievability than the comps imply.
- What's the recent tenant-quality profile in this submarket — average credit score on applications, eviction rate, late-payment / NSF rate, and stable-employment percentage? A property-management company in the area should have these aggregated.
- How much new for-sale + rental construction is in the pipeline within 1–3 miles? Heavy new supply typically softens prices + rents 12–24 months out; constrained supply supports both.
Investment metrics
- 1% rule
- 2.14% ✓
- Cap rate
- 19.53%
- Cash-on-cash
- 47.26%
- DSCR
- 3.10
- GRM
- 3.9
CMA / ARV
- ARV (median comp)
- $112,672
- List price
- $94,888
- Delta
- -15.78%
- Verdict
- UNDERPRICED
- Comps
- 18 within 1.0 mi
Show comp detail 12 sales within ~0.75 mi
| Address | Dist | Beds/Ba | Sqft | Sold | Price | $/sf | Match |
|---|---|---|---|---|---|---|---|
| 396 Ravine Cir | 0.06mi | 2/2.0 | 1,280 (+3%) | 1mo | $115,000 | $90 | 93 |
| 311 Sunny Hills Dr | 0.16mi | 2/2.0 | 1,200 (-4%) | 5mo | $99,900 | $83 | 82 |
| 192 Whispering Pines Dr | 0.32mi | 2/2.0 | 1,248 (0%) | 11mo | $65,000 | $52 | 76 |
| 55 Sheri Ridge Way | 0.37mi | 2/2.0 | 1,212 (-3%) | 8mo | $129,900 | $107 | 71 |
| 191 Whispering Pines Dr | 0.31mi | 2/2.0 | 1,152 (-8%) | 8mo | $65,000 | $56 | 66 |
| 131 Royal Wood Ln | 0.27mi | 2/2.0 | 1,095 (-12%) | 3mo | $140,000 | $128 | 64 |
| 386 Crystal View Ln | 0.09mi | 2/2.0 | 1,400 (+12%) | 14mo | $112,500 | $80 | 64 |
| 172 Rolling River Ln | 0.46mi | 2/2.0 | 1,160 (-7%) | 10mo | $105,000 | $91 | 58 |
| 146 Gumtree Dr | 0.36mi | 2/2.0 | 1,100 (-12%) | 10mo | $126,000 | $115 | 55 |
| 181 Whispering Pines Dr | 0.38mi | 2/2.0 | 1,368 (+10%) | 14mo | $109,000 | $80 | 54 |
| 66 Pineacre Ln | 0.40mi | 2/2.0 | 1,080 (-14%) | 8mo | $126,900 | $118 | 52 |
| 126 Royalwood Ln | 0.26mi | 3/2.0 (+1) | 1,080 (-14%) | 14mo | $110,000 | $102 | 49 |
Match score weights: distance 35% · size 25% · config 20% · recency 20%. Top-matched comps best support the ARV.
Projected returns pro-forma
-3.0% appreciation · 0.9% rent growth · sell at horizon
- IRR
- 42.3%
- Equity multiple
- 2.77×
- Total profit
- $47,032
- Equity at exit
- $14,148
- IRR
- 47.5%
- Equity multiple
- 5.14×
- Total profit
- $110,107
- Equity at exit
- $8,204
Cash invested: $26,569 (down + closing). Projections, not guarantees.
Landlord ↔ Tenant lean methodology
- Overall (STATE)
- 18 Strongly Tenant-Friendly
- State California
- 18 Strongly Tenant-Friendly · D+13
- County
- — inherits STATE
- City
- — inherits STATE
ZIP-level market 95670
- Rents YoY
- 0.9%
- Active inventory
- 223
- Price-to-rent
- 3.9×
Monthly cashflow live
- Estimated rent
- $2,032 high interval (Pro) →
- Mortgage (P&I)
- −$498
- Tax from tax record
- −$22 /mo · $259/yr
- Insurance
- −$40
- HOA
- −$0
- Vacancy / Maint / Mgmt
- −$427
- Net cashflow
- $1,046
Break-even live
UW: 25.0% down · 7.5% · 30yr · 1.5% tax · 5.0% vac · 8.0% maint · 8.0% mgmt
Financing live
Cash to close
- Down payment
- $23,722
- Closing costs
- $2,847
- Reserves months
- —
- Total cash needed
- —
Loan-product check · same deal, 3 products live
Conventional
25% down · 7.5% · 30yr
- Down + closing
- —
- Monthly P&I
- —
- Monthly cashflow
- —
- DSCR
- —
- Eligible?
- —
Personal DTI + credit; lowest rate.
DSCR
20% down · 8.5% · 30yr
- Down + closing
- —
- Monthly P&I
- —
- Monthly cashflow
- —
- DSCR
- —
- Eligible?
- —
No personal income docs; deal must DSCR.
Hard money
10% down · 12.0% · 12mo
- Down + closing
- —
- Monthly P&I
- —
- Monthly cashflow
- —
- DSCR
- —
- Eligible?
- —
Short-term bridge; refi at stabilization.
Rent comps 23 comps
| Address | Beds | Baths | Sqft | Rent | $/sqft | DOM | Units | Dist |
|---|---|---|---|---|---|---|---|---|
| 2437 Rashawn Dr Rancho Cordova, CA | 2.0 | 1.0 | 970 | $1,900 | $1.96 | 7d | 1 | 0.21mi |
| 11260 Point East Dr Rancho Cordova, CA | 1.0–2.0 | 1.0 | 615 | $1,985 | $3.23 | 1d | 29 | 0.23mi |
| 11070 Hirschfeld Way Rancho Cordova, CA | 1.0–2.0 | 1.0 | 800 | $1,880 | $2.35 | 2d | 4 | 0.29mi |
| 2330 Vehicle Dr Rancho Cordova, CA | 1.0–2.0 | 1.0–2.0 | 847 | $2,225 | $2.63 | 2d | 1 | 0.35mi |
| 2330 Vehicle Dr Rancho Cordova, CA | 1.0–2.0 | 1.0–2.0 | 847 | $2,230 | $2.63 | 20d | 9 | 0.35mi |
| 11150 Trinity River Dr Rancho Cordova, CA | 2.0–3.0 | 2.0 | 1091 | $1,850 | $1.69 | 43d | 2 | 0.60mi |
| 11112 Congo River Ct Rancho Cordova, CA | 3.0 | 2.0 | 1407 | $2,750 | $1.95 | 17d | 1 | 0.62mi |
| 11150 Trinity River Dr #79 Rancho Cordova, CA | 2.0 | 1.0 | 941 | $1,980 | $2.10 | 23d | 1 | 0.64mi |
| 2220 Cemo Cir Gold River, CA | 2.0–3.0 | 2.0 | 1203 | $2,499 | $2.08 | 1d | 7 | 0.69mi |
| 10922 Scotsman Way Rancho Cordova, CA | 2.0 | 2.0 | 1100 | $2,050 | $1.86 | 17d | 1 | 0.75mi |
| 10890 Coloma Rd Rancho Cordova, CA | 2.0 | 1.0 | 925 | $1,499 | $1.62 | 23d | 3 | 0.76mi |
| 10918 Scotsman Way Unit 10918 Rancho Cordova, CA | 2.0 | 2.0 | 1183 | $1,795 | $1.52 | 43d | 1 | 0.77mi |
| 2253 Zinfandel Dr Rancho Cordova, CA | 3.0 | 2.0 | 1204 | $2,200 | $1.83 | 43d | 1 | 0.79mi |
| 2652 Los Nogales Way Rancho Cordova, CA | 2.0 | 2.0 | 1000 | $2,000 | $2.00 | 43d | 1 | 0.82mi |
| 10870 Coloma Rd Rancho Cordova, CA | 2.0 | 1.0 | 950 | $1,499 | $1.58 | 2d | 1 | 0.83mi |
| 2657 McGregor Dr Rancho Cordova, CA | 2.0 | 2.0 | 1012 | $1,595 | $1.58 | 43d | 1 | 0.84mi |
| 10780 Coloma Rd Rancho Cordova, CA | 1.0–2.0 | 1.0 | 760 | $1,515 | $1.99 | 2d | 7 | 0.94mi |
| 1990 Benita Dr Rancho Cordova, CA | 2.0 | 1.5 | 960 | $2,300 | $2.40 | 43d | 1 | 0.95mi |
| 10680 Coloma Rd Rancho Cordova, CA | 1.0–2.0 | 1.0 | 730 | $1,889 | $2.59 | 2d | 11 | 1.13mi |
| 2751 Don Juan Dr Apt 16 Rancho Cordova, CA | 2.0 | 1.5 | 960 | $1,875 | $1.95 | 43d | 1 | 1.19mi |
| 2730 Don Juan Dr Rancho Cordova, CA | 2.0 | 1.0 | 800 | $1,650 | $2.06 | 43d | 2 | 1.25mi |
| 2720 Riesling Way Rancho Cordova, CA | 2.0 | 1.0 | 840 | $1,595 | $1.90 | 21d | 1 | 1.37mi |
| 2669 Chassella Way Rancho Cordova, CA | 3.0 | 2.0 | 1250 | $2,000 | $1.60 | 7d | 1 | 1.50mi |
Listing history 1 events
-
2008-09-26soldstatus $43,500
ⓘ Source: listings_history table (triggers on properties + properties_extension) + one-shot
backfill from property_details.listing_events for pre-trigger history.
Tax reassessment forecast CA · Resets to sale price
- Current annual tax
- $259 · $22/mo
- Projected year-2 tax
- $721 · $60/mo
- Expected delta
- +$462/yr (+$38/mo · 178.3%)
ⓘ Screening estimate from a state-policy table — verify with the county assessor before closing.
Climate risk First Street
- Flood 1/10 Low FEMA zone X (unshaded) · 0% chance over 30 yrs
- Wildfire 5/10 Major
- Heat 7/10 Severe 7 d/yr ≥102°F today · 16 d/yr by 30 yrs out
- Wind 1/10 Low
- Air quality 10/10 Extreme 33 unhealthy d/yr today · 35 by 30 yrs out
Nearby sold comps map
Loading sold comps map…
Walkable amenities ~0.75 mi
Loading nearby amenities…
Taxation est. · year 1
- Rental income
- $24,381
- − Mortgage interest
- −$5,315
- − Property taxes
- −$259
- − Insurance
- −$474
- − Repairs & maintenance
- −$1,950
- − Management
- −$1,950
- − Depreciation
- −$2,760
- Taxable income
- $11,671
- Est. tax owed @ 24.0%
- −$2,801
- After-tax cash flow
- $9,755/yr
For passive investors: Depreciation is non-cash, so a rental often shows a tax loss while cash-flowing — sheltering income. Rental losses are passive: they offset passive income freely, and up to $25,000/yr can offset ordinary (W-2) income if you actively participate and your MAGI is under $100k (phasing out to $0 by $150k); unused losses carry forward. On sale, claimed depreciation is recaptured at up to 25%, and gains may owe capital-gains tax (a 1031 exchange can defer both). Figures are a year-1 estimate at your 24.0% rate — not tax advice; consult a CPA.
Schools (NCES district)
- District
- San Juan Unified
- NCES district ID
- 0634620
- Math proficiency
- 40% ▲ 3.00%
- Reading proficiency
- 62% ▲ 16.00%
- Median HH income
- $55,655
- Composite
- 44.07/100
- National rank
- #2878
- State rank
- #138 of 517 in CA
Livability — Rancho Cordova
- Score
- 68/100
- State rank
- #268
- US rank
- #9126
Category grades
Schools grade is shown separately in the Schools card above.
Census & demographics
- Census place
- Rancho Cordova, CA
- County
- Sacramento County · 1,539,646 people
- City population
- 98,329
- Metro
- Sacramento-Roseville-Folsom, CA
- Population (ZIP)
- 58,819
- Household income
- $89,484
- Rent vs Own
- Severe rent burden
- 2389.0
Population outlook (Sacramento County) Hauer SSP2
- Today (2025)
- 1,660,763 people
- By 2030
- 1,732,990 · +4.3%
- By 2040
- 1,855,755 · +11.7%
- By 2050
- 1,941,335 · +16.9%
- By 2075
- 2,046,162 · +23.2%
- By 2100
- 1,961,444 · +18.1%
Race, ethnicity, and origin ACS 2023
- Neighborhood character
- Diverse neighborhood (Simpson 0.67)
- Race & ethnicity
- White 51% Hispanic / Latino 21% Two or more races 12% Asian 12% Black 10% Native American 1%
- Hispanic origin (detail)
- Mexican 17%
- Common ancestry
- Scotch-Irish 2% Subsaharan African 2% Italian 2%
- Foreign-born
- 24% · Canada, Vietnam, South Korea
- Languages at home
- 66% English-only · Spanish 13% Other Indo-European 7% Russian/Polish/Slavic 5%
Political lean MEDSL · Sacramento
- 2024 margin
- D (+19.7) · D 58.1% · R 38.4% · Other 3.5%
- 2008→2024 swing
- +0.7pp no change · 2008: 19.0pp · 2024: 19.7pp
- All cycles
- 2024: D+19.7 2020: D+25.3 2016: D+23.7 2012: D+16.3 2008: D+19.0
Not yet ingested
- Civics
- —
Market trends
- HPI YoY
- ▼ -263.38%
- Current HPI
- 300.0788
- Rent YoY
- ▲ 0.90%
- Metro
- Sacramento-Roseville-Folsom, CA
- State GDP YoY
- ▲ 3.21%
- F500 in state
- 116
Industry mix (Fortune 500 HQ in CA)
| Industry | F500 HQs | Revenue |
|---|---|---|
| Technology | 27 | $1,492B |
|
||
| Financial Services | 3 | $174B |
|
||
| Retail | 3 | $44B |
|
||
| Insurance | 3 | $26B |
|
||
| Media / Entertainment | 2 | $115B |
|
||
| Pharmaceuticals / Biotech | 2 | $62B |
|
||
Price history
1 event — show timeline
- 2008-09-26 Sold (Public Records) $43,500 Public Records
Property tax history
+3.3%/yrLatest (2025): $259 · -2.2% YoY. Source: county tax records.
Cash-flow waterfall
monthlySold comps — $/sqft
last 12 mo · ≤1 miLoading sold comps…