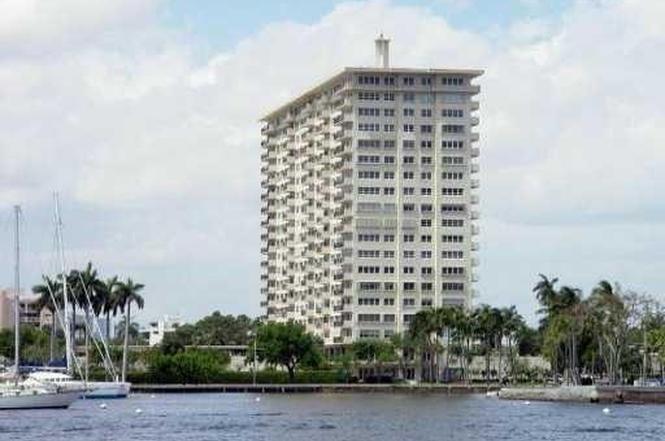
2500 E Las Olas Blvd #308 · Fort Lauderdale, FL
Flood risk 8/10 · Major
- FEMA flood zone
- AE
- Chance of flooding over 30 yrs
- 0.99%
- Est. flood insurance / yr
- $1,737 – $8,500
Fire risk 1/10 · Minimal
- Est. fire insurance / yr
- $947 – $1,759
Heat risk 10/10 · Severe
- Hot days now (above 105°F)
- 7 days/yr
- Hot days in 30 yrs
- 25 days/yr
Wind risk 10/10 · Severe
- Chance of severe wind over 30 yrs
- 99.0%
Air-quality risk 2/10 · Minimal
- Unhealthy air days now
- 1 days/yr
- Unhealthy air days in 30 yrs
- 1 days/yr
Risk factors via First Street. Map © Google.
Why this score? — see what drove the B- grade
The composite is a weighted blend of 9 inputs, each scored 0–100. Each bar is that input's sub-score; the figure is the points it added to the 100-point composite (weight × sub-score).
- Cash flow +20.3/30.0
- 1% rule +10.0/10.0
- ARV discount +7.5/15.0
- Appreciation +7.3/10.0
- DSCR +6.4/10.0
- Schools +4.1/10.0
- Livability +4.1/5.0
- Rent growth +3.3/5.0
- Condition / age +2.5/5.0
$449,000
🖨 Deal sheet 📄 Offer letter ✓ Due diligence
Listing remarks
Paradise awaits in this 3-BR spacious condo offering a blend of work, and coastal living on the famed Las Olas Blvd. Rare opportunity for buyers to add personal touches while building instant equity. New kitchen, new floors, and new HVAC, and new impact windows and door!Priced to accommodate updates! 1700 Sq. Ft. layout ideal for work from home office or guests. Easy access to the beach and city convenience. Well maintained, financially sound building with full reserves. Heated pool, covered parking, fitness center and 24 hr concierge. Vibrant neighborhood on the intercostal. A short walk across the bridge to Fort Lauderdale beach, authentic French Bakery, new City marina, and luxury hotels
Key facts
- New floors
- New kitchen
- Covered parking
Tags
Property features AI
Finance
- Financial info: Pets allowed
- HOA & community: Association amenities include: fitness center, pool, lobby, community room, library, hobby room, picnic area, car wash area, bike storage, storage, trash chute, kitchen facilities, parking, internet included; Monthly HOA fee (amount listed in source); HOA fee includes insurance, grounds maintenance, pest control, sewer, trash, water, elevator, reserve funds, and recreation facility
Exterior
- Parking: Assigned parking; Covered parking; Guest parking; Garage parking (attached); 1 covered/garage space (1 attached garage space); 83 total parking spaces in property
- Security: Fire sprinkler system; Security guard; Security system
- Utilities: Cable available
- Home design: Condominium; Resale unit; Faces north; 20-story building (unit in a high-rise)
- Construction: CBS construction
- Exterior features: East of US-1 frontage; Not waterfront
Interior
- Kitchen: Dishwasher; Electric range; Microwave
- Bedrooms: 3 bedrooms on main level
- Flooring: Laminate flooring; Tile flooring
- Bathrooms: 2 full bathrooms and 1 half bathroom (3 total, all on main level)
- Heating & cooling: Central electric heating; Central electric air conditioning
- Interior features: Entrance foyer; Walk-in closets; Blinds on windows
- Laundry & utility: Washer hookup; Dryer hookup
Neighborhood map
What this means for you Summary
Snapshot
- This is a 3-bed/3.0-bath condo listed at $449k.
Deal economics
- At list price, monthly cash flow is $145 ($2k/yr) — positive.
- The deal already cash-flows at list — no discount required.
- Meets the 1% rule at list price ($7k rent vs $449k).
- Recommended offer: $409k (9.0% below list) — sets the bar for market timing.
- Cap rate 7.8% vs local median 2.2% in Fort Lauderdale — top-decile yield for the area; either an underpriced asset or a hidden risk that comps aren't pricing in. Stress-test before assuming the spread holds.
Location & tenants
- Location reads 82/100 on livability (#78 in FL, #1,293 nationally) — a professional / high-income tenant draw. Strengths: crime A+, amenities A+, health & safety A+; Watch: cost of living D-.
- Broward (suburban): math 42% / reading 53% proficiency, ranked #46 of 73 in FL (top 63%) — families likely to look elsewhere, expect single-tenant / working-renter base with shorter leases.
- Zoned schools: Harbordale Elementary School (math 64% / reading 74%, grade A-, #399 of 2,144 statewide, top 19%, 487 students, 38% FRL); Sunrise Middle School (math 50% / reading 52%, grade C, #237 of 571 statewide, top 43%, 1,242 students, 64% FRL); Fort Lauderdale High School (math 38% / reading 67%, grade C-, #154 of 667 statewide, top 24%, 2,228 students, 57% FRL) — zoned schools at 53% FRL track the district average.
- Market conditions: Rents rising (+3.0%/yr); 469 active listings in the ZIP; 40 comparable units currently listed for rent nearby; rentals at typical pace (median 19d on market — plan ~3-4 weeks tenant-placement turnaround); high-income renter base; 2,111 units permitted in Broward County in 2024 (1,265 in 5+ unit buildings).
Forward outlook
- In year one you build about $24k of equity ($3k loan paydown + $21k appreciation (4.6% local appreciation)).
- Broward County population projected at +34% by 2050 — long-run rental-demand tailwind backs the buy-and-hold thesis.
- At projected returns (4.6% appreciation + 3.0% rent growth), your $126k cash investment doubles in ~5 years — after that, you're playing with house money.
- By year 2, paydown + projected appreciation supports a ~$38k cash-out refi (75% LTV) — recoverable capital for the next deal without selling this one.
Negotiation context
- It's been on market 99 days — a 9% lower offer ($409k) is reasonable based on typical stale-listing flexibility.
- Current owner paid $355k; 26% above their basis — modest negotiation headroom, anchor on the comps not their cost.
Risks & watch-outs
- Watch-outs: flood insurance adds $427/mo; HOA is 27% of rent.
- Climate carrying-cost: in FEMA flood zone AE (mandatory federal flood insurance); severe wind risk, 99% chance of damaging wind over 30y; extreme-heat days projected 7→25/yr by 2055 (HVAC capex compounding) — expect insurance premiums to compound above CPI over the hold.
Questions for the listing agent
- It's been on market 99 days. Have you received any prior offers? Is the seller open to a 9% concession, seller financing, or rate buy-down credit?
- Built in 1969 — when were the roof, HVAC, electrical panel, plumbing, and water heater last replaced?
- What's the actual annual flood-insurance premium (NFIP or private), and is the property in a SFHA with mandatory coverage?
- What does the HOA fee cover, when was the last increase, and are there any pending special assessments or reserve-fund shortfalls?
- Any open or pending special assessments — roof, HVAC, plumbing, elevator, façade? What's the per-unit balance and payoff schedule, and is the seller paying it off at close or rolling it to the buyer?
- Why hasn't it sold? Are there any deal-killer items the seller is aware of (foundation, flood, title, zoning, code violations)?
- Is there a deadline driving the sale (1031 exchange, divorce, estate, relocation)? That informs how much negotiation room exists.
- Schools are B-rated — typically a magnet for longer-tenancy family renters. What's the average tenant stay here, and is there a school-zone premium baked into asking?
- What's the average days-on-market for RENTAL listings here right now (not sales)? A rising rental-DOM trend means longer vacancies and softer asking-rent achievability than the comps imply.
- What's the recent tenant-quality profile in this submarket — average credit score on applications, eviction rate, late-payment / NSF rate, and stable-employment percentage? A property-management company in the area should have these aggregated.
- How much new apartment / multifamily construction is in the pipeline within 1–3 miles? Heavy new supply (>2% of stock underway) typically softens rents 12–24 months out; light construction supports rent growth.
Investment metrics
- 1% rule
- 1.57% ✓
- Cap rate
- 7.82%
- Cash-on-cash
- 5.46%
- DSCR
- 1.24
- GRM
- 5.3
CMA / ARV
No comps found within radius.
Projected returns pro-forma
4.58% appreciation · 3.02% rent growth · sell at horizon
- IRR
- 13.2%
- Equity multiple
- 1.82×
- Total profit
- $103,702
- Equity at exit
- $243,048
- IRR
- 14.4%
- Equity multiple
- 3.50×
- Total profit
- $314,112
- Equity at exit
- $410,337
Cash invested: $125,720 (down + closing). Projections, not guarantees.
Landlord ↔ Tenant lean methodology
- Overall (STATE)
- 87 Strongly Landlord-Friendly
- State Florida
- 87 Strongly Landlord-Friendly · R+3
- County
- — inherits STATE
- City
- — inherits STATE
ZIP-level market 33301
- Home prices YoY
- 1.6%
- Rents YoY
- 3.0%
- Active inventory
- 469
- Price-to-rent
- 5.3×
Monthly cashflow live
- Estimated rent
- $7,057 high interval (Pro) →
- Mortgage (P&I)
- −$2,355
- Tax from tax record
- −$525 /mo · $6,295/yr
- Insurance
- −$187
- Flood insurance flood zone
- −$427 /mo · $5,118/yr
- HOA
- −$1,937
- Vacancy / Maint / Mgmt
- −$1,482
- Net cashflow
- $145
Break-even live
UW: 25.0% down · 7.5% · 30yr · 1.5% tax · 5.0% vac · 8.0% maint · 8.0% mgmt
Financing live
Cash to close
- Down payment
- $112,250
- Closing costs
- $13,470
- Reserves months
- —
- Total cash needed
- —
Loan-product check · same deal, 3 products live
Conventional
25% down · 7.5% · 30yr
- Down + closing
- —
- Monthly P&I
- —
- Monthly cashflow
- —
- DSCR
- —
- Eligible?
- —
Personal DTI + credit; lowest rate.
DSCR
20% down · 8.5% · 30yr
- Down + closing
- —
- Monthly P&I
- —
- Monthly cashflow
- —
- DSCR
- —
- Eligible?
- —
No personal income docs; deal must DSCR.
Hard money
10% down · 12.0% · 12mo
- Down + closing
- —
- Monthly P&I
- —
- Monthly cashflow
- —
- DSCR
- —
- Eligible?
- —
Short-term bridge; refi at stabilization.
Rent comps 40 comps
| Address | Beds | Baths | Sqft | Rent | $/sqft | DOM | Units | Dist |
|---|---|---|---|---|---|---|---|---|
| 2500 E Las Olas Blvd Fort Lauderdale, FL | 1.0–2.0 | 1.5–2.0 | 1085 | $4,400 | $4.06 | 7d | 3 | 0.01mi |
| 2500 E Las Olas Blvd Fort Lauderdale, FL | 2.0 | 2.0 | 1300 | $4,400 | $3.38 | 24d | 1 | 0.03mi |
| 1 Las Olas Cir Fort Lauderdale, FL | 2.0 | 2.0 | 1275 | $4,050 | $3.18 | 3d | 2 | 0.33mi |
| 100 S Birch Rd Unit 1106B Fort Lauderdale, FL | 3.0 | 2.0 | 1958 | $6,450 | $3.29 | 24d | 1 | 0.36mi |
| 100 S Birch Rd Unit 2505D Fort Lauderdale, FL | 2.0 | 2.0 | 1650 | $6,900 | $4.18 | 18d | 1 | 0.36mi |
| 100 S Birch Rd Unit 1005D Fort Lauderdale, FL | 2.0 | 2.0 | 1650 | $5,450 | $3.30 | 24d | 1 | 0.36mi |
| 77 S Birch Rd Fort Lauderdale, FL | 2.0–3.0 | 2.5–3.0 | 1507 | $4,450 | $2.95 | 19d | 2 | 0.36mi |
| 77 S Birch Rd Unit 5A Fort Lauderdale, FL | 3.0 | 3.0 | 1580 | $4,450 | $2.82 | 24d | 1 | 0.37mi |
| 101 S Fort Lauderdale Beach Blvd Fort Lauderdale, FL | 2.0–3.0 | 2.0–4.0 | 2427 | $12,500 | $5.15 | 17d | 3 | 0.42mi |
| 101 S Fort Lauderdale Beach Blvd Fort Lauderdale, FL | 2.0–3.0 | 2.0–4.0 | 2427 | $12,500 | $5.15 | 24d | 5 | 0.42mi |
| 101 S Fort Lauderdale Beach Blvd Fort Lauderdale, FL | 2.0–3.0 | 2.0–4.0 | 2427 | $12,500 | $5.15 | 13d | 4 | 0.42mi |
| 101 S Fort Lauderdale Beach Blvd Fort Lauderdale, FL | 2.0–3.0 | 2.0–4.0 | 2427 | $12,500 | $5.15 | 7d | 5 | 0.42mi |
| 101 S Fort Lauderdale Beach Blvd Fort Lauderdale, FL | 2.0–3.0 | 2.0–4.0 | 2427 | $12,500 | $5.15 | 19d | 4 | 0.42mi |
| 112 N Birch Rd #202 Fort Lauderdale, FL | 2.0 | 2.0 | 1147 | $3,000 | $2.62 | 24d | 1 | 0.50mi |
| 545 S Fort Lauderdale Beach Blvd Unit 1703 1704 Fort Lauderdale, FL | 4.0 | 3.0 | 2150 | $12,000 | $5.58 | 12d | 1 | 0.54mi |
| 151 N Seabreeze Blvd Unit 1003-E Fort Lauderdale, FL | 2.0 | 3.0 | 1682 | $11,500 | $6.84 | 5d | 1 | 0.54mi |
| 151 N Seabreeze Blvd Unit 1003-E Fort Lauderdale, FL | 2.0 | 3.0 | 1682 | $11,500 | $6.84 | 24d | 1 | 0.54mi |
| 151 N Seabreeze Blvd Unit 703 Fort Lauderdale, FL | 3.0 | 3.0 | 1682 | $9,500 | $5.65 | 12d | 1 | 0.54mi |
| 153 N Seabreeze Blvd #703 Fort Lauderdale, FL | 2.0 | 2.5 | 1416 | $9,990 | $7.06 | 10d | 1 | 0.59mi |
| 2908 Bayshore Dr Unit 1541799P Fort Lauderdale, FL | 2.0 | 2.0 | 1862 | $5,415 | $2.91 | 15d | 1 | 0.63mi |
| 209 N Beach Blvd Unit 5B Fort Lauderdale, FL | 2.0 | 2.0 | 1450 | $7,000 | $4.83 | 20d | 1 | 0.63mi |
| 421 NE 22nd Ave Fort Lauderdale, FL | 4.0 | 2.0 | 2202 | $5,250 | $2.38 | 24d | 1 | 0.65mi |
| 45 Hendricks Isle #403 Fort Lauderdale, FL | 3.0 | 3.0 | 2100 | $12,500 | $5.95 | 4d | 1 | 0.65mi |
| 336 N Birch Rd Unit PH Fort Lauderdale, FL | 2.0 | 2.0 | 1411 | $4,300 | $3.05 | 22d | 1 | 0.65mi |
| 401 N Birch Rd Fort Lauderdale, FL | 1.0–3.0 | 1.0–3.5 | 1401 | $14,000 | $9.99 | 1d | 11 | 0.67mi |
| 401 N Birch Rd Fort Lauderdale, FL | 1.0–3.0 | 1.0–3.5 | 1401 | $14,000 | $9.99 | 18d | 13 | 0.67mi |
| 401 N Birch Rd Fort Lauderdale, FL | 1.0–3.0 | 1.0–3.5 | 1401 | $14,000 | $9.99 | 1d | 11 | 0.67mi |
| 180 Isle of Venice Dr Fort Lauderdale, FL | 2.0 | 2.0 | 1140 | $4,025 | $3.53 | 24d | 2 | 0.71mi |
| 3101 Bayshore Dr Fort Lauderdale, FL | 1.0–2.0 | 1.0–2.0 | 1215 | $9,995 | $8.22 | 24d | 5 | 0.77mi |
| 3101 Bayshore Dr Fort Lauderdale, FL | 1.0–2.0 | 1.0–2.0 | 982 | $9,995 | $10.18 | 11d | 6 | 0.77mi |
| 3101 Bayshore Dr Fort Lauderdale, FL | 2.0 | 2.0 | 1215 | $8,972 | $7.38 | 17d | 4 | 0.77mi |
| 3101 Bayshore Dr #1409 Fort Lauderdale, FL | 2.0 | 2.0 | 1255 | $9,995 | $7.96 | 24d | 1 | 0.77mi |
| 3101 Bayshore Dr Fort Lauderdale, FL | 2.0 | 2.0 | 1215 | $8,242 | $6.78 | 7d | 5 | 0.77mi |
| 405 Hendricks Isle Fort Lauderdale, FL | 2.0 | 2.0 | 1300 | $4,000 | $3.08 | 24d | 1 | 0.80mi |
| 15 S Victoria Park Rd Fort Lauderdale, FL | 2.0 | 2.0 | 1651 | $4,200 | $2.54 | 7d | 1 | 0.83mi |
| 612 Bayshore Dr #702 Fort Lauderdale, FL | 3.0 | 2.5 | 1926 | $12,000 | $6.23 | 24d | 1 | 0.84mi |
| 1205 Seabreeze Blvd #1205 Fort Lauderdale, FL | 3.0 | 3.0 | 1789 | $10,500 | $5.87 | 2d | 1 | 0.86mi |
| 3003 Terramar St #505 Fort Lauderdale, FL | 2.0 | 2.0 | 1280 | $2,950 | $2.30 | 24d | 1 | 0.89mi |
| 3003 Terramar St #205 Fort Lauderdale, FL | 2.0 | 2.0 | 1300 | $2,800 | $2.15 | 24d | 1 | 0.89mi |
| 3003 Terramar St #401 Fort Lauderdale, FL | 2.0 | 2.0 | 1300 | $3,300 | $2.54 | 22d | 1 | 0.89mi |
HOA detail condo
- Monthly dues
- $1,937 · $23,244/yr
- Likely covers
- poolgymdoorman
- Assessments
- None detected in remarks — confirm with the listing agent.
Listing history 17 events
-
2026-06-18days on market $449,000 Active 99 DOM
-
2026-06-17days on market $449,000 Active 98 DOM
-
2026-06-16days on market $449,000 Active 97 DOM
-
2026-06-15days on market $449,000 Active 96 DOM
-
2026-06-13days on market $449,000 Active 94 DOM
-
2026-06-09days on market $449,000 Active 90 DOM
-
2026-06-07days on market $449,000 Active 88 DOM
-
2026-06-04days on market $449,000 Active 85 DOM
-
2026-06-03days on market $449,000 Active 84 DOM
-
2026-06-02days on market $449,000 Active 83 DOM
-
2026-06-01days on market $449,000 Active 82 DOM
-
2026-05-31days on market $449,000 Active 81 DOM
-
2025-04-14$449,000 Active
-
2015-01-30soldstatus $355,000
-
2001-05-24soldstatus $259,900
-
1988-08-30soldstatus $60,000
-
1971-01-01soldstatus $53,000
ⓘ Source: listings_history table (triggers on properties + properties_extension) + one-shot
backfill from property_details.listing_events for pre-trigger history.
Tax reassessment forecast FL · Resets to sale price
- Current annual tax
- $6,295 · $525/mo
- Projected year-2 tax
- $6,295 · $525/mo
- Expected delta
- $0/yr ($0/mo · 0.0%)
ⓘ Screening estimate from a state-policy table — verify with the county assessor before closing.
Climate risk First Street
- Flood 8/10 Severe FEMA zone AE · 99% chance over 30 yrs
- Wildfire 1/10 Low
- Heat 10/10 Extreme 7 d/yr ≥105°F today · 25 d/yr by 30 yrs out
- Wind 10/10 Extreme 99% chance of damaging wind over 30 yrs
- Air quality 2/10 Low 1 unhealthy d/yr today · 1 by 30 yrs out
Nearby sold comps map
Loading sold comps map…
Walkable amenities ~0.75 mi
Loading nearby amenities…
Taxation est. · year 1
- Rental income
- $84,684
- − Mortgage interest
- −$25,151
- − Property taxes
- −$6,295
- − Insurance
- −$7,364
- − Repairs & maintenance
- −$6,775
- − Management
- −$6,775
- − HOA
- −$23,244
- − Depreciation
- −$13,062
- Taxable loss
- −$3,981
- Est. tax savings @ 24.0%
- +$956
- After-tax cash flow
- $2,697/yr
For passive investors: Depreciation is non-cash, so a rental often shows a tax loss while cash-flowing — sheltering income. Rental losses are passive: they offset passive income freely, and up to $25,000/yr can offset ordinary (W-2) income if you actively participate and your MAGI is under $100k (phasing out to $0 by $150k); unused losses carry forward. On sale, claimed depreciation is recaptured at up to 25%, and gains may owe capital-gains tax (a 1031 exchange can defer both). Figures are a year-1 estimate at your 24.0% rate — not tax advice; consult a CPA.
Schools (NCES district)
- District
- Broward
- NCES district ID
- 1200180
- Math proficiency
- 42% ▼ -18.00%
- Reading proficiency
- 53% ▼ -5.00%
- Median HH income
- $52,139
- Composite
- 40.88/100
- National rank
- #3621
- State rank
- #46 of 73 in FL
Livability — Fort Lauderdale
- Score
- 82/100
- State rank
- #78
- US rank
- #1293
Category grades
Schools grade is shown separately in the Schools card above.
Census & demographics
- Census place
- Fort Lauderdale, FL
- County
- Broward County · 1,963,430 people
- City population
- 235,769
- Metro
- Miami-Fort Lauderdale-Pompano Beach, FL
- Population (ZIP)
- 19,503
- Household income
- $124,812
- Rent vs Own
- Severe rent burden
- 1662.0
Population outlook (Broward County) Hauer SSP2
- Today (2025)
- 2,207,033 people
- By 2030
- 2,360,704 · +7.0%
- By 2040
- 2,661,208 · +20.6%
- By 2050
- 2,946,698 · +33.5%
- By 2075
- 3,602,273 · +63.2%
- By 2100
- 3,970,984 · +79.9%
Race, ethnicity, and origin ACS 2023
- Neighborhood character
- Predominantly White (67%)
- Race & ethnicity
- White 67% Hispanic / Latino 17% Two or more races 14% Black 8% Asian 2%
- Hispanic origin (detail)
- Mexican 1% Puerto Rican 3% Cuban 5%
- Common ancestry
- Romanian 3% Scotch-Irish 3% Czech 2%
- Foreign-born
- 19% · Canada, Jamaica, Dominican Republic
- Languages at home
- 75% English-only · Spanish 13% Other Indo-European 3% French/Haitian/Cajun 3%
Political lean MEDSL · Broward
- 2024 margin
- D (+17.0) · D 58.0% · R 41.0%
- 2008→2024 swing
- -17.8pp toward R · 2008: 34.7pp · 2024: 17.0pp
- All cycles
- 2024: D+17.0 2020: D+29.8 2016: D+35.0 2012: D+34.9 2008: D+34.7
Not yet ingested
- Civics
- —
Market trends
- HPI YoY
- ▲ 4.58%
- Current HPI
- 300.8346
- Rent YoY
- ▲ 3.02%
- Metro
- Miami-Fort Lauderdale-Pompano Beach, FL
- State GDP YoY
- ▲ 3.28%
- F500 in state
- 36
Industry mix (Fortune 500 HQ in FL)
| Industry | F500 HQs | Revenue |
|---|---|---|
| Industrial Technology | 2 | $29B |
|
||
| Insurance | 2 | $17B |
|
||
| Retail | 1 | $60B |
|
||
| Technology Distribution | 1 | $58B |
|
||
| Homebuilding | 1 | $35B |
|
||
| Technology Manufacturing | 1 | $35B |
|
||
Price history
+747.2% since first listed5 events — show timeline
- 2025-04-14 Listed $449,000 Beaches MLS
- 2015-01-30 Sold (Public Records) $355,000 Public Records
- 2001-05-24 Sold (Public Records) $259,900 Public Records
- 1988-08-30 Sold (Public Records) $60,000 Public Records
- 1971-01-01 Sold (Public Records) $53,000 Public Records
Property tax history
+6.5%/yrLatest (2025): $6,295 · +3.9% YoY. Source: county tax records.
Cash-flow waterfall
monthlySold comps — $/sqft
last 12 mo · ≤1 miLoading sold comps…