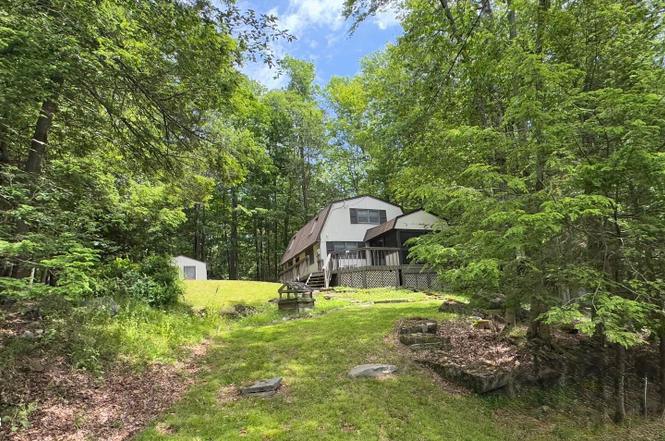
28 Bruin Rd · Salem, PA
Flood risk 1/10 · Minimal
- FEMA flood zone
- X (unshaded)
- Chance of flooding over 30 yrs
- 0.0%
- Est. flood insurance / yr
- $507 – $1,088
Fire risk 1/10 · Minimal
- Est. fire insurance / yr
- $511 – $949
Heat risk 2/10 · Minimal
- Hot days now (above 91°F)
- 7 days/yr
- Hot days in 30 yrs
- 15 days/yr
Wind risk 3/10 · Minor
- Chance of severe wind over 30 yrs
- 6.0%
Air-quality risk 2/10 · Minimal
- Unhealthy air days now
- 1 days/yr
- Unhealthy air days in 30 yrs
- 2 days/yr
Risk factors via First Street. Map © Google.
Why this score? — see what drove the C- grade
The composite is a weighted blend of 9 inputs, each scored 0–100. Each bar is that input's sub-score; the figure is the points it added to the 100-point composite (weight × sub-score).
- ARV discount +12.7/15.0
- Cash flow +10.2/30.0
- Appreciation +10.0/10.0
- Schools +4.4/10.0
- DSCR +2.9/10.0
- 1% rule +2.7/10.0
- Rent growth +2.5/5.0
- Livability +2.5/5.0
- Condition / age +2.5/5.0
$299,900
🖨 Deal sheet (PDF) 📄 Offer letter ✓ Due diligence
Listing remarks
THREE WISHES GRANTED: QUALITY COMFORT -- Comes FURNISHED!Lovingly maintained by the original owner, this meticulously crafted and exceptionally insulated home offers warmth, character, low maintenance and year-round enjoyment. Step inside to discover beautiful Philadelphia pine wide-plank flooring throughout the main level, complemented by rich Aspen wood half wall paneling that creates a warm mountain retreat atmosphere. The open-concept living and dining area features a brick hearth with a free standing wood stove, built-in storage throughout the home. Kitchen has abundant pine cabinetry, ceramic tile flooring, and is already plumbed for a dishwasher. One of the home's most enchanting fe
Key facts
- Brick hearth
- 0.37 acre lot
- Community pool
Tags
Property features AI
Finance
- Financial info: Annual association fee and a one-time fee apply
- HOA & community: Homeowners association with annual dues; Association amenities include clubhouse, pool, beach access/rights, tennis courts, basketball court, playground, picnic area, park, lake access, fishing, and powered boats allowed
Exterior
- Parking: Driveway parking (unpaved); On-site off-street parking; See remarks for additional parking details
- Security: Community security (association amenity)
- Utilities: Public water; Septic tank; 200+ amp electric service; Electricity available and water connected
- Home design: Single-family house; Two levels; Residential use; Has a view (Lake Wallenpaupack)
- Construction: Vinyl siding; Asphalt roof; Crawl space with sump pump
- Exterior features: Storage; Shed(s); Workshop; Covered, wrap-around screened deck / porch
Interior
- Kitchen: Electric range; Range; Microwave; Refrigerator
- Bedrooms: Total rooms: 6
- Flooring: Wood flooring; Parquet flooring; Ceramic tile
- Bathrooms: 2 full bathrooms
- Heating & cooling: Baseboard heating; Zoned heating; Wood stove / wood heating; Electric heating; Ceiling fans; Window air conditioning units
- Interior features: Entrance foyer; Beamed ceilings; Pantry; Built-in bookcases; Natural woodwork; Storage
- Laundry & utility: Washer and dryer (laundry located in kitchen); Dehumidifier
Neighborhood map
What this means for you Summary
Snapshot
- This is a 3-bed/2.5-bath single-family listed at $300k.
Deal economics
- At list price, monthly cash flow is $-171 ($-2k/yr) — negative.
- To cash-flow at today's rent, offer at most $270k (10.0% below list).
- To meet the 1% rule (rent ≥ 1% of price), the offer needs to be $230k (23.3% below list).
- Recommended offer: $230k (23.3% below list) — sets the bar for 1% rule.
Location & tenants
- Location reads: area grade C — affects rentability + tenant quality, not the cash-flow math above.
- Western Wayne SD (rural): math 39% / reading 63% proficiency, ranked #165 of 539 in PA (top 31%) — acceptable for families but not a draw, mixed tenant base, ~2y average lease.
- Zoned schools: Evergreen El Sch (math 42% / reading 68%, grade C, #498 of 1,518 statewide, top 33%, 506 students, 64% FRL); Western Wayne Ms (math 21% / reading 61%, grade F, #243 of 512 statewide, top 48%, 411 students, 57% FRL); Western Wayne Hs (math 77% / reading 24%, grade D+, #125 of 437 statewide, top 30%, 545 students, 49% FRL) — zoned schools average 56% FRL vs 41% district-wide (16 pts higher); higher-poverty schools than district average — tighter screening recommended.
- Market conditions: 341 active listings in the ZIP; 1 comparable units currently listed for rent nearby; 177 units permitted in Wayne County in 2024 (0 in 5+ unit buildings).
Forward outlook
- In year one you build about $32k of equity ($2k loan paydown + $30k appreciation (10.0% local appreciation)).
- Wayne County population projected at -17% by 2050 — secular population decline; favor cash flow + early exit over multi-decade hold.
- By year 2, paydown + projected appreciation supports a ~$52k cash-out refi (75% LTV) — recoverable capital for the next deal without selling this one.
Negotiation context
- Only 1 days on market — expect competitive offers; lowballing is unlikely to land.
- 2 sale attempts with the ask held roughly flat each time — persistent listings suggest the price (not the market) is what's stuck; bring a comps-based counter.
Questions for the listing agent
- What do current leases actually rent for vs. the listed asking? Can we see a recent rent roll and the last 12 months of T-12 income?
- What does the HOA fee cover, when was the last increase, and are there any pending special assessments or reserve-fund shortfalls?
- Is there a deadline driving the sale (1031 exchange, divorce, estate, relocation)? That informs how much negotiation room exists.
- What's the average days-on-market for RENTAL listings here right now (not sales)? A rising rental-DOM trend means longer vacancies and softer asking-rent achievability than the comps imply.
- What's the recent tenant-quality profile in this submarket — average credit score on applications, eviction rate, late-payment / NSF rate, and stable-employment percentage? A property-management company in the area should have these aggregated.
- How much new for-sale + rental construction is in the pipeline within 1–3 miles? Heavy new supply typically softens prices + rents 12–24 months out; constrained supply supports both.
Investment metrics
- 1% rule
- 0.77% ✗
- Cap rate
- 5.61%
- Cash-on-cash
- -2.44%
- DSCR
- 0.89
- GRM
- 10.9
CMA / ARV
- ARV (on-the-fly)
- $339,340
- Comps found
- 8
Show comp detail 8 sales within ~0.75 mi
| Address | Dist | Beds/Ba | Sqft | Sold | Price | $/sf | Match |
|---|---|---|---|---|---|---|---|
| 40 Honey Bear Rd | 0.18mi | 3/2.0 | 1,296 (-10%) | 11mo | $269,900 | $208 | 63 |
| 29 Black Bear Rd | 0.26mi | 3/1.5 | 1,354 (-6%) | 12mo | $255,000 | $188 | 63 |
| 50 Bear Rock Rd | 0.11mi | 3/1.0 | 1,640 (+14%) | 5mo | $190,000 | $116 | 62 |
| 117 Pickerel Ln | 0.67mi | 3/2.5 | 1,362 (-6%) | 2mo | $330,000 | $242 | 58 |
| 141 River Rd | 0.27mi | 3/2.0 | 1,355 (-6%) | 23mo | $550,000 | $406 | 56 |
| 96 Wild Turkey Circle Cir | 0.51mi | 3/2.0 | 1,550 (+7%) | 17mo | $364,000 | $235 | 48 |
| 142 Fawnwood Cir | 0.61mi | 3/2.0 | 1,620 (+12%) | 9mo | $285,625 | $176 | 42 |
| 102 Hillcrest Dr | 0.68mi | 3/1.0 | 1,280 (-11%) | 22mo | $325,000 | $254 | 25 |
Match score weights: distance 35% · size 25% · config 20% · recency 20%. Top-matched comps best support the ARV.
Projected returns pro-forma
10.0% appreciation · 3.0% rent growth · sell at horizon
- IRR
- 22.5%
- Equity multiple
- 2.82×
- Total profit
- $152,451
- Equity at exit
- $270,174
- IRR
- 20.2%
- Equity multiple
- 6.45×
- Total profit
- $457,453
- Equity at exit
- $582,640
Cash invested: $83,972 (down + closing). Projections, not guarantees.
Landlord ↔ Tenant lean methodology
- Overall (STATE)
- 62 Landlord-Friendly
- State Pennsylvania
- 62 Landlord-Friendly · EVEN
- County
- — inherits STATE
- City
- — inherits STATE
ZIP-level market 18436
- Home prices YoY
- 16.9%
- Active inventory
- 341
- Price-to-rent
- 10.9×
Monthly cashflow live
- Estimated rent
- $2,300 medium interval (Pro) →
- Mortgage (P&I)
- −$1,573
- Tax from tax record
- −$198 /mo · $2,375/yr
- Insurance
- −$125
- HOA
- −$92
- Vacancy / Maint / Mgmt
- −$483
- Net cashflow
- $-171
Break-even live
Sensitivity live
| Price | -10% $-1 | -5% $-86 | +0% $-171 | +5% $-255 | +10% $-340 |
|---|---|---|---|---|---|
| Rent | -10% $-352 | -5% $-261 | +0% $-171 | +5% $-80 | +10% $11 |
| Rate | -1.0pp $-20 | -0.5pp $-94 | base $-171 | +0.5pp $-248 | +1.0pp $-327 |
UW: 25.0% down · 7.5% · 30yr · 1.5% tax · 5.0% vac · 8.0% maint · 8.0% mgmt
Financing live
Cash to close
- Down payment
- $74,975
- Closing costs
- $8,997
- Reserves months
- —
- Total cash needed
- —
Loan-product check · same deal, 3 products live
Conventional
25% down · 7.5% · 30yr
- Down + closing
- —
- Monthly P&I
- —
- Monthly cashflow
- —
- DSCR
- —
- Eligible?
- —
Personal DTI + credit; lowest rate.
DSCR
20% down · 8.5% · 30yr
- Down + closing
- —
- Monthly P&I
- —
- Monthly cashflow
- —
- DSCR
- —
- Eligible?
- —
No personal income docs; deal must DSCR.
Hard money
10% down · 12.0% · 12mo
- Down + closing
- —
- Monthly P&I
- —
- Monthly cashflow
- —
- DSCR
- —
- Eligible?
- —
Short-term bridge; refi at stabilization.
Rent comps 1 comps
| Address | Beds | Baths | Sqft | Rent | $/sqft | DOM | Units | Dist |
|---|---|---|---|---|---|---|---|---|
| 12 Dogwood Ln Lake Ariel, PA | 3.0 | 2.0 | 1832 | $2,300 | $1.26 | 15d | 1 | 0.16mi |
HOA detail
- Monthly dues
- $92 · $1,104/yr
Listing history 2 events
-
2026-06-21remarks 699-char remark
-
2026-06-21$299,900 Active 1 DOM
ⓘ Source: listings_history table (triggers on properties + properties_extension) + one-shot
backfill from property_details.listing_events for pre-trigger history.
Tax reassessment forecast PA · Partial reset (capped growth)
- Current annual tax
- $2,375 · $198/mo
- Projected year-2 tax
- $3,557 · $296/mo
- Expected delta
- +$1,182/yr (+$98/mo · 49.8%)
ⓘ Screening estimate from a state-policy table — verify with the county assessor before closing.
Climate risk First Street
- Flood 1/10 Low FEMA zone X (unshaded) · 0% chance over 30 yrs
- Wildfire 1/10 Low
- Heat 2/10 Low 7 d/yr ≥91°F today · 15 d/yr by 30 yrs out
- Wind 3/10 Moderate 6% chance of damaging wind over 30 yrs
- Air quality 2/10 Low 1 unhealthy d/yr today · 2 by 30 yrs out
Nearby sold comps map
Loading sold comps map…
Walkable amenities ~0.75 mi
Loading nearby amenities…
Taxation est. · year 1
- Rental income
- $27,600
- − Mortgage interest
- −$16,799
- − Property taxes
- −$2,375
- − Insurance
- −$1,500
- − Repairs & maintenance
- −$2,208
- − Management
- −$2,208
- − HOA
- −$1,104
- − Depreciation
- −$8,724
- Taxable loss
- −$7,318
- Est. tax savings @ 24.0%
- +$1,756
- After-tax cash flow
- $-291/yr
For passive investors: Depreciation is non-cash, so a rental often shows a tax loss while cash-flowing — sheltering income. Rental losses are passive: they offset passive income freely, and up to $25,000/yr can offset ordinary (W-2) income if you actively participate and your MAGI is under $100k (phasing out to $0 by $150k); unused losses carry forward. On sale, claimed depreciation is recaptured at up to 25%, and gains may owe capital-gains tax (a 1031 exchange can defer both). Figures are a year-1 estimate at your 24.0% rate — not tax advice; consult a CPA.
Schools (NCES district)
- District
- Western Wayne SD
- NCES district ID
- 4226070
- Math proficiency
- 39% ▼ -12.00%
- Reading proficiency
- 63% ▼ -6.00%
- Median HH income
- $51,358
- Composite
- 43.65/100
- National rank
- #2964
- State rank
- #165 of 539 in PA
Livability — Salem
No livability data for this city. (Only ~50 U.S. cities are tracked.)
Census & demographics
- Census place
- Indian Rocks, PA
- Population (ZIP)
- 13,225
Population outlook (Wayne County) Hauer SSP2
- Today (2025)
- 47,924 people
- By 2030
- 46,191 · -3.6%
- By 2040
- 42,815 · -10.7%
- By 2050
- 39,873 · -16.8%
- By 2075
- 34,556 · -27.9%
- By 2100
- 28,358 · -40.8%
Race, ethnicity, and origin ACS 2023
- Neighborhood character
- Predominantly White (95%)
- Race & ethnicity
- White 95% Two or more races 3% Hispanic / Latino 2%
- Common ancestry
- Romanian 9% Scotch-Irish 2% Iranian 2%
- Foreign-born
- 4%
- Languages at home
- 95% English-only · French/Haitian/Cajun 2% Russian/Polish/Slavic 1% Spanish 1%
Political lean MEDSL · Wayne
- 2024 margin
- Solid R (+37.1) · D 31.1% · R 68.2%
- 2008→2024 swing
- -24.8pp toward R · 2008: -12.3pp · 2024: -37.1pp
- All cycles
- 2024: R+37.1 2020: R+33.6 2016: R+39.7 2012: R+20.9 2008: R+12.3
Not yet ingested
- Civics
- —
Market trends
- HPI YoY
- ▲ 47.95%
- Current HPI
- 331.9645
- Rent YoY
- —
- Metro
- —
- State GDP YoY
- ▲ 1.68%
- F500 in state
- 34
Industry mix (Fortune 500 HQ in PA)
| Industry | F500 HQs | Revenue |
|---|---|---|
| Healthcare | 2 | $309B |
|
||
| Insurance | 2 | $27B |
|
||
| Telecommunications / Media | 1 | $124B |
|
||
| Industrial Distribution | 1 | $22B |
|
||
| Financial Services | 1 | $20B |
|
||
| Chemicals / Materials | 1 | $18B |
|
||
Price history
-12.4% since first listed2 events — show timeline
- 2026-06-20 Listed $299,900 PWMLS
- 2025-07-23 Listed $342,500 PWMLS
Property tax history
+4.0%/yrLatest (2026): $2,375 · +3.1% YoY. Source: county tax records.
Cash-flow waterfall
monthlySold comps — $/sqft
last 12 mo · ≤1 miLoading sold comps…