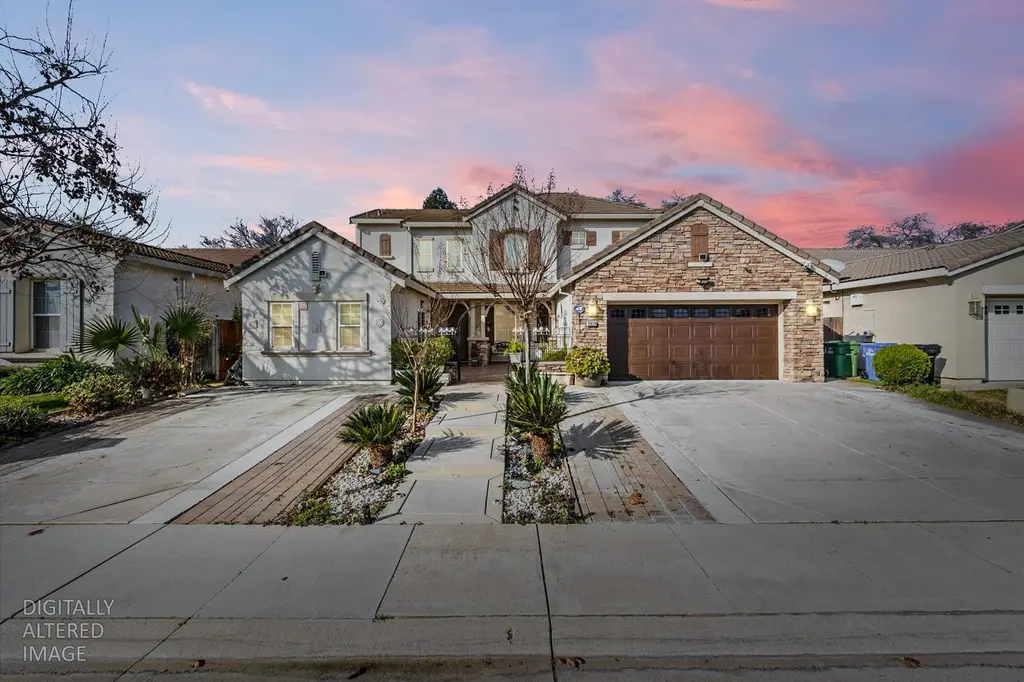
9820 Spring View Way · Elk Grove, CA
Flood risk 1/10 · Minimal
- FEMA flood zone
- X (unshaded)
- Chance of flooding over 30 yrs
- 0.0%
- Est. flood insurance / yr
- $507 – $1,088
Fire risk 3/10 · Minor
- Est. fire insurance / yr
- $659 – $1,223
Heat risk 7/10 · Major
- Hot days now (above 102°F)
- 7 days/yr
- Hot days in 30 yrs
- 15 days/yr
Wind risk 1/10 · Minimal
- Chance of severe wind over 30 yrs
- —
Air-quality risk 10/10 · Severe
- Unhealthy air days now
- 25 days/yr
- Unhealthy air days in 30 yrs
- 27 days/yr
Risk factors via First Street. Map © Google.
Why this score? — see what drove the D- grade
The composite is a weighted blend of 9 inputs, each scored 0–100. Each bar is that input's sub-score; the figure is the points it added to the 100-point composite (weight × sub-score).
- ARV discount +11.2/15.0
- Appreciation +10.0/10.0
- Cash flow +4.8/30.0
- Schools +4.1/10.0
- Rent growth +3.6/5.0
- Livability +3.6/5.0
- Condition / age +2.5/5.0
- 1% rule +0.0/10.0
- DSCR +0.0/10.0
$699,900
🖨 Deal sheet (PDF) 📄 Offer letter ✓ Due diligence
Listing remarks
Welcome to 9820 Spring View Way, a spacious and well cared for home tucked into the Franklin Meadow neighborhood. This 5 bedroom, 4 bathroom home offers a flexible and functional layout with two primary suites, including one downstairs which can be perfect for multigenerational living, guests, or a private home office setup. You'll also find an additional bedroom and full bath on the main level, with three more bedrooms and two bathrooms upstairs, giving everyone their own space. As you step inside, you notice that the home has separate living, family, and dining areas that flow easily into the heart of the house which is the kitchen. Granite countertops, a full backsplash, ample cabinetry,
Key facts
- Full backsplash
- Large island
- Cozy fireplace
Tags
Neighborhood map
What this means for you Summary
Snapshot
- This is a 5-bed/4.0-bath single-family listed at $700k.
Deal economics
- At list price, monthly cash flow is $-2k ($-21k/yr) — negative.
- To cash-flow at today's rent, offer at most $395k (43.5% below list).
- To meet the 1% rule (rent ≥ 1% of price), the offer needs to be $350k (50.0% below list).
- Recommended offer: $350k (50.0% below list) — sets the bar for 1% rule.
Location & tenants
- Location reads 71/100 on livability (#212 in CA) — a middle-class / working-renter tenant base. Strengths: employment A+, housing A+, crime B+; Watch: commute F, cost of living F.
- Elk Grove Unified (suburban): math 40% / reading 51% proficiency, ranked #165 of 517 in CA (top 32%) — families likely to look elsewhere, expect single-tenant / working-renter base with shorter leases.
- Market conditions: Rents rising fast (+4.5%/yr); 295 active listings in the ZIP; 13 comparable units currently listed for rent nearby; rentals lingering (median 44d on market — plan ~5-8 weeks vacancy on turnover, expect pricing pressure); 54% of comp listings sitting > 30 days — soft ceiling on asking rent; high-income renter base; 6,825 units permitted in Sacramento County in 2024 (1,752 in 5+ unit buildings).
- This rent runs 30% of the median local income ($138k/yr) — at the standard rent-burdened threshold; future hikes will face affordability resistance.
Forward outlook
- In year one you build about $75k of equity ($5k loan paydown + $70k appreciation (10.0% local appreciation)).
- Sacramento County population projected at +17% by 2050 — long-run rental-demand tailwind backs the buy-and-hold thesis.
- By year 2, paydown + projected appreciation supports a ~$120k cash-out refi (75% LTV) — recoverable capital for the next deal without selling this one.
Negotiation context
- It's been on market 40 days — a 3% lower offer ($679k) is reasonable based on typical stale-listing flexibility.
Risks & watch-outs
- Climate carrying-cost: extreme-heat days projected 7→15/yr by 2055 (HVAC capex compounding) — expect insurance premiums to compound above CPI over the hold.
Questions for the listing agent
- What do current leases actually rent for vs. the listed asking? Can we see a recent rent roll and the last 12 months of T-12 income?
- It's been on market 40 days. Have you received any prior offers? Is the seller open to a 50% concession, seller financing, or rate buy-down credit?
- Is there a deadline driving the sale (1031 exchange, divorce, estate, relocation)? That informs how much negotiation room exists.
- Schools are B-rated — typically a magnet for longer-tenancy family renters. What's the average tenant stay here, and is there a school-zone premium baked into asking?
- The area grade is low — what's the realistic commute time and amenity access for the typical tenant pool here? Any planned neighborhood developments (good or bad) we should know about?
- What's the average days-on-market for RENTAL listings here right now (not sales)? A rising rental-DOM trend means longer vacancies and softer asking-rent achievability than the comps imply.
- What's the recent tenant-quality profile in this submarket — average credit score on applications, eviction rate, late-payment / NSF rate, and stable-employment percentage? A property-management company in the area should have these aggregated.
- How much new for-sale + rental construction is in the pipeline within 1–3 miles? Heavy new supply typically softens prices + rents 12–24 months out; constrained supply supports both.
Investment metrics
- 1% rule
- 0.50% ✗
- Cap rate
- 3.34%
- Cash-on-cash
- -10.56%
- DSCR
- 0.53
- GRM
- 16.7
CMA / ARV
- ARV (median comp)
- $762,016
- List price
- $699,900
- Delta
- -8.15%
- Verdict
- FAIR
- Comps
- 20 within 1.0 mi
Show comp detail 12 sales within ~0.75 mi
| Address | Dist | Beds/Ba | Sqft | Sold | Price | $/sf | Match |
|---|---|---|---|---|---|---|---|
| 9820 Spring View Way | 0.00mi | 5/4.0 | 2,795 (0%) | 0mo | $705,000 | $252 | 100 |
| 8919 Haflinger Way | 0.18mi | 5/3.0 | 2,725 (-2%) | 6mo | $710,000 | $261 | 78 |
| 5105 Moon Lily Way | 0.39mi | 4/3.0 (-1) | 2,650 (-5%) | 0mo | $730,000 | $275 | 64 |
| 5216 Burberry Ct | 0.14mi | 4/3.0 (-1) | 3,140 (+12%) | 4mo | $781,000 | $249 | 60 |
| 10128 Annie St | 0.59mi | 4/3.0 (-1) | 2,724 (-2%) | 5mo | $718,000 | $264 | 55 |
| 5316 Lotus Pond Way | 0.74mi | 4/3.0 (-1) | 2,816 (+1%) | 1mo | $735,000 | $261 | 55 |
| 4716 Noriker Dr | 0.26mi | 4/2.5 (-1) | 2,436 (-13%) | 2mo | $675,000 | $277 | 53 |
| 5212 Namath Cir | 0.66mi | 4/3.0 (-1) | 2,724 (-2%) | 4mo | $736,888 | $271 | 53 |
| 5578 Lilyview Way | 0.49mi | 4/3.5 (-1) | 2,578 (-8%) | 5mo | $825,000 | $320 | 53 |
| 9681 Pilliteri Ct | 0.49mi | 4/3.0 (-1) | 2,582 (-8%) | 3mo | $751,000 | $291 | 53 |
| 5817 Spring Flower Dr | 0.72mi | 4/3.0 (-1) | 2,553 (-9%) | 2mo | $668,000 | $262 | 41 |
| 5330 Coconut Tree Ct | 0.55mi | 4/2.5 (-1) | 2,473 (-12%) | 8mo | $652,000 | $264 | 38 |
Match score weights: distance 35% · size 25% · config 20% · recency 20%. Top-matched comps best support the ARV.
Projected returns pro-forma
10.0% appreciation · 4.54% rent growth · sell at horizon
- IRR
- 17.2%
- Equity multiple
- 2.41×
- Total profit
- $276,702
- Equity at exit
- $630,525
- IRR
- 16.5%
- Equity multiple
- 5.66×
- Total profit
- $912,790
- Equity at exit
- $1,359,752
Cash invested: $195,972 (down + closing). Projections, not guarantees.
Landlord ↔ Tenant lean methodology
- Overall (STATE)
- 18 Strongly Tenant-Friendly
- State California
- 18 Strongly Tenant-Friendly · D+13
- County
- — inherits STATE
- City
- — inherits STATE
ZIP-level market 95757
- Home prices YoY
- 13.5%
- Rents YoY
- 4.5%
- Active inventory
- 295
- Price-to-rent
- 16.7×
Monthly cashflow live
- Estimated rent
- $3,501 high interval (Pro) →
- Mortgage (P&I)
- −$3,670
- Tax from tax record
- −$528 /mo · $6,337/yr
- Insurance
- −$292
- HOA
- −$0
- Vacancy / Maint / Mgmt
- −$735
- Net cashflow
- $-1,724
Break-even live
Sensitivity live
| Price | -10% $-1,328 | -5% $-1,526 | +0% $-1,724 | +5% $-1,923 | +10% $-2,121 |
|---|---|---|---|---|---|
| Rent | -10% $-2,001 | -5% $-1,863 | +0% $-1,724 | +5% $-1,586 | +10% $-1,448 |
| Rate | -1.0pp $-1,372 | -0.5pp $-1,546 | base $-1,724 | +0.5pp $-1,906 | +1.0pp $-2,090 |
UW: 25.0% down · 7.5% · 30yr · 1.5% tax · 5.0% vac · 8.0% maint · 8.0% mgmt
Financing live
Cash to close
- Down payment
- $174,975
- Closing costs
- $20,997
- Reserves months
- —
- Total cash needed
- —
Loan-product check · same deal, 3 products live
Conventional
25% down · 7.5% · 30yr
- Down + closing
- —
- Monthly P&I
- —
- Monthly cashflow
- —
- DSCR
- —
- Eligible?
- —
Personal DTI + credit; lowest rate.
DSCR
20% down · 8.5% · 30yr
- Down + closing
- —
- Monthly P&I
- —
- Monthly cashflow
- —
- DSCR
- —
- Eligible?
- —
No personal income docs; deal must DSCR.
Hard money
10% down · 12.0% · 12mo
- Down + closing
- —
- Monthly P&I
- —
- Monthly cashflow
- —
- DSCR
- —
- Eligible?
- —
Short-term bridge; refi at stabilization.
Rent comps 13 comps
| Address | Beds | Baths | Sqft | Rent | $/sqft | DOM | Units | Dist |
|---|---|---|---|---|---|---|---|---|
| 9835 Peters Ranch Way Elk Grove, CA | 4.0 | 2.5 | 2900 | $3,150 | $1.09 | 24d | 1 | 0.16mi |
| 5708 Foxview Way Elk Grove, CA | 4.0 | 2.5 | 2123 | $2,845 | $1.34 | 44d | 1 | 0.43mi |
| 4812 Coppola Cir Elk Grove, CA | 5.0 | 3.0 | 2875 | $1,200 | $0.42 | 44d | 1 | 0.55mi |
| 5819 Witt Ct Elk Grove, CA | 4.0 | 2.5 | 2090 | $2,900 | $1.39 | 45d | 1 | 0.57mi |
| 9732 Marianna Way Elk Grove, CA | 4.0 | 2.5 | 2090 | $3,300 | $1.58 | 44d | 1 | 0.64mi |
| 5418 Halas Ct Elk Grove, CA | 4.0 | 3.0 | 2650 | $3,500 | $1.32 | 18d | 1 | 0.74mi |
| 9637 Misty Blue Ct Elk Grove, CA | 4.0 | 3.0 | 2605 | $2,925 | $1.12 | 44d | 1 | 0.93mi |
| 5501 Claudied Way Elk Grove, CA | 4.0 | 2.0 | 2078 | $3,000 | $1.44 | 8d | 1 | 1.04mi |
| 9772 Ellsmere Way Elk Grove, CA | 5.0 | 4.0 | 3164 | $3,700 | $1.17 | 8d | 1 | 1.08mi |
| 9772 Ellsmere Way Elk Grove, CA | 5.0 | 3.5 | 3164 | $3,700 | $1.17 | 44d | 1 | 1.08mi |
| 9801 Caygoude Ct Elk Grove, CA | 4.0 | 2.0 | 2082 | $3,100 | $1.49 | 24d | 1 | 1.26mi |
| 10410 Danichris Way Elk Grove, CA | 4.0 | 3.0 | 2578 | $3,100 | $1.20 | 8d | 1 | 1.27mi |
| 9844 Pipit Way Elk Grove, CA | 4.0 | 3.0 | 2725 | $3,200 | $1.17 | 44d | 1 | 1.41mi |
Listing history 1 events
-
2001-11-15soldstatus $2,400,000
ⓘ Source: listings_history table (triggers on properties + properties_extension) + one-shot
backfill from property_details.listing_events for pre-trigger history.
Tax reassessment forecast CA · Resets to sale price
- Current annual tax
- $6,337 · $528/mo
- Projected year-2 tax
- $6,337 · $528/mo
- Expected delta
- $0/yr ($0/mo · 0.0%)
ⓘ Screening estimate from a state-policy table — verify with the county assessor before closing.
Climate risk First Street
- Flood 1/10 Low FEMA zone X (unshaded) · 0% chance over 30 yrs
- Wildfire 3/10 Moderate
- Heat 7/10 Severe 7 d/yr ≥102°F today · 15 d/yr by 30 yrs out
- Wind 1/10 Low
- Air quality 10/10 Extreme 25 unhealthy d/yr today · 27 by 30 yrs out
Nearby sold comps map
Loading sold comps map…
Walkable amenities ~0.75 mi
Loading nearby amenities…
Taxation est. · year 1
- Rental income
- $42,010
- − Mortgage interest
- −$39,205
- − Property taxes
- −$6,337
- − Insurance
- −$3,500
- − Repairs & maintenance
- −$3,361
- − Management
- −$3,361
- − Depreciation
- −$20,361
- Taxable loss
- −$34,114
- Est. tax savings @ 24.0%
- +$8,187
- After-tax cash flow
- $-12,506/yr
For passive investors: Depreciation is non-cash, so a rental often shows a tax loss while cash-flowing — sheltering income. Rental losses are passive: they offset passive income freely, and up to $25,000/yr can offset ordinary (W-2) income if you actively participate and your MAGI is under $100k (phasing out to $0 by $150k); unused losses carry forward. On sale, claimed depreciation is recaptured at up to 25%, and gains may owe capital-gains tax (a 1031 exchange can defer both). Figures are a year-1 estimate at your 24.0% rate — not tax advice; consult a CPA.
Schools (NCES district)
- District
- Elk Grove Unified
- NCES district ID
- 0612330
- Math proficiency
- 40% ▼ -5.00%
- Reading proficiency
- 51% ▼ -5.00%
- Median HH income
- $67,860
- Composite
- 40.72/100
- National rank
- #3658
- State rank
- #165 of 517 in CA
Livability — Elk Grove
- Score
- 71/100
- State rank
- #212
- US rank
- #6681
Category grades
Schools grade is shown separately in the Schools card above.
Census & demographics
- Census place
- Elk Grove, CA
- County
- Sacramento County · 1,539,646 people
- City population
- 190,119
- Metro
- Sacramento-Roseville-Folsom, CA
- Population (ZIP)
- 56,764
- Household income
- $138,198
- Rent vs Own
- Severe rent burden
- 1121.0
Population outlook (Sacramento County) Hauer SSP2
- Today (2025)
- 1,660,763 people
- By 2030
- 1,732,990 · +4.3%
- By 2040
- 1,855,755 · +11.7%
- By 2050
- 1,941,335 · +16.9%
- By 2075
- 2,046,162 · +23.2%
- By 2100
- 1,961,444 · +18.1%
Race, ethnicity, and origin ACS 2023
- Neighborhood character
- Highly diverse neighborhood (Simpson 0.75)
- Race & ethnicity
- Asian 40% White 21% Hispanic / Latino 18% Two or more races 14% Black 11% Pacific Islander 1%
- Hispanic origin (detail)
- Mexican 14%
- Common ancestry
- Russian 1% Italian 1% Portuguese 1%
- Foreign-born
- 28% · China, Canada, Vietnam
- Languages at home
- 62% English-only · Spanish 8% Other Indo-European 7% Chinese 7%
Political lean MEDSL · Sacramento
- 2024 margin
- D (+19.7) · D 58.1% · R 38.4% · Other 3.5%
- 2008→2024 swing
- +0.7pp no change · 2008: 19.0pp · 2024: 19.7pp
- All cycles
- 2024: D+19.7 2020: D+25.3 2016: D+23.7 2012: D+16.3 2008: D+19.0
Not yet ingested
- Civics
- —
Market trends
- HPI YoY
- ▲ 39.15%
- Current HPI
- 328.5885
- Rent YoY
- ▲ 4.54%
- Metro
- Sacramento-Roseville-Folsom, CA
- State GDP YoY
- ▲ 3.21%
- F500 in state
- 116
Industry mix (Fortune 500 HQ in CA)
| Industry | F500 HQs | Revenue |
|---|---|---|
| Technology | 27 | $1,492B |
|
||
| Financial Services | 3 | $174B |
|
||
| Retail | 3 | $44B |
|
||
| Insurance | 3 | $26B |
|
||
| Media / Entertainment | 2 | $115B |
|
||
| Pharmaceuticals / Biotech | 2 | $62B |
|
||
Price history
1 event — show timeline
- 2001-11-15 Sold (Public Records) $2,400,000 Public Records
Property tax history
+1.5%/yrLatest (2025): $6,337 · +0.8% YoY. Source: county tax records.
Cash-flow waterfall
monthlySold comps — $/sqft
last 12 mo · ≤1 miLoading sold comps…