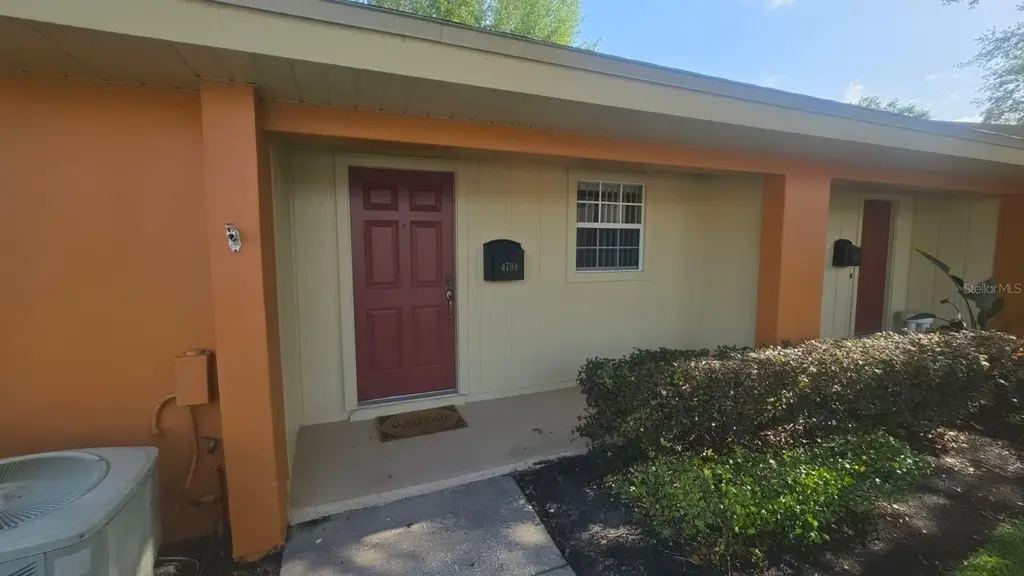
4798 Tangerine Ave #4798 · Goldenrod, FL
Flood risk No data
- FEMA flood zone
- —
- Chance of flooding over 30 yrs
- —
- Est. flood insurance / yr
- —
Fire risk No data
- Est. fire insurance / yr
- —
Heat risk No data
- Hot days now (above threshold)
- —
- Hot days in 30 yrs
- —
Wind risk No data
- Chance of severe wind over 30 yrs
- —
Air-quality risk No data
- Unhealthy air days now
- —
- Unhealthy air days in 30 yrs
- —
Risk factors via First Street. Map © Google.
Why this score? — see what drove the D grade
The composite is a weighted blend of 9 inputs, each scored 0–100. Each bar is that input's sub-score; the figure is the points it added to the 100-point composite (weight × sub-score).
- Cash flow +11.9/30.0
- ARV discount +7.5/15.0
- 1% rule +4.6/10.0
- Schools +4.1/10.0
- Livability +4.0/5.0
- DSCR +3.5/10.0
- Rent growth +3.0/5.0
- Condition / age +2.5/5.0
- Appreciation +0.0/10.0
$180,000
🖨 Deal sheet 📄 Offer letter ✓ Due diligence
Listing remarks
Welcome to this charming and well-maintained condominium located in the desirable Winter Park area, offering the perfect blend of comfort, convenience, and low-maintenance living. This inviting residence features a spacious and functional layout filled with natural light, creating a warm and welcoming atmosphere ideal for everyday living or entertaining. Enjoy an open living and dining area that flows seamlessly to a private screened porch with additional storage space, perfect for relaxing and enjoying the peaceful surroundings. The home offers generous room sizes, ample storage throughout, and a comfortable living environment within a quiet and established community. Residents enjoy acces
Key facts
- Fitness center
- $365 HOA
- Community pool
Tags
Property features AI
Finance
- Other: Condo land included; No lease restrictions reported
- Financial info: Total monthly fees $365; total annual fees $4,380
- HOA & community: Monthly condo/HOA fee $365 (includes water and trash); Association amenities include pool; Community features include pool and street lights; Pets allowed (cats and dogs)
Exterior
- Parking: Open parking
- Utilities: Public water; Public sewer; Electricity connected and available; Cable available; Phone available; High-speed/BB internet available; Underground utilities; Water and sewer available/connected
- Home design: Condominium (residential); Single-story; Entry on one level; Faces north
- Construction: Block and stucco construction; Shingle roof; Slab foundation; Built as part of Wrenwood Condominium (building #4798)
- Exterior features: Rear screened porch
Interior
- Kitchen: Dishwasher; Microwave; Range; Refrigerator; Electric water heater
- Bedrooms: 2 bedrooms
- Flooring: Laminate
- Bathrooms: 2 full bathrooms
- Heating & cooling: Central heat (electric, heat pump); Central air with humidity control
- Interior features: Thermostat; Aluminum frame windows
- Laundry & utility: Washer; Dryer (inside laundry)
Neighborhood map
What this means for you Summary
Snapshot
- This is a 2-bed/2.0-bath condo listed at $180k.
Deal economics
- At list price, monthly cash flow is $-46 ($-555/yr) — negative.
- To cash-flow at today's rent, offer at most $172k (4.5% below list).
- To meet the 1% rule (rent ≥ 1% of price), the offer needs to be $173k (3.8% below list).
- Recommended offer: $172k (4.5% below list) — sets the bar for cash-flow.
- Cap rate 6.0% vs local median 3.6% in Goldenrod — top-decile yield for the area; either an underpriced asset or a hidden risk that comps aren't pricing in. Stress-test before assuming the spread holds.
Location & tenants
- Location reads 79/100 on livability (#138 in FL, #2,056 nationally) — a middle-class / working-renter tenant base. Strengths: commute A+, housing A+, schools A-; Watch: employment D, amenities F.
- Orange (suburban): math 46% / reading 51% proficiency, ranked #43 of 73 in FL (top 59%) — families likely to look elsewhere, expect single-tenant / working-renter base with shorter leases.
- Market conditions: Rents rising (+1.9%/yr); 275 active listings in the ZIP; 40 comparable units currently listed for rent nearby; rentals leasing fast (median 4d on market — plan ~1-2 weeks tenant-placement turnaround); 8,053 units permitted in Orange County in 2024 (3,133 in 5+ unit buildings).
- This rent runs 30% of the median local income ($69k/yr) — at the standard rent-burdened threshold; future hikes will face affordability resistance.
Forward outlook
- Local home prices are declining (-3.0%/yr); year-one equity from $1k of loan paydown is wiped out by about $5k of value loss. Plan a longer hold.
- Orange County population projected at +52% by 2050 — long-run rental-demand tailwind backs the buy-and-hold thesis.
Negotiation context
- Only 14 days on market — expect competitive offers; lowballing is unlikely to land.
Risks & watch-outs
- Watch-outs: HOA is 21% of rent.
Questions for the listing agent
- What do current leases actually rent for vs. the listed asking? Can we see a recent rent roll and the last 12 months of T-12 income?
- Built in 1973 — when were the roof, HVAC, electrical panel, plumbing, and water heater last replaced?
- What does the HOA fee cover, when was the last increase, and are there any pending special assessments or reserve-fund shortfalls?
- Any open or pending special assessments — roof, HVAC, plumbing, elevator, façade? What's the per-unit balance and payoff schedule, and is the seller paying it off at close or rolling it to the buyer?
- Is there a deadline driving the sale (1031 exchange, divorce, estate, relocation)? That informs how much negotiation room exists.
- Schools are A-rated — typically a magnet for longer-tenancy family renters. What's the average tenant stay here, and is there a school-zone premium baked into asking?
- The area grade is low — what's the realistic commute time and amenity access for the typical tenant pool here? Any planned neighborhood developments (good or bad) we should know about?
- What's the average days-on-market for RENTAL listings here right now (not sales)? A rising rental-DOM trend means longer vacancies and softer asking-rent achievability than the comps imply.
- What's the recent tenant-quality profile in this submarket — average credit score on applications, eviction rate, late-payment / NSF rate, and stable-employment percentage? A property-management company in the area should have these aggregated.
- How much new apartment / multifamily construction is in the pipeline within 1–3 miles? Heavy new supply (>2% of stock underway) typically softens rents 12–24 months out; light construction supports rent growth.
Investment metrics
- 1% rule
- 0.96% ✗
- Cap rate
- 5.98%
- Cash-on-cash
- -1.10%
- DSCR
- 0.95
- GRM
- 8.7
CMA / ARV
No comps found within radius.
Projected returns pro-forma
-3.0% appreciation · 1.9% rent growth · sell at horizon
- IRR
- -19.4%
- Equity multiple
- 0.33×
- Total profit
- $-33,880
- Equity at exit
- $26,839
- IRR
- -14.8%
- Equity multiple
- 0.20×
- Total profit
- $-40,375
- Equity at exit
- $15,563
Cash invested: $50,400 (down + closing). Projections, not guarantees.
Landlord ↔ Tenant lean methodology
- Overall (STATE)
- 87 Strongly Landlord-Friendly
- State Florida
- 87 Strongly Landlord-Friendly · R+3
- County
- — inherits STATE
- City
- — inherits STATE
ZIP-level market 32792
- Rents YoY
- 1.9%
- Active inventory
- 275
- Price-to-rent
- 8.7×
Monthly cashflow live
- Estimated rent
- $1,732 high interval (Pro) →
- Mortgage (P&I)
- −$944
- Tax from tax record
- −$31 /mo · $368/yr
- Insurance
- −$75
- HOA
- −$365
- Vacancy / Maint / Mgmt
- −$364
- Net cashflow
- $-46
Break-even live
UW: 25.0% down · 7.5% · 30yr · 1.5% tax · 5.0% vac · 8.0% maint · 8.0% mgmt
Financing live
Cash to close
- Down payment
- $45,000
- Closing costs
- $5,400
- Reserves months
- —
- Total cash needed
- —
Loan-product check · same deal, 3 products live
Conventional
25% down · 7.5% · 30yr
- Down + closing
- —
- Monthly P&I
- —
- Monthly cashflow
- —
- DSCR
- —
- Eligible?
- —
Personal DTI + credit; lowest rate.
DSCR
20% down · 8.5% · 30yr
- Down + closing
- —
- Monthly P&I
- —
- Monthly cashflow
- —
- DSCR
- —
- Eligible?
- —
No personal income docs; deal must DSCR.
Hard money
10% down · 12.0% · 12mo
- Down + closing
- —
- Monthly P&I
- —
- Monthly cashflow
- —
- DSCR
- —
- Eligible?
- —
Short-term bridge; refi at stabilization.
Rent comps 40 comps
| Address | Beds | Baths | Sqft | Rent | $/sqft | DOM | Units | Dist |
|---|---|---|---|---|---|---|---|---|
| 4800 Tangerine Ave Winter Park, FL | 2.0 | 2.0 | 1058 | $1,950 | $1.84 | 17d | 1 | 0.03mi |
| 4818 Tangerine Ave #4818 Winter Park, FL | 1.0 | 1.0 | 753 | $1,350 | $1.79 | 11d | 1 | 0.05mi |
| 7001 Aloma Ave Winter Park, FL | 1.0 | 1.0 | 625 | $1,278 | $2.04 | 3d | 5 | 0.06mi |
| 4968 Tangerine Ave #4968 Winter Park, FL | 2.0 | 2.0 | 1059 | $1,700 | $1.61 | 23d | 1 | 0.15mi |
| 4704 Lucier Ct Winter Park, FL | 2.0 | 2.0–2.5 | 934 | $1,724 | $1.85 | 2d | 7 | 0.40mi |
| 5171 Orange Ave Winter Park, FL | 3.0 | 2.0 | 1317 | $2,050 | $1.56 | 23d | 1 | 0.45mi |
| 704 Carnation Dr Winter Park, FL | 3.0 | 2.0 | 1324 | $2,095 | $1.58 | 21d | 1 | 0.49mi |
| 4616 N Goldenrod Rd Winter Park, FL | 2.0 | 1.0 | 754 | $1,675 | $2.22 | 4d | 1 | 0.52mi |
| 1407 Chilean Ln Winter Park, FL | 3.0 | 2.0 | 1356 | $2,071 | $1.53 | 12d | 1 | 0.53mi |
| 7502 Sun Key Blvd Winter Park, FL | 1.0–2.0 | 1.0–2.0 | 815 | $1,703 | $2.09 | 1d | 12 | 0.54mi |
| 5212 N Indiana Ave Winter Park, FL | 3.0 | 1.5 | 950 | $2,200 | $2.32 | 10d | 1 | 0.55mi |
| 4755 N Goldenrod Rd Winter Park, FL | 3.0 | 1.0–2.0 | 843 | $1,882 | $2.23 | 2d | 22 | 0.69mi |
| 5171 Lazy Oaks Dr Winter Park, FL | 2.0 | 2.5 | 1236 | $2,200 | $1.78 | 10d | 1 | 0.72mi |
| 5 Autumn Breeze Way Winter Park, FL | 1.0–3.0 | 1.0–2.0 | 995 | $1,608 | $1.62 | 1d | 39 | 0.74mi |
| 3250 Bishop Park Dr Winter Park, FL | 1.0–2.0 | 1.0–2.0 | 880 | $2,117 | $2.41 | 1d | 17 | 0.78mi |
| 7000 University Blvd Winter Park, FL | 1.0–2.0 | 1.0–2.0 | 768 | $1,675 | $2.18 | 1d | 8 | 0.81mi |
| 7950 Shoals Dr Orlando, FL | 1.0–2.0 | 1.0–2.0 | 870 | $1,825 | $2.10 | 1d | 12 | 0.82mi |
| 3449 Allston Ln Winter Park, FL | 3.0 | 2.5 | 1482 | $2,350 | $1.59 | 21d | 1 | 0.83mi |
| 3935 Sutton Place Blvd Winter Park, FL | 1.0–2.0 | 1.0–2.0 | 858 | $1,969 | $2.29 | 1d | 24 | 0.86mi |
| 800 Semoran Park Dr Winter Park, FL | 1.0–2.0 | 1.0–2.0 | 880 | $1,667 | $1.89 | 1d | 6 | 0.93mi |
| 3045 Aloma Ave Winter Park, FL | 1.0–2.0 | 1.0–2.0 | 1010 | $2,850 | $2.82 | 2d | 10 | 0.94mi |
| 3924 Calibre Bend Ln Winter Park, FL | 1.0–2.0 | 1.0–2.0 | 1082 | $1,983 | $1.83 | 2d | 8 | 0.96mi |
| 7004 Mills Rd Winter Park, FL | 2.0 | 2.0 | 1000 | $1,595 | $1.59 | 17d | 1 | 0.97mi |
| 3040 Aloma Ave Winter Park, FL | 1.0–3.0 | 1.0–2.0 | 965 | $1,525 | $1.58 | 1d | 10 | 0.97mi |
| 3059 Autumn Ct Winter Park, FL | 3.0 | 2.0 | 1266 | $1,900 | $1.50 | 17d | 1 | 1.10mi |
| 3651 N Goldenrod Rd Unit 208 Winter Park, FL | 2.0 | 2.0 | 840 | $1,550 | $1.85 | 23d | 1 | 1.17mi |
| 3651 N Goldenrod Rd Unit 110 Winter Park, FL | 2.0 | 2.0 | 840 | $1,450 | $1.73 | 21d | 1 | 1.17mi |
| 3651 N Goldenrod Rd Winter Park, FL | 2.0 | 2.0 | 840 | $1,360 | $1.62 | 21d | 1 | 1.17mi |
| 3656 N Goldenrod Rd Unit 3624303 Winter Park, FL | 1.0 | 1.0 | 711 | $1,599 | $2.25 | 3d | 1 | 1.18mi |
| 2015 New Stonecastle Ter Winter Park, FL | 1.0–3.0 | 1.0–2.0 | 1045 | $1,630 | $1.56 | 1d | 19 | 1.19mi |
| 3232 Royal St Winter Park, FL | 3.0 | 1.5 | 970 | $1,745 | $1.80 | 1d | 1 | 1.20mi |
| 3651 N Goldenrod Rd Winter Park, FL | 2.0 | 2.0 | 840 | $1,430 | $1.70 | 13d | 1 | 1.21mi |
| 3651 N Goldenrod Rd Winter Park, FL | 2.0 | 2.0 | 840 | $1,445 | $1.72 | 3d | 2 | 1.21mi |
| 3651 N Goldenrod Rd Winter Park, FL | 2.0 | 2.0 | 840 | $1,548 | $1.84 | 4d | 1 | 1.21mi |
| 5523 Cretan Way Winter Park, FL | 3.0 | 2.0 | 1332 | $1,795 | $1.35 | 1d | 1 | 1.23mi |
| 7800 Fernbrook Way Winter Park, FL | 3.0 | 2.0 | 1381 | $2,295 | $1.66 | 10d | 1 | 1.24mi |
| 2610 Eastbrook Blvd Unit 216 Winter Park, FL | 2.0 | 1.0 | 850 | $1,300 | $1.53 | 23d | 1 | 1.25mi |
| 5560 Solidago Dr Winter Park, FL | 2.0–3.0 | 1.0–2.0 | 947 | $1,439 | $1.52 | 23d | 3 | 1.26mi |
| 2617 Eastbrook Blvd Winter Park, FL | 1.0–2.0 | 1.0 | 875 | $1,300 | $1.49 | 23d | 2 | 1.28mi |
| 7745 Brandywood Cir Winter Park, FL | 1.0–2.0 | 1.0–2.0 | 800 | $1,745 | $2.18 | 2d | 11 | 1.28mi |
HOA detail condo
- Monthly dues
- $365 · $4,380/yr
- Assessments
- None detected in remarks — confirm with the listing agent.
Listing history 12 events
-
2026-06-18days on market $180,000 Active 14 DOM
-
2026-06-17days on market $180,000 Active 13 DOM
-
2026-06-16days on market $180,000 Active 12 DOM
-
2026-06-16price $180,000 Active 11 DOM
-
2026-06-15days on market $185,000 Active 11 DOM
-
2026-06-13days on market $185,000 Active 9 DOM
-
2026-06-13days on market $185,000 Active 8 DOM
-
2026-06-09days on market $185,000 Active 5 DOM
-
2026-06-08days on market $185,000 Active 4 DOM
-
2026-06-07days on market $185,000 Active 3 DOM
-
2026-06-04remarks 699-char remark
-
2026-06-04$185,000 Active 1 DOM
ⓘ Source: listings_history table (triggers on properties + properties_extension) + one-shot
backfill from property_details.listing_events for pre-trigger history.
Tax reassessment forecast FL · Resets to sale price
- Current annual tax
- $368 · $31/mo
- Projected year-2 tax
- $1,494 · $124/mo
- Expected delta
- +$1,126/yr (+$94/mo · 306.0%)
ⓘ Screening estimate from a state-policy table — verify with the county assessor before closing.
Nearby sold comps map
Loading sold comps map…
Walkable amenities ~0.75 mi
Loading nearby amenities…
Taxation est. · year 1
- Rental income
- $20,785
- − Mortgage interest
- −$10,083
- − Property taxes
- −$368
- − Insurance
- −$900
- − Repairs & maintenance
- −$1,663
- − Management
- −$1,663
- − HOA
- −$4,380
- − Depreciation
- −$5,236
- Taxable loss
- −$3,508
- Est. tax savings @ 24.0%
- +$842
- After-tax cash flow
- $287/yr
For passive investors: Depreciation is non-cash, so a rental often shows a tax loss while cash-flowing — sheltering income. Rental losses are passive: they offset passive income freely, and up to $25,000/yr can offset ordinary (W-2) income if you actively participate and your MAGI is under $100k (phasing out to $0 by $150k); unused losses carry forward. On sale, claimed depreciation is recaptured at up to 25%, and gains may owe capital-gains tax (a 1031 exchange can defer both). Figures are a year-1 estimate at your 24.0% rate — not tax advice; consult a CPA.
Schools (NCES district)
- District
- Orange
- NCES district ID
- 1201440
- Math proficiency
- 46% ▼ -9.00%
- Reading proficiency
- 51% ▼ -2.00%
- Median HH income
- $49,350
- Composite
- 41.47/100
- National rank
- #3461
- State rank
- #43 of 73 in FL
Livability — Goldenrod
- Score
- 79/100
- State rank
- #138
- US rank
- #2056
Category grades
Schools grade is shown separately in the Schools card above.
Census & demographics
- Census place
- Goldenrod, FL
- County
- Orange County · 1,471,359 people
- City population
- 52,794
- Metro
- Orlando-Kissimmee-Sanford, FL
- Population (ZIP)
- 52,976
- Household income
- $69,200
- Rent vs Own
- Severe rent burden
- 3610.0
Population outlook (Orange County) Hauer SSP2
- Today (2025)
- 1,618,226 people
- By 2030
- 1,787,404 · +10.5%
- By 2040
- 2,125,621 · +31.4%
- By 2050
- 2,454,016 · +51.6%
- By 2075
- 3,173,711 · +96.1%
- By 2100
- 3,607,781 · +122.9%
Race, ethnicity, and origin ACS 2023
- Neighborhood character
- Diverse neighborhood (Simpson 0.65)
- Race & ethnicity
- White 51% Hispanic / Latino 27% Two or more races 15% Black 12% Asian 5%
- Hispanic origin (detail)
- Mexican 2% Puerto Rican 11% Cuban 2% Dominican 1%
- Common ancestry
- Romanian 2% Italian 2% Scotch-Irish 1%
- Foreign-born
- 16% · Canada, Jamaica, Vietnam
- Languages at home
- 74% English-only · Spanish 19% Other Indo-European 2% Russian/Polish/Slavic 1%
Political lean MEDSL · Orange
- 2024 margin
- D (+13.6) · D 56.1% · R 42.5% · Other 1.3%
- 2008→2024 swing
- -5.0pp toward R · 2008: 18.6pp · 2024: 13.6pp
- All cycles
- 2024: D+13.6 2020: D+23.1 2016: D+24.6 2012: D+18.2 2008: D+18.6
Not yet ingested
- Civics
- —
Market trends
- HPI YoY
- ▼ -281.94%
- Current HPI
- 351.1184
- Rent YoY
- ▲ 1.90%
- Metro
- Orlando-Kissimmee-Sanford, FL
- State GDP YoY
- ▲ 3.28%
- F500 in state
- 36
Industry mix (Fortune 500 HQ in FL)
| Industry | F500 HQs | Revenue |
|---|---|---|
| Industrial Technology | 2 | $29B |
|
||
| Insurance | 2 | $17B |
|
||
| Retail | 1 | $60B |
|
||
| Technology Distribution | 1 | $58B |
|
||
| Homebuilding | 1 | $35B |
|
||
| Technology Manufacturing | 1 | $35B |
|
||
Price history
1 event — show timeline
- 2026-06-04 Listed $185,000 Stellar MLS as Distributed by MLS Grid
Property tax history
+4.4%/yrLatest (2025): $368 · +6.2% YoY. Source: county tax records.
Cash-flow waterfall
monthlySold comps — $/sqft
last 12 mo · ≤1 miLoading sold comps…