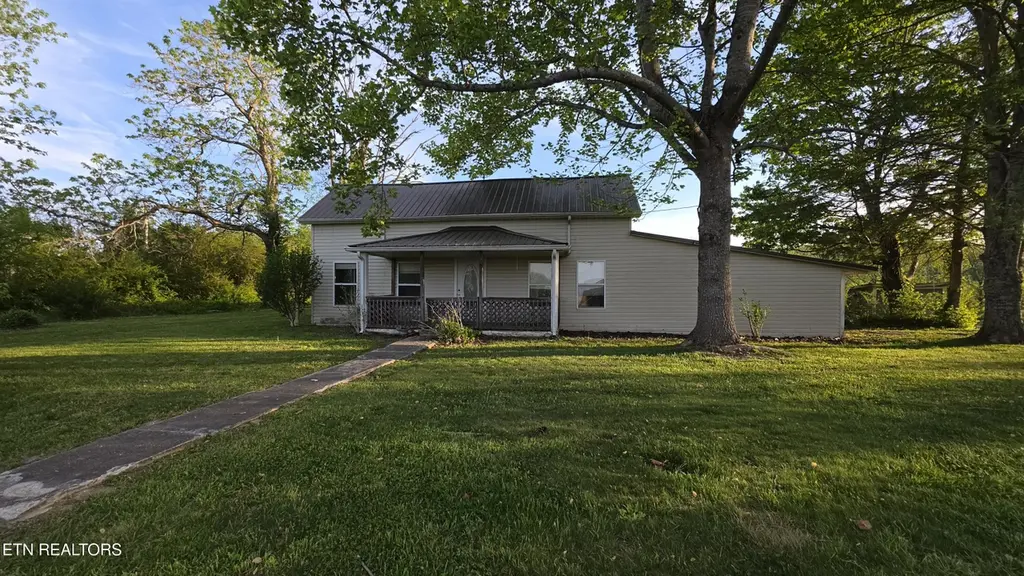
671 Williams Creek Rd · Oneida, TN
Flood risk 1/10 · Minimal
- FEMA flood zone
- X (unshaded)
- Chance of flooding over 30 yrs
- 0.0%
- Est. flood insurance / yr
- $507 – $1,088
Fire risk 6/10 · Moderate
- Est. fire insurance / yr
- $949 – $1,763
Heat risk 4/10 · Minor
- Hot days now (above 100°F)
- 7 days/yr
- Hot days in 30 yrs
- 20 days/yr
Wind risk 3/10 · Minor
- Chance of severe wind over 30 yrs
- 6.0%
Air-quality risk 2/10 · Minimal
- Unhealthy air days now
- 2 days/yr
- Unhealthy air days in 30 yrs
- 2 days/yr
Risk factors via First Street. Map © Google.
Why this score? — see what drove the C- grade
The composite is a weighted blend of 9 inputs, each scored 0–100. Each bar is that input's sub-score; the figure is the points it added to the 100-point composite (weight × sub-score).
- Cash flow +18.1/30.0
- Appreciation +10.0/10.0
- ARV discount +7.5/15.0
- DSCR +5.7/10.0
- 1% rule +3.7/10.0
- Livability +2.9/5.0
- Rent growth +2.5/5.0
- Condition / age +2.5/5.0
- Schools +1.7/10.0
$115,000
🖨 Deal sheet 📄 Offer letter ✓ Due diligence
Listing remarks
Set on approximately 4.24 acres in Oneida, this 3-bedroom, 2-bath home offers plenty of space, character, and potential. Originally built in 1900 with a later primary suite addition, the home blends older charm with functional updates including vinyl siding and many updated vinyl windows. The kitchen area stands out with its cathedral ceiling and exposed wood beams, and the kitchen itself has been completely gutted, creating a blank canvas for a buyer ready to make it their own. The third bedroom is on the upper level. The land is mostly level with a gentle roll at the back before leveling again, and additional features include a side-entry carport plus a detached storage building or worksh
Key facts
- Exposed wood beams
- Vinyl siding
- Cathedral ceiling
Tags
Property features AI
Exterior
- Parking: Two covered carport spaces on the main level
- Utilities: Septic tank
- Home design: Detached property
- Construction: Vinyl siding over frame construction; Crawl space foundation
- Exterior features: Vinyl windows; Workshop (outbuilding); Wooded and partly level lot with rolling slopes and irregular shape; Country setting view
Interior
- Bedrooms: Two additional bedrooms (listed as Bedroom 2 and Bedroom 3)
- Flooring: Laminate flooring; Vinyl flooring; Tile flooring
- Bathrooms: Two full bathrooms
- Heating & cooling: Natural gas heating; Other heating; No central cooling listed
- Interior features: Cathedral ceilings; Gas, free‑standing fireplace and additional fireplace (other)
Neighborhood map
What this means for you Summary
Snapshot
- This is a 3-bed/1.0-bath single-family listed at $115k.
Deal economics
- At list price, monthly cash flow is $101 ($1k/yr) — positive.
- The deal already cash-flows at list — no discount required.
- To meet the 1% rule (rent ≥ 1% of price), the offer needs to be $100k (13.0% below list).
- Recommended offer: $100k (13.0% below list) — sets the bar for 1% rule.
Location & tenants
- Location reads 57/100 on livability (#319 in TN) — a working-class tenant base; expect higher turnover. Strengths: cost of living A+, housing B+; Watch: schools F, amenities F, commute F.
- Scott County (rural): math 15% / reading 27% proficiency, ranked #113 of 139 in TN (top 81%) — low school quality limits family demand, transient renter base, plan for 1-2y turnover; 72% free/reduced lunch — lower-income household profile, screen leases tightly.
- Market conditions: 71 active listings in the ZIP; 3 units permitted in Scott County in 2024 (0 in 5+ unit buildings).
Forward outlook
- In year one you build about $12k of equity ($795 loan paydown + $12k appreciation (10.0% local appreciation)).
- Scott County population projected at -21% by 2050 — secular population decline; favor cash flow + early exit over multi-decade hold.
- At projected returns (10.0% appreciation + 3.0% rent growth), your $32k cash investment doubles in ~3 years — after that, you're playing with house money.
- By year 3, paydown + projected appreciation supports a ~$31k cash-out refi (75% LTV) — recoverable capital for the next deal without selling this one.
Negotiation context
- It's been on market 55 days — a 3% lower offer ($112k) is reasonable based on typical stale-listing flexibility.
- 2 sale attempts since 11y ago; this cycle's ask has dropped $15k (11%) from the opening price — seller is motivated, your offer sets the floor, not the list.
Risks & watch-outs
- Watch-outs: built in 1900 — expect roof / HVAC / electrical / plumbing capex.
- Climate carrying-cost: major wildfire risk — expect insurance premiums to compound above CPI over the hold.
Questions for the listing agent
- It's been on market 55 days. Have you received any prior offers? Is the seller open to a 13% concession, seller financing, or rate buy-down credit?
- Built in 1900 — when were the roof, HVAC, electrical panel, plumbing, and water heater last replaced?
- Is there a deadline driving the sale (1031 exchange, divorce, estate, relocation)? That informs how much negotiation room exists.
- Schools are F-rated, which usually means shorter tenancies and higher turnover. Who's the typical renter profile here, and what's been the actual vacancy rate?
- What's the average days-on-market for RENTAL listings here right now (not sales)? A rising rental-DOM trend means longer vacancies and softer asking-rent achievability than the comps imply.
- What's the recent tenant-quality profile in this submarket — average credit score on applications, eviction rate, late-payment / NSF rate, and stable-employment percentage? A property-management company in the area should have these aggregated.
- How much new for-sale + rental construction is in the pipeline within 1–3 miles? Heavy new supply typically softens prices + rents 12–24 months out; constrained supply supports both.
Investment metrics
- 1% rule
- 0.87% ✗
- Cap rate
- 7.35%
- Cash-on-cash
- 3.77%
- DSCR
- 1.17
- GRM
- 9.6
CMA / ARV
No comps found within radius.
Projected returns pro-forma
10.0% appreciation · 3.0% rent growth · sell at horizon
- IRR
- 27.0%
- Equity multiple
- 3.14×
- Total profit
- $69,017
- Equity at exit
- $103,601
- IRR
- 23.6%
- Equity multiple
- 7.15×
- Total profit
- $198,085
- Equity at exit
- $223,420
Cash invested: $32,200 (down + closing). Projections, not guarantees.
Landlord ↔ Tenant lean methodology
- Overall (STATE)
- 87 Strongly Landlord-Friendly
- State Tennessee
- 87 Strongly Landlord-Friendly · R+13
- County
- — inherits STATE
- City
- — inherits STATE
ZIP-level market 37841
- Home prices YoY
- 6.0%
- Active inventory
- 71
- Price-to-rent
- 9.6×
Monthly cashflow live
- Estimated rent
- $1,000 medium interval (Pro) →
- Mortgage (P&I)
- −$603
- Tax from tax record
- −$38 /mo · $458/yr
- Insurance
- −$48
- HOA
- −$0
- Vacancy / Maint / Mgmt
- −$210
- Net cashflow
- $101
Break-even live
UW: 25.0% down · 7.5% · 30yr · 1.5% tax · 5.0% vac · 8.0% maint · 8.0% mgmt
Financing live
Cash to close
- Down payment
- $28,750
- Closing costs
- $3,450
- Reserves months
- —
- Total cash needed
- —
Loan-product check · same deal, 3 products live
Conventional
25% down · 7.5% · 30yr
- Down + closing
- —
- Monthly P&I
- —
- Monthly cashflow
- —
- DSCR
- —
- Eligible?
- —
Personal DTI + credit; lowest rate.
DSCR
20% down · 8.5% · 30yr
- Down + closing
- —
- Monthly P&I
- —
- Monthly cashflow
- —
- DSCR
- —
- Eligible?
- —
No personal income docs; deal must DSCR.
Hard money
10% down · 12.0% · 12mo
- Down + closing
- —
- Monthly P&I
- —
- Monthly cashflow
- —
- DSCR
- —
- Eligible?
- —
Short-term bridge; refi at stabilization.
Listing history 12 events
-
2026-06-12statusdays on market $115,000 Pending 55 DOM
-
2026-06-09pricedays on market $115,000 Active 52 DOM
-
2026-06-08days on market $129,900 Active 51 DOM
-
2026-06-08days on market $129,900 Active 50 DOM
-
2026-06-07days on market $129,900 Active 49 DOM
-
2026-06-03days on market $129,900 Active 46 DOM
-
2026-06-02days on market $129,900 Active 45 DOM
-
2026-06-01days on market $129,900 Active 44 DOM
-
2026-05-31days on market $129,900 Active 43 DOM
-
2026-04-17$129,900 Active
-
2015-03-12historical
-
2015-01-28$149,900 Active
ⓘ Source: listings_history table (triggers on properties + properties_extension) + one-shot
backfill from property_details.listing_events for pre-trigger history.
Tax reassessment forecast TN · Resets to sale price
- Current annual tax
- $458 · $38/mo
- Projected year-2 tax
- $816 · $68/mo
- Expected delta
- +$359/yr (+$30/mo · 78.3%)
ⓘ Screening estimate from a state-policy table — verify with the county assessor before closing.
Climate risk First Street
- Flood 1/10 Low FEMA zone X (unshaded) · 0% chance over 30 yrs
- Wildfire 6/10 Major
- Heat 4/10 Moderate 7 d/yr ≥100°F today · 20 d/yr by 30 yrs out
- Wind 3/10 Moderate 6% chance of damaging wind over 30 yrs
- Air quality 2/10 Low 2 unhealthy d/yr today · 2 by 30 yrs out
Nearby sold comps map
Loading sold comps map…
Walkable amenities ~0.75 mi
Loading nearby amenities…
Taxation est. · year 1
- Rental income
- $12,003
- − Mortgage interest
- −$6,442
- − Property taxes
- −$458
- − Insurance
- −$575
- − Repairs & maintenance
- −$960
- − Management
- −$960
- − Depreciation
- −$3,345
- Taxable loss
- −$738
- Est. tax savings @ 24.0%
- +$177
- After-tax cash flow
- $1,390/yr
For passive investors: Depreciation is non-cash, so a rental often shows a tax loss while cash-flowing — sheltering income. Rental losses are passive: they offset passive income freely, and up to $25,000/yr can offset ordinary (W-2) income if you actively participate and your MAGI is under $100k (phasing out to $0 by $150k); unused losses carry forward. On sale, claimed depreciation is recaptured at up to 25%, and gains may owe capital-gains tax (a 1031 exchange can defer both). Figures are a year-1 estimate at your 24.0% rate — not tax advice; consult a CPA.
Schools (NCES district)
- District
- Scott County
- NCES district ID
- 4703720
- Math proficiency
- 15% ▼ -13.00%
- Reading proficiency
- 27% ▼ -4.00%
- Median HH income
- $31,942
- Composite
- 16.97/100
- National rank
- #9134
- State rank
- #113 of 139 in TN
Livability — Oneida
- Score
- 57/100
- State rank
- #319
- US rank
- #21569
Category grades
Schools grade is shown separately in the Schools card above.
Census & demographics
- City population
- 10,214
- Population (ZIP)
- 10,214
Population outlook (Scott County) Hauer SSP2
- Today (2025)
- 20,907 people
- By 2030
- 20,108 · -3.8%
- By 2040
- 18,405 · -12.0%
- By 2050
- 16,598 · -20.6%
- By 2075
- 12,607 · -39.7%
- By 2100
- 9,303 · -55.5%
Race, ethnicity, and origin ACS 2023
- Neighborhood character
- Predominantly White (97%)
- Race & ethnicity
- White 97% Two or more races 3%
- Common ancestry
- Slovak 4% Serbian 2% Romanian 1%
- Foreign-born
- 1% · Canada
Political lean MEDSL · Scott
- 2024 margin
- Solid R (+79.8) · D 9.8% · R 89.6%
- 2008→2024 swing
- -32.5pp toward R · 2008: -47.3pp · 2024: -79.8pp
- All cycles
- 2024: R+79.8 2020: R+77.5 2016: R+71.7 2012: R+55.0 2008: R+47.3
Not yet ingested
- Civics
- —
Market trends
- HPI YoY
- ▲ 15.49%
- Current HPI
- 272.5184
- Rent YoY
- —
- Metro
- —
- State GDP YoY
- ▲ 2.78%
- F500 in state
- 22
Industry mix (Fortune 500 HQ in TN)
| Industry | F500 HQs | Revenue |
|---|---|---|
| Healthcare | 3 | $91B |
|
||
| Retail | 3 | $72B |
|
||
| Transportation / Logistics | 1 | $88B |
|
||
| Paper / Packaging | 1 | $19B |
|
||
| Insurance | 1 | $13B |
|
||
| Energy | 1 | $12B |
|
||
Price history
-13.3% since first listed3 events — show timeline
- 2026-04-17 Listed $129,900 Knoxville MLS
- 2015-03-12 Listing Removed — Knoxville MLS
- 2015-01-28 Listed $149,900 Knoxville MLS
Property tax history
+1.4%/yrLatest (2025): $458 · +0.0% YoY. Source: county tax records.
Cash-flow waterfall
monthlySold comps — $/sqft
last 12 mo · ≤1 miLoading sold comps…