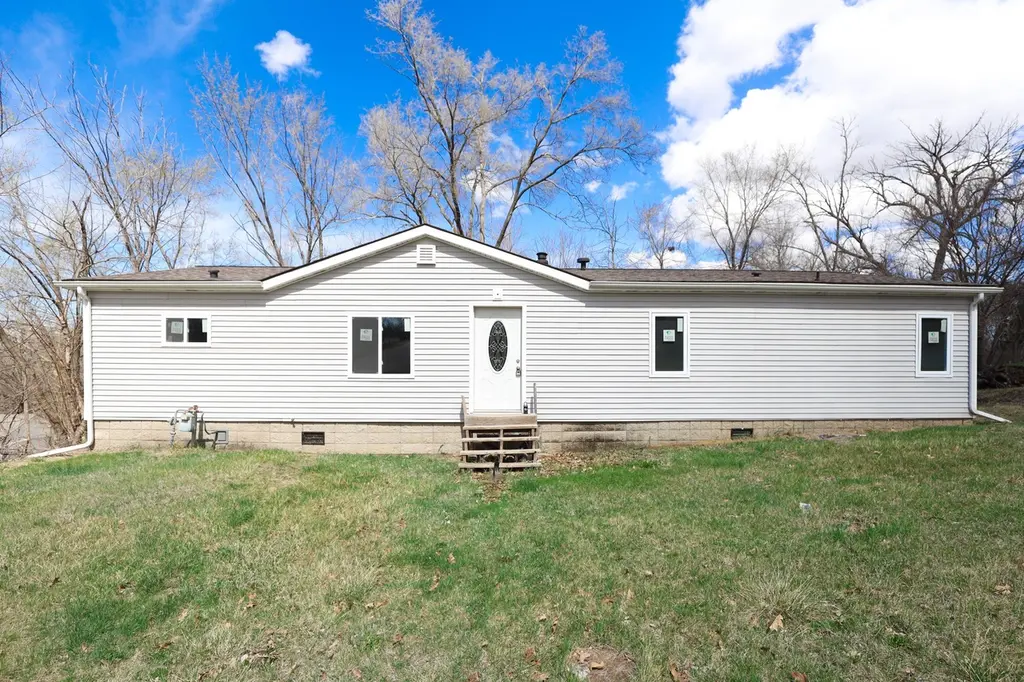
300 E Front St · Colfax, IA
Flood risk 1/10 · Minimal
- FEMA flood zone
- X (unshaded)
- Chance of flooding over 30 yrs
- 0.0%
- Est. flood insurance / yr
- $507 – $1,088
Fire risk 2/10 · Minimal
- Est. fire insurance / yr
- $902 – $1,676
Heat risk 3/10 · Minor
- Hot days now (above 103°F)
- 7 days/yr
- Hot days in 30 yrs
- 15 days/yr
Wind risk 2/10 · Minimal
- Chance of severe wind over 30 yrs
- —
Air-quality risk 1/10 · Minimal
- Unhealthy air days now
- 0 days/yr
- Unhealthy air days in 30 yrs
- 0 days/yr
Risk factors via First Street. Map © Google.
Why this score? — see what drove the B grade
The composite is a weighted blend of 9 inputs, each scored 0–100. Each bar is that input's sub-score; the figure is the points it added to the 100-point composite (weight × sub-score).
- Cash flow +30.0/30.0
- 1% rule +10.0/10.0
- DSCR +10.0/10.0
- ARV discount +7.5/15.0
- Schools +5.4/10.0
- Livability +3.7/5.0
- Rent growth +2.5/5.0
- Condition / age +2.5/5.0
- Appreciation +0.0/10.0
$75,000
🖨 Deal sheet 📄 Offer letter ✓ Due diligence
Listing remarks MLS
This property offers great potential for investors, with significant exterior updates already completed, including all-new windows, a back sliding door, new siding, soffit, fascia, and gutters, plus a new roof installed in 2019. The interior is a blank canvas, ready for personal touches to bring it to life. Located in Colfax, it offers small-town charm with the convenience of Altoona shopping just a short drive away.
Key facts
- New siding
- Back sliding door
- Soffit
Tags
Neighborhood map
What this means for you Summary
Snapshot
- This is a 3-bed/2.0-bath single-family listed at $75k.
Deal economics
- At list price, monthly cash flow is $502 ($6k/yr) — positive.
- The deal already cash-flows at list — no discount required.
- Meets the 1% rule at list price ($1k rent vs $75k).
- Recommended offer: $66k (12.0% below list) — sets the bar for market timing.
Location & tenants
- Location reads 74/100 on livability (#242 in IA, #4,698 nationally) — a middle-class / working-renter tenant base. Strengths: crime A+, cost of living A+, housing A+; Watch: amenities F, commute F, health & safety F.
- Colfax-Mingo Community School District (rural): math 59% / reading 66% proficiency, ranked #213 of 289 in IA (top 74%) — acceptable for families but not a draw, mixed tenant base, ~2y average lease.
- Market conditions: 22 active listings in the ZIP; 16 units permitted in Jasper County in 2024 (0 in 5+ unit buildings).
Forward outlook
- Local home prices are declining (-3.0%/yr); year-one equity from $519 of loan paydown is wiped out by about $2k of value loss. Plan a longer hold.
- Jasper County population projected to shrink 7% by 2050 — rents likely to lag national; underwrite the cash flow, not the appreciation.
- At projected returns (-3.0% appreciation + 3.0% rent growth), your $21k cash investment doubles in ~5 years — after that, you're playing with house money.
Negotiation context
- It's been on market 438 days — a 12% lower offer ($66k) is reasonable based on typical stale-listing flexibility.
- 8 sale attempts since 21y ago; this cycle's ask has dropped $13k (15%) from the opening price — seller is motivated, your offer sets the floor, not the list.
- Current owner paid $40k; list at $75k implies a 88% gain — meaningful room to come down on a strong offer.
Questions for the listing agent
- It's been on market 438 days. Have you received any prior offers? Is the seller open to a 12% concession, seller financing, or rate buy-down credit?
- Why hasn't it sold? Are there any deal-killer items the seller is aware of (foundation, flood, title, zoning, code violations)?
- Is there a deadline driving the sale (1031 exchange, divorce, estate, relocation)? That informs how much negotiation room exists.
- Schools are B-rated — typically a magnet for longer-tenancy family renters. What's the average tenant stay here, and is there a school-zone premium baked into asking?
- What's the average days-on-market for RENTAL listings here right now (not sales)? A rising rental-DOM trend means longer vacancies and softer asking-rent achievability than the comps imply.
- What's the recent tenant-quality profile in this submarket — average credit score on applications, eviction rate, late-payment / NSF rate, and stable-employment percentage? A property-management company in the area should have these aggregated.
- How much new for-sale + rental construction is in the pipeline within 1–3 miles? Heavy new supply typically softens prices + rents 12–24 months out; constrained supply supports both.
Investment metrics
- 1% rule
- 1.72% ✓
- Cap rate
- 14.33%
- Cash-on-cash
- 28.70%
- DSCR
- 2.28
- GRM
- 4.9
CMA / ARV
- ARV (median comp)
- $204,938
- List price
- $75,000
- Delta
- -63.40%
- Verdict
- UNDERPRICED
- Comps
- 20 within 1.0 mi
Show comp detail 12 sales within ~0.75 mi
| Address | Dist | Beds/Ba | Sqft | Sold | Price | $/sf | Match |
|---|---|---|---|---|---|---|---|
| 103 N Iowa St | 0.12mi | 3/2.0 | 1,458 (-4%) | 8mo | $265,000 | $182 | 81 |
| 102 E Broadway St | 0.32mi | 3/2.0 | 1,550 (+2%) | 8mo | $200,000 | $129 | 75 |
| 423 E Howard St | 0.13mi | 3/1.5 | 1,633 (+8%) | 9mo | $84,900 | $52 | 72 |
| 400 S Goodrich St | 0.51mi | 3/1.5 | 1,560 (+3%) | 2mo | $248,000 | $159 | 68 |
| 213 College Ave | 0.28mi | 3/2.5 | 1,560 (+3%) | 20mo | $316,000 | $203 | 63 |
| 208 W Washington St | 0.47mi | 4/1.5 (+1) | 1,488 (-2%) | 12mo | $167,000 | $112 | 58 |
| 115 S Locust St | 0.42mi | 3/1.0 | 1,536 (+2%) | 19mo | $26,725 | $17 | 58 |
| 323 S West St | 0.58mi | 3/2.0 | 1,518 (+0%) | 18mo | $227,431 | $150 | 57 |
| 110 W Broadway St | 0.45mi | 3/1.0 | 1,336 (-12%) | 4mo | $175,000 | $131 | 53 |
| 119 W Washington St | 0.44mi | 3/2.5 | 1,732 (+15%) | 4mo | $253,750 | $147 | 49 |
| 500 W Washington St | 0.61mi | 3/2.0 | 1,296 (-14%) | 4mo | $204,000 | $157 | 44 |
| 300 Cedar St | 0.64mi | 4/2.0 (+1) | 1,346 (-11%) | 21mo | $350,000 | $260 | 30 |
Match score weights: distance 35% · size 25% · config 20% · recency 20%. Top-matched comps best support the ARV.
Projected returns pro-forma
-3.0% appreciation · 3.0% rent growth · sell at horizon
- IRR
- 23.0%
- Equity multiple
- 1.95×
- Total profit
- $19,851
- Equity at exit
- $11,183
- IRR
- 31.0%
- Equity multiple
- 3.79×
- Total profit
- $58,546
- Equity at exit
- $6,485
Cash invested: $21,000 (down + closing). Projections, not guarantees.
Landlord ↔ Tenant lean methodology
- Overall (STATE)
- 83 Strongly Landlord-Friendly
- State Iowa
- 83 Strongly Landlord-Friendly · R+6
- County
- — inherits STATE
- City
- — inherits STATE
ZIP-level market 50054
- Home prices YoY
- -7.7%
- Active inventory
- 22
- Price-to-rent
- 4.9×
Monthly cashflow live
- Estimated rent
- $1,288 medium interval (Pro) →
- Mortgage (P&I)
- −$393
- Tax from tax record
- −$91 /mo · $1,088/yr
- Insurance
- −$31
- HOA
- −$0
- Vacancy / Maint / Mgmt
- −$270
- Net cashflow
- $502
Break-even live
UW: 25.0% down · 7.5% · 30yr · 1.5% tax · 5.0% vac · 8.0% maint · 8.0% mgmt
Financing live
Cash to close
- Down payment
- $18,750
- Closing costs
- $2,250
- Reserves months
- —
- Total cash needed
- —
Loan-product check · same deal, 3 products live
Conventional
25% down · 7.5% · 30yr
- Down + closing
- —
- Monthly P&I
- —
- Monthly cashflow
- —
- DSCR
- —
- Eligible?
- —
Personal DTI + credit; lowest rate.
DSCR
20% down · 8.5% · 30yr
- Down + closing
- —
- Monthly P&I
- —
- Monthly cashflow
- —
- DSCR
- —
- Eligible?
- —
No personal income docs; deal must DSCR.
Hard money
10% down · 12.0% · 12mo
- Down + closing
- —
- Monthly P&I
- —
- Monthly cashflow
- —
- DSCR
- —
- Eligible?
- —
Short-term bridge; refi at stabilization.
Listing history 35 events
-
2026-06-18days on market $75,000 Active 438 DOM
-
2026-06-17days on market $75,000 Active 437 DOM
-
2026-06-16days on market $75,000 Active 436 DOM
-
2026-06-15days on market $75,000 Active 435 DOM
-
2026-06-14days on market $75,000 Active 433 DOM
-
2026-06-13days on market $75,000 Active 432 DOM
-
2026-06-10days on market $75,000 Active 430 DOM
-
2026-06-09days on market $75,000 Active 429 DOM
-
2026-06-08days on market $75,000 Active 428 DOM
-
2026-06-07days on market $75,000 Active 427 DOM
-
2026-06-05days on market $75,000 Active 424 DOM
-
2026-06-03days on market $75,000 Active 423 DOM
-
2026-06-02days on market $75,000 Active 422 DOM
-
2026-06-01days on market $75,000 Active 421 DOM
-
2026-05-31days on market $75,000 Active 420 DOM
-
2026-05-31days on market $75,000 Active 419 DOM
-
2026-04-01price $75,000 420-char remark
Show marketing remark (420 chars)
This property offers great potential for investors, with significant exterior updates already completed, including all-new windows, a back sliding door, new siding, soffit, fascia, and gutters, plus a new roof installed in 2019. The interior is a blank canvas, ready for personal touches to bring it to life. Located in Colfax, it offers small-town charm with the convenience of Altoona shopping just a short drive away.
-
2025-10-06status Active 420-char remark
Show marketing remark (420 chars)
This property offers great potential for investors, with significant exterior updates already completed, including all-new windows, a back sliding door, new siding, soffit, fascia, and gutters, plus a new roof installed in 2019. The interior is a blank canvas, ready for personal touches to bring it to life. Located in Colfax, it offers small-town charm with the convenience of Altoona shopping just a short drive away.
-
2025-10-01historical 420-char remark
Show marketing remark (420 chars)
This property offers great potential for investors, with significant exterior updates already completed, including all-new windows, a back sliding door, new siding, soffit, fascia, and gutters, plus a new roof installed in 2019. The interior is a blank canvas, ready for personal touches to bring it to life. Located in Colfax, it offers small-town charm with the convenience of Altoona shopping just a short drive away.
-
2025-08-01price $80,000 420-char remark
Show marketing remark (420 chars)
This property offers great potential for investors, with significant exterior updates already completed, including all-new windows, a back sliding door, new siding, soffit, fascia, and gutters, plus a new roof installed in 2019. The interior is a blank canvas, ready for personal touches to bring it to life. Located in Colfax, it offers small-town charm with the convenience of Altoona shopping just a short drive away.
-
2025-04-01$88,000 Active 420-char remark
Show marketing remark (420 chars)
This property offers great potential for investors, with significant exterior updates already completed, including all-new windows, a back sliding door, new siding, soffit, fascia, and gutters, plus a new roof installed in 2019. The interior is a blank canvas, ready for personal touches to bring it to life. Located in Colfax, it offers small-town charm with the convenience of Altoona shopping just a short drive away.
-
2024-03-21historical
-
2024-02-23$80,000 Active
-
2024-01-30historical
-
2023-09-06price $90,000
-
2023-08-03$98,000 Active
-
2022-08-08soldstatus $40,000 Closed
-
2022-07-24status Pending
-
2022-07-22$50,000 Active
-
2022-06-10status Pending
-
2022-06-10historical
-
2022-01-03$49,900 Active
-
2016-02-05soldstatus $16,100
-
2015-12-01$14,900
-
2005-06-06$49,900
ⓘ Source: listings_history table (triggers on properties + properties_extension) + one-shot
backfill from property_details.listing_events for pre-trigger history.
Tax reassessment forecast IA · Partial reset (capped growth)
- Current annual tax
- $1,088 · $91/mo
- Projected year-2 tax
- $1,133 · $94/mo
- Expected delta
- +$45/yr (+$4/mo · 4.1%)
ⓘ Screening estimate from a state-policy table — verify with the county assessor before closing.
Climate risk First Street
- Flood 1/10 Low FEMA zone X (unshaded) · 0% chance over 30 yrs
- Wildfire 2/10 Low
- Heat 3/10 Moderate 7 d/yr ≥103°F today · 15 d/yr by 30 yrs out
- Wind 2/10 Low
- Air quality 1/10 Low 0 unhealthy d/yr today · 0 by 30 yrs out
Nearby sold comps map
Loading sold comps map…
Walkable amenities ~0.75 mi
Loading nearby amenities…
Taxation est. · year 1
- Rental income
- $15,455
- − Mortgage interest
- −$4,201
- − Property taxes
- −$1,088
- − Insurance
- −$375
- − Repairs & maintenance
- −$1,236
- − Management
- −$1,236
- − Depreciation
- −$2,182
- Taxable income
- $5,136
- Est. tax owed @ 24.0%
- −$1,233
- After-tax cash flow
- $4,794/yr
For passive investors: Depreciation is non-cash, so a rental often shows a tax loss while cash-flowing — sheltering income. Rental losses are passive: they offset passive income freely, and up to $25,000/yr can offset ordinary (W-2) income if you actively participate and your MAGI is under $100k (phasing out to $0 by $150k); unused losses carry forward. On sale, claimed depreciation is recaptured at up to 25%, and gains may owe capital-gains tax (a 1031 exchange can defer both). Figures are a year-1 estimate at your 24.0% rate — not tax advice; consult a CPA.
Schools (NCES district)
- District
- Colfax-Mingo Community School District
- NCES district ID
- 1900009
- Math proficiency
- 59% ▼ -2.00%
- Reading proficiency
- 66% ▲ 7.00%
- Median HH income
- $53,956
- Composite
- 53.51/100
- National rank
- #1450
- State rank
- #213 of 289 in IA
Livability — Colfax
- Score
- 74/100
- State rank
- #242
- US rank
- #4698
Category grades
Schools grade is shown separately in the Schools card above.
Census & demographics
- Census place
- Colfax, IA
- City population
- 3,179
- Population (ZIP)
- 3,179
Population outlook (Jasper County) Hauer SSP2
- Today (2025)
- 36,216 people
- By 2030
- 35,730 · -1.3%
- By 2040
- 34,727 · -4.1%
- By 2050
- 33,802 · -6.7%
- By 2075
- 33,382 · -7.8%
- By 2100
- 32,761 · -9.5%
Race, ethnicity, and origin ACS 2023
- Neighborhood character
- Predominantly White (94%)
- Race & ethnicity
- White 94% Hispanic / Latino 3% Two or more races 3%
- Common ancestry
- Iranian 5% Slovak 4% Portuguese 4%
- Foreign-born
- 0%
- Languages at home
- 99% English-only · Spanish 1%
Political lean MEDSL · Jasper
- 2024 margin
- Strong R (+27.6) · D 35.4% · R 63.0% · Other 1.5%
- 2008→2024 swing
- -35.1pp toward R · 2008: 7.5pp · 2024: -27.6pp
- All cycles
- 2024: R+27.6 2020: R+21.5 2016: R+18.4 2012: D+7.1 2008: D+7.5
Not yet ingested
- Civics
- —
Market trends
- HPI YoY
- ▼ -23.08%
- Current HPI
- 275.7
- Rent YoY
- —
- Metro
- —
- State GDP YoY
- ▲ 2.48%
- F500 in state
- 4
Industry mix (Fortune 500 HQ in IA)
| Industry | F500 HQs | Revenue |
|---|---|---|
| Financial Services | 1 | $16B |
|
||
| Retail / Convenience | 1 | $15B |
|
||
Price history
+50.3% since first listed19 events — show timeline
- 2026-04-01 Price Changed $75,000 DMMLS
- 2025-10-06 Relisted — DMMLS
- 2025-10-01 Listing Removed — DMMLS
- 2025-08-01 Price Changed $80,000 DMMLS
- 2025-04-01 Listed $88,000 DMMLS
- 2024-03-21 Listing Removed — DMMLS
- 2024-02-23 Listed $80,000 DMMLS
- 2024-01-30 Listing Removed — DMMLS
- 2023-09-06 Price Changed $90,000 DMMLS
- 2023-08-03 Listed $98,000 DMMLS
- 2022-08-08 Sold (MLS) $40,000 DMMLS
- 2022-07-24 Pending — DMMLS
- 2022-07-22 Listed $50,000 DMMLS
- 2022-06-10 Pending — DMMLS
- 2022-06-10 Listing Removed — DMMLS
- 2022-01-03 Listed $49,900 DMMLS
- 2016-02-05 Sold (MLS) $16,100 DMMLS
- 2015-12-01 Listed $14,900 DMMLS
- 2005-06-06 Listed $49,900 DMMLS
Property tax history
-2.7%/yrLatest (2025): $1,088 · -13.0% YoY. Source: county tax records.
Cash-flow waterfall
monthlySold comps — $/sqft
last 12 mo · ≤1 miLoading sold comps…