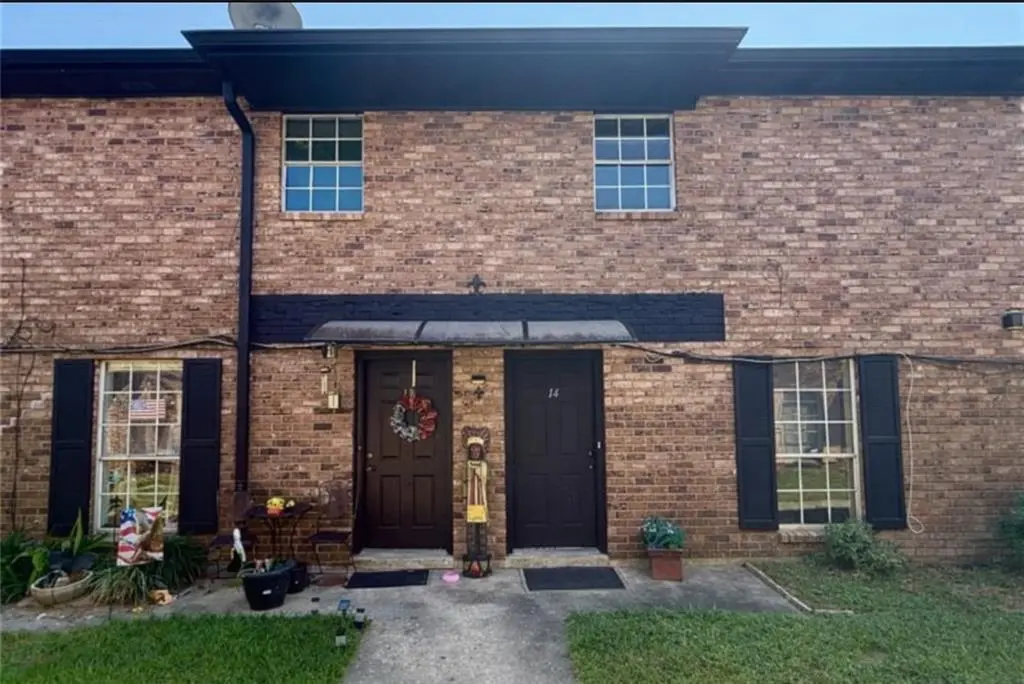
4101 Delaware Ave #14 · Kenner, LA
Flood risk No data
- FEMA flood zone
- —
- Chance of flooding over 30 yrs
- —
- Est. flood insurance / yr
- —
Fire risk No data
- Est. fire insurance / yr
- —
Heat risk No data
- Hot days now (above threshold)
- —
- Hot days in 30 yrs
- —
Wind risk No data
- Chance of severe wind over 30 yrs
- —
Air-quality risk No data
- Unhealthy air days now
- —
- Unhealthy air days in 30 yrs
- —
Risk factors via First Street. Map © Google.
Why this score? — see what drove the C grade
The composite is a weighted blend of 9 inputs, each scored 0–100. Each bar is that input's sub-score; the figure is the points it added to the 100-point composite (weight × sub-score).
- Cash flow +20.3/30.0
- ARV discount +10.5/15.0
- 1% rule +7.8/10.0
- DSCR +6.4/10.0
- Livability +3.9/5.0
- Schools +2.5/10.0
- Condition / age +2.5/5.0
- Rent growth +1.5/5.0
- Appreciation +0.0/10.0
$118,000
🖨 Deal sheet 📄 Offer letter ✓ Due diligence
Listing remarks MLS
Great opportunity to buy in the heart of Kenner! This spacious townhouse offers 2 large bedrooms upstairs, an eat-in kitchen, a laundry room with space for a full-sized washer and dryer, and fresh paint throughout. The unit also features a private fenced patio and is conveniently located by the interstate, shopping, restaurants, and more.
Key facts
- Private fenced patio
- Laundry room
- Eat-in kitchen
Tags
Neighborhood map
What this means for you Summary
Snapshot
- This is a 2-bed/1.5-bath townhouse listed at $118k.
Deal economics
- At list price, monthly cash flow is $150 ($2k/yr) — positive.
- The deal already cash-flows at list — no discount required.
- Meets the 1% rule at list price ($2k rent vs $118k).
- Recommended offer: $107k (9.0% below list) — sets the bar for market timing.
- Cap rate 7.8% vs local median 5.3% in Kenner — top-decile yield for the area; either an underpriced asset or a hidden risk that comps aren't pricing in. Stress-test before assuming the spread holds.
Location & tenants
- Location reads 78/100 on livability (#6 in LA, #2,414 nationally) — a middle-class / working-renter tenant base. Strengths: cost of living A+, housing A+, health & safety A+; Watch: amenities C-, employment C-, crime D.
- Jefferson Parish (suburban): math 24% / reading 34% proficiency, ranked #44 of 98 in LA (top 45%) — low school quality limits family demand, transient renter base, plan for 1-2y turnover; 70% free/reduced lunch — lower-income household profile, screen leases tightly.
- Market conditions: Rents falling (-4.2%/yr); 292 active listings in the ZIP; 40 comparable units currently listed for rent nearby; rentals at typical pace (median 24d on market — plan ~3-4 weeks tenant-placement turnaround); 42% of comp listings sitting > 30 days — soft ceiling on asking rent; 518 units permitted in Jefferson Parish in 2024 (43 in 5+ unit buildings).
Forward outlook
- Local home prices are declining (-3.0%/yr); year-one equity from $816 of loan paydown is wiped out by about $4k of value loss. Plan a longer hold.
Negotiation context
- It's been on market 98 days — a 9% lower offer ($107k) is reasonable based on typical stale-listing flexibility.
- 9 sale attempts since 23y ago; this cycle's ask has dropped $12k (9%) from the opening price — seller is motivated, your offer sets the floor, not the list.
Questions for the listing agent
- It's been on market 98 days. Have you received any prior offers? Is the seller open to a 9% concession, seller financing, or rate buy-down credit?
- What does the HOA fee cover, when was the last increase, and are there any pending special assessments or reserve-fund shortfalls?
- Why hasn't it sold? Are there any deal-killer items the seller is aware of (foundation, flood, title, zoning, code violations)?
- Is there a deadline driving the sale (1031 exchange, divorce, estate, relocation)? That informs how much negotiation room exists.
- Crime grade is D in this area — have there been break-ins, vandalism, or insurance claims at this property in the last 3 years? What carrier currently insures it and at what premium?
- What's the average days-on-market for RENTAL listings here right now (not sales)? A rising rental-DOM trend means longer vacancies and softer asking-rent achievability than the comps imply.
- What's the recent tenant-quality profile in this submarket — average credit score on applications, eviction rate, late-payment / NSF rate, and stable-employment percentage? A property-management company in the area should have these aggregated.
- How much new for-sale + rental construction is in the pipeline within 1–3 miles? Heavy new supply typically softens prices + rents 12–24 months out; constrained supply supports both.
Investment metrics
- 1% rule
- 1.28% ✓
- Cap rate
- 7.82%
- Cash-on-cash
- 5.46%
- DSCR
- 1.24
- GRM
- 6.5
CMA / ARV
- ARV (median comp)
- $126,373
- List price
- $118,000
- Delta
- -6.63%
- Verdict
- FAIR
- Comps
- 20 within 1.0 mi
Show comp detail 11 sales within ~0.75 mi
| Address | Dist | Beds/Ba | Sqft | Sold | Price | $/sf | Match |
|---|---|---|---|---|---|---|---|
| 4101 Delaware Ave #6 | 0.00mi | 2/1.5 | 1,050 (+1%) | 3mo | $113,000 | $108 | 97 |
| 4101 Delaware Ave #17 | 0.00mi | 2/1.5 | 1,044 (0%) | 9mo | $106,700 | $102 | 93 |
| 1635 Newport Pl #1 | 0.20mi | 2/1.5 | 1,036 (-1%) | 2mo | $104,000 | $100 | 88 |
| 1725 Newport Pl #4 | 0.12mi | 2/1.5 | 1,100 (+5%) | 3mo | $105,000 | $95 | 82 |
| 4105 Florida Ave Unit C | 0.07mi | 2/1.5 | 1,085 (+4%) | 16mo | $97,000 | $89 | 77 |
| 1621 Newport Pl #19 | 0.25mi | 2/1.5 | 1,038 (-1%) | 17mo | $107,000 | $103 | 73 |
| 1645 42nd St Unit C | 0.20mi | 2/1.5 | 1,200 (+15%) | 4mo | $108,000 | $90 | 62 |
| 1628 Vintage Dr #16 | 0.23mi | 2/1.5 | 1,127 (+8%) | 23mo | $128,500 | $114 | 56 |
| 57 Antigua Dr Unit A | 0.57mi | 2/1.5 | 1,150 (+10%) | 7mo | $90,000 | $78 | 51 |
| 49 Antigua Dr Unit C | 0.61mi | 2/1.5 | 1,150 (+10%) | 10mo | $125,000 | $109 | 46 |
| 61 Antigua Dr Unit C | 0.55mi | 2/1.5 | 1,136 (+9%) | 22mo | $93,000 | $82 | 41 |
Match score weights: distance 35% · size 25% · config 20% · recency 20%. Top-matched comps best support the ARV.
Projected returns pro-forma
-3.0% appreciation · 0.0% rent growth · sell at horizon
- IRR
- -12.0%
- Equity multiple
- 0.58×
- Total profit
- $-13,805
- Equity at exit
- $17,594
- IRR
- -9.5%
- Equity multiple
- 0.51×
- Total profit
- $-16,106
- Equity at exit
- $10,202
Cash invested: $33,040 (down + closing). Projections, not guarantees.
Landlord ↔ Tenant lean methodology
- Overall (STATE)
- 90 Strongly Landlord-Friendly
- State Louisiana
- 90 Strongly Landlord-Friendly · R+12
- County
- — inherits STATE
- City
- — inherits STATE
ZIP-level market 70065
- Rents YoY
- -4.2%
- Active inventory
- 292
- Price-to-rent
- 6.5×
Monthly cashflow live
- Estimated rent
- $1,506 high interval (Pro) →
- Mortgage (P&I)
- −$619
- Tax from tax record
- −$97 /mo · $1,161/yr
- Insurance
- −$49
- HOA
- −$275
- Vacancy / Maint / Mgmt
- −$316
- Net cashflow
- $150
Break-even live
UW: 25.0% down · 7.5% · 30yr · 1.5% tax · 5.0% vac · 8.0% maint · 8.0% mgmt
Financing live
Cash to close
- Down payment
- $29,500
- Closing costs
- $3,540
- Reserves months
- —
- Total cash needed
- —
Loan-product check · same deal, 3 products live
Conventional
25% down · 7.5% · 30yr
- Down + closing
- —
- Monthly P&I
- —
- Monthly cashflow
- —
- DSCR
- —
- Eligible?
- —
Personal DTI + credit; lowest rate.
DSCR
20% down · 8.5% · 30yr
- Down + closing
- —
- Monthly P&I
- —
- Monthly cashflow
- —
- DSCR
- —
- Eligible?
- —
No personal income docs; deal must DSCR.
Hard money
10% down · 12.0% · 12mo
- Down + closing
- —
- Monthly P&I
- —
- Monthly cashflow
- —
- DSCR
- —
- Eligible?
- —
Short-term bridge; refi at stabilization.
Rent comps 40 comps
| Address | Beds | Baths | Sqft | Rent | $/sqft | DOM | Units | Dist |
|---|---|---|---|---|---|---|---|---|
| 1740 Vintage Dr Unit C Kenner, LA | 2.0 | 1.5 | 1019 | $1,150 | $1.13 | 43d | 1 | 0.03mi |
| 1740 Vintage Dr Unit A Kenner, LA | 2.0 | 1.5 | 1019 | $1,250 | $1.23 | 43d | 1 | 0.03mi |
| 4101 Delaware Ave Kenner, LA | 2.0 | 1.5 | 1100 | $1,499 | $1.36 | 43d | 1 | 0.03mi |
| 4101 Delaware Ave #6 Kenner, LA | 2.0 | 1.5 | 1050 | $1,350 | $1.29 | 23d | 1 | 0.03mi |
| 1717 42nd St Unit D Kenner, LA | 3.0 | 2.0 | 1380 | $1,550 | $1.12 | 43d | 1 | 0.14mi |
| 4018 Arkansas Ave Kenner, LA | 3.0 | 2.0 | 1200 | $1,800 | $1.50 | 3d | 1 | 0.19mi |
| 1600 Newport Pl #4 Kenner, LA | 3.0 | 2.0 | 1400 | $1,550 | $1.11 | 3d | 1 | 0.21mi |
| 1620 Newport Pl Kenner, LA | 3.0 | 2.0 | 1450 | $1,550 | $1.07 | 4d | 1 | 0.26mi |
| 4144 Georgia Ave Unit D Kenner, LA | 2.0 | 2.0 | 1050 | $1,450 | $1.38 | 23d | 1 | 0.26mi |
| 1617 Newport Pl #23 Kenner, LA | 2.0 | 1.5 | 1125 | $1,400 | $1.24 | 43d | 1 | 0.27mi |
| 1617 Newport Pl #23 Kenner, LA | 2.0 | 1.5 | 1125 | $1,395 | $1.24 | 4d | 1 | 0.27mi |
| 1616 Newport Pl Unit A Kenner, LA | 3.0 | 2.0 | 1100 | $1,500 | $1.36 | 43d | 1 | 0.27mi |
| 4145 Idaho Ave Unit D Kenner, LA | 2.0 | 2.5 | 1200 | $1,550 | $1.29 | 43d | 1 | 0.29mi |
| 2150 42nd St Unit B211 Kenner, LA | 1.0 | 1.0 | 899 | $1,230 | $1.37 | 14d | 1 | 0.30mi |
| 2150 42nd St Unit A204 Kenner, LA | 1.0 | 1.0 | 899 | $1,270 | $1.41 | 4d | 1 | 0.30mi |
| 2150 42nd St Unit B310 Kenner, LA | 2.0 | 2.0 | 1100 | $1,495 | $1.36 | 14d | 1 | 0.30mi |
| 2150 42nd St Unit B316 Kenner, LA | 2.0 | 2.0 | 1100 | $1,410 | $1.28 | 4d | 1 | 0.30mi |
| 2150 42nd St Unit A301 Kenner, LA | 2.0 | 2.0 | 1100 | $1,395 | $1.27 | 4d | 1 | 0.30mi |
| 2150 42nd St Unit B113 Kenner, LA | 1.0 | 1.0 | 851 | $1,320 | $1.55 | 4d | 1 | 0.30mi |
| 2150 42nd St Unit A305 Kenner, LA | 1.0 | 1.0 | 899 | $1,330 | $1.48 | 43d | 1 | 0.30mi |
| 4329 Idaho Ave Unit B Kenner, LA | 2.0 | 1.5 | 1120 | $1,425 | $1.27 | 21d | 1 | 0.42mi |
| 4520 Williams Blvd Kenner, LA | 2.0 | 1.0 | 738 | $1,310 | $1.78 | 2d | 15 | 0.44mi |
| 400 Coconut Beach Ct Unit 101 Kenner, LA | 2.0 | 2.0 | 1100 | $2,000 | $1.82 | 23d | 1 | 0.52mi |
| 53 Antigua Dr Unit D Kenner, LA | 2.0 | 1.5 | 1325 | $1,500 | $1.13 | 23d | 1 | 0.57mi |
| 49 Antigua Dr Unit C Kenner, LA | 2.0 | 1.5 | 1150 | $1,450 | $1.26 | 43d | 1 | 0.58mi |
| 4204 Chateau Blvd Unit A Kenner, LA | 2.0 | 1.5 | 1100 | $1,300 | $1.18 | 43d | 1 | 0.72mi |
| 4230 Chateau Blvd Unit C Kenner, LA | 2.0 | 2.0 | 1100 | $1,300 | $1.18 | 23d | 1 | 0.73mi |
| 1500 W Esplanade Ave Kenner, LA | 2.0–3.0 | 2.0 | 1587 | $1,700 | $1.07 | 43d | 1 | 0.75mi |
| 4129 Chateau Blvd Unit C Kenner, LA | 2.0 | 1.5 | 1400 | $1,425 | $1.02 | 4d | 1 | 0.77mi |
| 1400 W Esplanade Ave Kenner, LA | 2.0 | 1.0–2.5 | 801 | $1,370 | $1.71 | 43d | 1 | 0.77mi |
| 4204 Asher Ct Apt D Kenner, LA | 2.0 | 1.5 | 1250 | $1,250 | $1.00 | 14d | 1 | 0.79mi |
| 1014 Saint Julien Dr Unit c2 Kenner, LA | 3.0 | 2.5 | 1450 | $1,850 | $1.28 | 3d | 1 | 0.85mi |
| 4212 Arbor Ct Unit D Kenner, LA | 2.0 | 1.5 | 1079 | $1,320 | $1.22 | 43d | 1 | 0.85mi |
| 61 Emile Ave Kenner, LA | 3.0 | 2.0 | 1450 | $1,900 | $1.31 | 44d | 1 | 0.86mi |
| 1012 St Julien Dr Apt F4 Kenner, LA | 2.0 | 2.5 | 1271 | $1,400 | $1.10 | 20d | 1 | 0.87mi |
| 4213 Arbor Ct Unit A Kenner, LA | 2.0 | 1.5 | 1027 | $1,320 | $1.29 | 43d | 1 | 0.89mi |
| 4206 Paradis Ln Kenner, LA | 3.0 | 2.5 | 1350 | $1,950 | $1.44 | 23d | 1 | 0.90mi |
| 1106 Joe Yenni Blvd Unit 129 Kenner, LA | 1.0 | 1.0 | 1463 | $1,595 | $1.09 | 21d | 1 | 0.97mi |
| 913 Vouray Dr Unit C Kenner, LA | 2.0 | 1.5 | 1200 | $1,200 | $1.00 | 43d | 1 | 0.97mi |
| 909 Vouray Dr Unit c Kenner, LA | 2.0 | 1.5 | 1200 | $1,200 | $1.00 | 43d | 1 | 0.98mi |
HOA detail
- Monthly dues
- $275 · $3,300/yr
Listing history 29 events
-
2026-06-18days on market $118,000 Active 98 DOM
-
2026-06-17days on market $118,000 Active 97 DOM
-
2026-06-16days on market $118,000 Active 96 DOM
-
2026-06-15days on market $118,000 Active 95 DOM
-
2026-06-13days on market $118,000 Active 93 DOM
-
2026-06-10days on market $118,000 Active 90 DOM
-
2026-06-09days on market $118,000 Active 89 DOM
-
2026-06-08days on market $118,000 Active 88 DOM
-
2026-06-07days on market $118,000 Active 87 DOM
-
2026-06-03days on market $118,000 Active 83 DOM
-
2026-06-02days on market $118,000 Active 82 DOM
-
2026-06-01days on market $118,000 Active 81 DOM
-
2026-05-31days on market $118,000 Active 80 DOM
-
2026-05-12price $118,000 340-char remark
Show marketing remark (340 chars)
Great opportunity to buy in the heart of Kenner! This spacious townhouse offers 2 large bedrooms upstairs, an eat-in kitchen, a laundry room with space for a full-sized washer and dryer, and fresh paint throughout. The unit also features a private fenced patio and is conveniently located by the interstate, shopping, restaurants, and more.
-
2026-03-12$130,000 Active 340-char remark
Show marketing remark (340 chars)
Great opportunity to buy in the heart of Kenner! This spacious townhouse offers 2 large bedrooms upstairs, an eat-in kitchen, a laundry room with space for a full-sized washer and dryer, and fresh paint throughout. The unit also features a private fenced patio and is conveniently located by the interstate, shopping, restaurants, and more.
-
2026-03-03historical $1,250
-
2026-03-03$1,250
-
2025-09-12$130,000 Active
-
2025-09-12$130,000 Active
-
2007-04-30soldstatus $122,500
-
2007-04-27soldstatus $123,500
-
2007-03-22$119,000
-
2007-03-22$119,000
-
2003-12-19soldstatus $76,900
-
2003-12-01soldstatus $76,900
-
2003-01-02$76,900
-
2003-01-02$76,900
ⓘ Source: listings_history table (triggers on properties + properties_extension) + one-shot
backfill from property_details.listing_events for pre-trigger history.
Tax reassessment forecast LA · Resets to sale price
- Current annual tax
- $1,161 · $97/mo
- Projected year-2 tax
- $1,161 · $97/mo
- Expected delta
- $0/yr ($0/mo · 0.0%)
ⓘ Screening estimate from a state-policy table — verify with the county assessor before closing.
Nearby sold comps map
Loading sold comps map…
Walkable amenities ~0.75 mi
Loading nearby amenities…
Taxation est. · year 1
- Rental income
- $18,076
- − Mortgage interest
- −$6,610
- − Property taxes
- −$1,161
- − Insurance
- −$590
- − Repairs & maintenance
- −$1,446
- − Management
- −$1,446
- − HOA
- −$3,300
- − Depreciation
- −$3,433
- Taxable income
- $90
- Est. tax owed @ 24.0%
- −$22
- After-tax cash flow
- $1,782/yr
For passive investors: Depreciation is non-cash, so a rental often shows a tax loss while cash-flowing — sheltering income. Rental losses are passive: they offset passive income freely, and up to $25,000/yr can offset ordinary (W-2) income if you actively participate and your MAGI is under $100k (phasing out to $0 by $150k); unused losses carry forward. On sale, claimed depreciation is recaptured at up to 25%, and gains may owe capital-gains tax (a 1031 exchange can defer both). Figures are a year-1 estimate at your 24.0% rate — not tax advice; consult a CPA.
Schools (NCES district)
- District
- Jefferson Parish
- NCES district ID
- 2200840
- Math proficiency
- 24% ▼ -36.00%
- Reading proficiency
- 34% ▼ -30.00%
- Median HH income
- $48,421
- Composite
- 25.19/100
- National rank
- #7511
- State rank
- #44 of 98 in LA
Livability — Kenner
- Score
- 78/100
- State rank
- #6
- US rank
- #2414
Category grades
Schools grade is shown separately in the Schools card above.
Census & demographics
- Census place
- Kenner, LA
- County
- Jefferson Parish · 426,999 people
- City population
- 66,707
- Metro
- New Orleans-Metairie, LA
- Population (ZIP)
- 48,936
- Household income
- $67,285
- Rent vs Own
- Severe rent burden
- 1906.0
Population outlook (Jefferson County) Hauer SSP2
- Today (2025)
- 451,696 people
- By 2030
- 455,451 · +0.8%
- By 2040
- 458,308 · +1.5%
- By 2050
- 461,031 · +2.1%
- By 2075
- 476,351 · +5.5%
- By 2100
- 499,377 · +10.6%
Race, ethnicity, and origin ACS 2023
- Neighborhood character
- Diverse neighborhood (Simpson 0.69)
- Race & ethnicity
- White 47% Hispanic / Latino 27% Two or more races 15% Black 15% Asian 6%
- Hispanic origin (detail)
- Mexican 2% Puerto Rican 3% Cuban 2%
- Common ancestry
- Lithuanian 9% Slovak 1% Italian 1%
- Foreign-born
- 19% · Canada, China, Vietnam
- Languages at home
- 72% English-only · Spanish 21% Other Indo-European 3% Arabic 1%
Political lean MEDSL · Jefferson
- 2024 margin
- R (+12.9) · D 42.5% · R 55.5% · Other 2.1%
- 2008→2024 swing
- +13.6pp toward D · 2008: -26.6pp · 2024: -12.9pp
- All cycles
- 2024: R+12.9 2020: R+11.1 2016: R+14.8 2012: R+18.4 2008: R+26.6
Not yet ingested
- Civics
- —
Market trends
- HPI YoY
- ▼ -214.79%
- Current HPI
- 139.5115
- Rent YoY
- ▼ -4.19%
- Metro
- New Orleans-Metairie, LA
- State GDP YoY
- ▲ 3.29%
- F500 in state
- 10
Industry mix (Fortune 500 HQ in LA)
| Industry | F500 HQs | Revenue |
|---|---|---|
| Telecommunications | 2 | $23B |
|
||
| Utilities | 1 | $12B |
|
||
| Wholesale / Distribution | 1 | $5B |
|
||
| Advertising | 1 | $2B |
|
||
Price history
+53.4% since first listed16 events — show timeline
- 2026-05-12 Price Changed $118,000 AcadianaMLS
- 2026-05-12 Price Changed $118,000 GSREIN
- 2026-03-12 Listed $130,000 GSREIN
- 2026-03-12 Listed $130,000 AcadianaMLS
- 2026-03-03 Rental Removed $1,250 RAAMLS
- 2026-03-03 Listed for Rent $1,250 RAAMLS
- 2025-09-12 Listed $130,000 AcadianaMLS
- 2025-09-12 Listed $130,000 AcadianaMLS
- 2007-04-30 Sold (MLS) $122,500 GSREIN
- 2007-04-27 Sold (Public Records) $123,500 Public Records
- 2007-03-22 Listed $119,000 AcadianaMLS
- 2007-03-22 Listed $119,000 GSREIN
- 2003-12-19 Sold (MLS) $76,900 GSREIN
- 2003-12-01 Sold (Public Records) $76,900 Public Records
- 2003-01-02 Listed $76,900 AcadianaMLS
- 2003-01-02 Listed $76,900 GSREIN
Property tax history
+2.2%/yrLatest (2025): $1,161 · -0.4% YoY. Source: county tax records.
Cash-flow waterfall
monthlySold comps — $/sqft
last 12 mo · ≤1 miLoading sold comps…