108 Cardinal Way · Santa Rosa, CA
Flood risk 7/10 · Major
- FEMA flood zone
- X (unshaded)
- Chance of flooding over 30 yrs
- 0.99%
- Est. flood insurance / yr
- $507 – $1,088
Fire risk 5/10 · Moderate
- Est. fire insurance / yr
- $659 – $1,223
Heat risk 4/10 · Minor
- Hot days now (above 93°F)
- 7 days/yr
- Hot days in 30 yrs
- 15 days/yr
Wind risk 1/10 · Minimal
- Chance of severe wind over 30 yrs
- —
Air-quality risk 10/10 · Severe
- Unhealthy air days now
- 21 days/yr
- Unhealthy air days in 30 yrs
- 21 days/yr
Risk factors via First Street. Map © Google.
Why this score? — see what drove the B grade
The composite is a weighted blend of 9 inputs, each scored 0–100. Each bar is that input's sub-score; the figure is the points it added to the 100-point composite (weight × sub-score).
- Cash flow +30.0/30.0
- ARV discount +11.8/15.0
- DSCR +10.0/10.0
- 1% rule +9.4/10.0
- Livability +3.8/5.0
- Schools +3.7/10.0
- Rent growth +3.3/5.0
- Condition / age +2.5/5.0
- Appreciation +0.0/10.0
$170,000
🖨 Deal sheet 📄 Offer letter ✓ Due diligence
Listing remarks
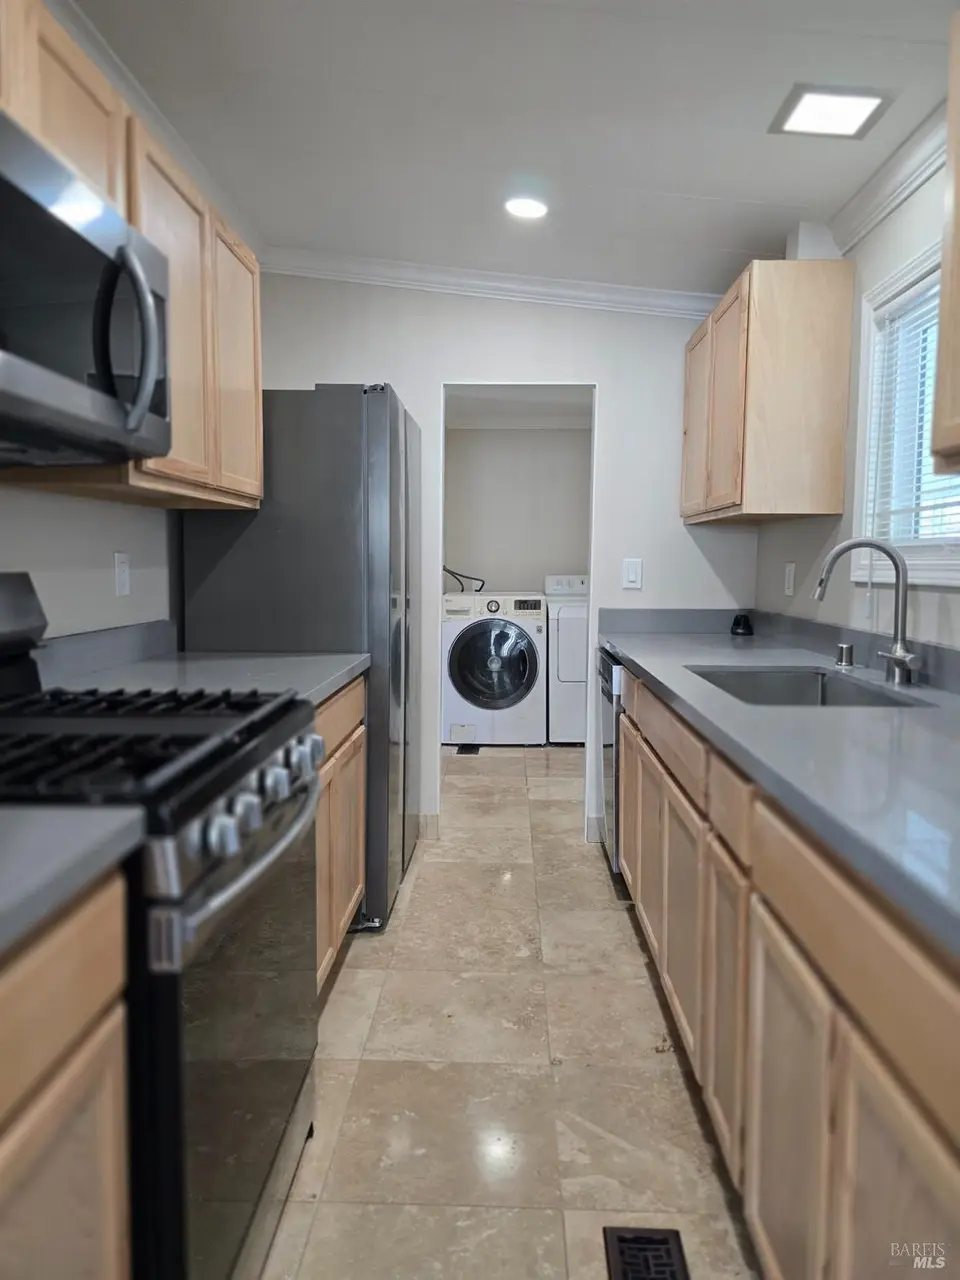
Fully remodeled home in Rincon Valley senior community. 2 bedrooms/2 bathrooms, Extra large Primary bedroom suite with sitting area. Fully remodeled with Travert1en tile in bathrooms , hall and kitchen, fully sheet rocked, Dual pane windows. Separate laundry area with heavy duty washer and dryer. New exterior paint, skirting & earthquake tie downs (2015) central air. Located on the quiet end of the street & features a storage shed. A must see!
Key facts
- Travertine tile
- New exterior paint
- Storage shed
Tags
Property features AI
Finance
- Financial info: Monthly land lease: $829
- HOA & community: No homeowners association; Senior community
Exterior
- Parking: 2 covered parking spaces
- Utilities: Individual gas meter; Underground utilities; Public sewer
- Home design: Manufactured home in park; Double wide
- Construction: Marlette manufacturer; Vinyl skirting
- Exterior features: Located in a senior community; Park name: Rincon Valley Mobile Estates
Interior
- Kitchen: Dishwasher; Free standing gas range; Free standing refrigerator; Microwave; Stone countertops
- Bedrooms: 2 bedrooms
- Flooring: Carpet; See remarks
- Bathrooms: 2 full bathrooms; Shower stall(s)
- Heating & cooling: Central heating; Central cooling
- Interior features: Updated/remodeled interior; Stone countertops; Disposal
- Laundry & utility: Washer included; Dryer included; Laundry inside unit
Neighborhood map
What this means for you Summary
Snapshot
- This is a 2-bed/2.0-bath manufactured listed at $170k.
Deal economics
- At list price, monthly cash flow is $879 ($11k/yr) — positive.
- The deal already cash-flows at list — no discount required.
- Meets the 1% rule at list price ($2k rent vs $170k).
- Recommended offer: $160k (6.0% below list) — sets the bar for market timing.
- Cap rate 13.0% vs local median 2.5% in Santa Rosa — top-decile yield for the area; either an underpriced asset or a hidden risk that comps aren't pricing in. Stress-test before assuming the spread holds.
Location & tenants
- Location reads 75/100 on livability (#112 in CA, #3,940 nationally) — a middle-class / working-renter tenant base. Strengths: amenities A+, commute A+, employment A+; Watch: schools C-, cost of living F.
- Santa Rosa High (urban): math 31% / reading 47% proficiency, ranked #703 of 1,400 in CA (top 50%) — families likely to look elsewhere, expect single-tenant / working-renter base with shorter leases.
- Market conditions: Rents rising (+3.3%/yr); 154 active listings in the ZIP; 19 comparable units currently listed for rent nearby; rentals leasing fast (median 14d on market — plan ~1-2 weeks tenant-placement turnaround); solid renter incomes; 1,039 units permitted in Sonoma County in 2024 (185 in 5+ unit buildings).
Forward outlook
- Local home prices are declining (-3.0%/yr); year-one equity from $1k of loan paydown is wiped out by about $5k of value loss. Plan a longer hold.
- Sonoma County population projected at +8% by 2050 — modest demand growth; plan on rents tracking national, not racing it.
- At projected returns (-3.0% appreciation + 3.3% rent growth), your $48k cash investment doubles in ~6 years — after that, you're playing with house money.
Negotiation context
- It's been on market 81 days — a 6% lower offer ($160k) is reasonable based on typical stale-listing flexibility.
- 5 sale attempts since 6y ago; this cycle's ask has dropped $20k (11%) from the opening price — seller is motivated, your offer sets the floor, not the list.
- Current owner paid $130k; 31% above their basis — modest negotiation headroom, anchor on the comps not their cost.
Risks & watch-outs
- Watch-outs: flood insurance adds $66/mo.
- Climate carrying-cost: major flood risk; moderate wildfire risk — expect insurance premiums to compound above CPI over the hold.
Questions for the listing agent
- It's been on market 81 days. Have you received any prior offers? Is the seller open to a 6% concession, seller financing, or rate buy-down credit?
- Built in 1969 — when were the roof, HVAC, electrical panel, plumbing, and water heater last replaced?
- What's the actual annual flood-insurance premium (NFIP or private), and is the property in a SFHA with mandatory coverage?
- Why hasn't it sold? Are there any deal-killer items the seller is aware of (foundation, flood, title, zoning, code violations)?
- Is there a deadline driving the sale (1031 exchange, divorce, estate, relocation)? That informs how much negotiation room exists.
- What's the average days-on-market for RENTAL listings here right now (not sales)? A rising rental-DOM trend means longer vacancies and softer asking-rent achievability than the comps imply.
- What's the recent tenant-quality profile in this submarket — average credit score on applications, eviction rate, late-payment / NSF rate, and stable-employment percentage? A property-management company in the area should have these aggregated.
- How much new for-sale + rental construction is in the pipeline within 1–3 miles? Heavy new supply typically softens prices + rents 12–24 months out; constrained supply supports both.
Investment metrics
- 1% rule
- 1.44% ✓
- Cap rate
- 12.97%
- Cash-on-cash
- 23.83%
- DSCR
- 2.06
- GRM
- 5.8
CMA / ARV
- ARV (on-the-fly)
- $188,160
- Comps found
- 12
Show comp detail 12 sales within ~0.75 mi
| Address | Dist | Beds/Ba | Sqft | Sold | Price | $/sf | Match |
|---|---|---|---|---|---|---|---|
| 76 Cardinal Way | 0.09mi | 2/2.0 | 1,120 (0%) | 8mo | $220,000 | $196 | 89 |
| 111 Cardinal Way | 0.02mi | 2/2.0 | 1,000 (-11%) | 0mo | $120,000 | $120 | 81 |
| 187 Blue Jay Dr | 0.08mi | 2/2.0 | 1,050 (-6%) | 11mo | $176,000 | $168 | 77 |
| 71 Oriole Way | 0.20mi | 2/2.0 | 1,056 (-6%) | 8mo | $230,000 | $218 | 74 |
| 170 Blue Jay Dr | 0.10mi | 2/2.0 | 1,037 (-7%) | 11mo | $240,000 | $231 | 74 |
| 94 Buckwood Pl | 0.53mi | 2/2.0 | 1,080 (-4%) | 2mo | $119,000 | $110 | 67 |
| 48 Cardinal Way | 0.16mi | 2/2.0 | 1,288 (+15%) | 10mo | $244,000 | $189 | 60 |
| 6 Larkspur Pl | 0.58mi | 2/2.0 | 1,200 (+7%) | 2mo | $90,000 | $75 | 59 |
| 104 Bluejay Dr #135 | 0.18mi | 2/2.0 | 960 (-14%) | 16mo | $160,000 | $167 | 54 |
| 99 Buckwood Pl | 0.55mi | 2/2.0 | 1,060 (-5%) | 16mo | $180,000 | $170 | 52 |
| 162 Larkspur Dr | 0.63mi | 2/2.0 | 1,248 (+11%) | 15mo | $100,000 | $80 | 39 |
| 11 Larkspur Pl | 0.57mi | 2/2.0 | 1,248 (+11%) | 22mo | $122,500 | $98 | 36 |
Match score weights: distance 35% · size 25% · config 20% · recency 20%. Top-matched comps best support the ARV.
Projected returns pro-forma
-3.0% appreciation · 3.28% rent growth · sell at horizon
- IRR
- 15.2%
- Equity multiple
- 1.61×
- Total profit
- $29,094
- Equity at exit
- $25,348
- IRR
- 24.1%
- Equity multiple
- 3.10×
- Total profit
- $100,142
- Equity at exit
- $14,698
Cash invested: $47,600 (down + closing). Projections, not guarantees.
Landlord ↔ Tenant lean methodology
- Overall (STATE)
- 18 Strongly Tenant-Friendly
- State California
- 18 Strongly Tenant-Friendly · D+13
- County
- — inherits STATE
- City
- — inherits STATE
ZIP-level market 95409
- Rents YoY
- 3.3%
- Active inventory
- 154
- Price-to-rent
- 5.8×
Monthly cashflow live
- Estimated rent
- $2,453 high interval (Pro) →
- Mortgage (P&I)
- −$891
- Tax from tax record
- −$30 /mo · $358/yr
- Insurance
- −$71
- Flood insurance flood zone
- −$66 /mo · $798/yr
- HOA
- −$0
- Vacancy / Maint / Mgmt
- −$515
- Net cashflow
- $879
Break-even live
UW: 25.0% down · 7.5% · 30yr · 1.5% tax · 5.0% vac · 8.0% maint · 8.0% mgmt
Financing live
Cash to close
- Down payment
- $42,500
- Closing costs
- $5,100
- Reserves months
- —
- Total cash needed
- —
Loan-product check · same deal, 3 products live
Conventional
25% down · 7.5% · 30yr
- Down + closing
- —
- Monthly P&I
- —
- Monthly cashflow
- —
- DSCR
- —
- Eligible?
- —
Personal DTI + credit; lowest rate.
DSCR
20% down · 8.5% · 30yr
- Down + closing
- —
- Monthly P&I
- —
- Monthly cashflow
- —
- DSCR
- —
- Eligible?
- —
No personal income docs; deal must DSCR.
Hard money
10% down · 12.0% · 12mo
- Down + closing
- —
- Monthly P&I
- —
- Monthly cashflow
- —
- DSCR
- —
- Eligible?
- —
Short-term bridge; refi at stabilization.
Rent comps 19 comps
| Address | Beds | Baths | Sqft | Rent | $/sqft | DOM | Units | Dist |
|---|---|---|---|---|---|---|---|---|
| 1201 Mission Blvd Unit 1255 Santa Rosa, CA | 2.0 | 1.0 | 970 | $2,000 | $2.06 | 13d | 1 | 0.19mi |
| 701 Mission Blvd Santa Rosa, CA | 2.0 | 1.0 | 850 | $1,995 | $2.35 | 21d | 1 | 0.30mi |
| 4656 Quigg Dr Santa Rosa, CA | 1.0–3.0 | 1.0–2.0 | 950 | $2,680 | $2.82 | 13d | 9 | 0.30mi |
| 808 Shady Oak Dr Santa Rosa, CA | 2.0 | 2.0 | 1100 | $2,800 | $2.55 | 13d | 1 | 0.46mi |
| 4145 Shadow Ln Santa Rosa, CA | 1.0–2.0 | 1.0–2.0 | 825 | $2,893 | $3.51 | 13d | 11 | 0.58mi |
| 6123 Montecito Blvd Unit rh6123Montecito14 Santa Rosa, CA | 2.0 | 1.0 | 700 | $2,150 | $3.07 | 21d | 1 | 0.61mi |
| 6233 Montecito Blvd Santa Rosa, CA | 2.0 | 1.0 | 750 | $2,195 | $2.93 | 13d | 1 | 0.66mi |
| 6221 Montecito Blvd Santa Rosa, CA | 2.0 | 1.0 | 750 | $2,145 | $2.86 | 13d | 3 | 0.67mi |
| 6263 Montecito Blvd Unit 05 Santa Rosa, CA | 2.0 | 1.0 | 1000 | $2,650 | $2.65 | 13d | 1 | 0.73mi |
| 6263 Montecito Blvd Santa Rosa, CA | 2.0 | 1.0 | 1000 | $2,650 | $2.65 | 23d | 1 | 0.74mi |
| 6401 Montecito Blvd Santa Rosa, CA | 2.0 | 1.0 | 835 | $1,975 | $2.37 | 13d | 1 | 0.78mi |
| 42 Redwood Ct Santa Rosa, CA | 3.0 | 2.0 | 1166 | $2,700 | $2.32 | 13d | 1 | 0.80mi |
| 6600 Montecito Blvd Unit 49 Santa Rosa, CA | 1.0 | 1.0 | 750 | $1,999 | $2.67 | 23d | 1 | 0.85mi |
| 6600 Montecito Blvd Unit 02 Santa Rosa, CA | 2.0 | 2.0 | 950 | $2,450 | $2.58 | 21d | 1 | 0.85mi |
| 3732 Ahl Park Ct Santa Rosa, CA | 1.0–2.0 | 1.0–2.0 | 1025 | $2,796 | $2.73 | 13d | 7 | 0.89mi |
| 174 S Boas Dr Santa Rosa, CA | 1.0–2.0 | 1.0–2.0 | 781 | $2,755 | $3.53 | 13d | 6 | 0.93mi |
| 3637 Sonoma Ave Santa Rosa, CA | 2.0 | 1.5 | 1117 | $2,599 | $2.33 | 13d | 3 | 0.95mi |
| 695 Summerfield Rd Santa Rosa, CA | 2.0 | 1.0 | 719 | $2,345 | $3.26 | 13d | 1 | 1.01mi |
| 5145 Parkhurst Dr Santa Rosa, CA | 1.0 | 1.0 | 750 | $2,469 | $3.29 | 13d | 1 | 1.34mi |
Listing history 41 events
-
2026-06-18days on market $170,000 Active 81 DOM
-
2026-06-17days on market $170,000 Active 80 DOM
-
2026-06-16days on market $170,000 Active 79 DOM
-
2026-06-15days on market $170,000 Active 78 DOM
-
2026-06-14days on market $170,000 Active 76 DOM
-
2026-06-13days on market $170,000 Active 75 DOM
-
2026-06-10days on market $170,000 Active 73 DOM
-
2026-06-09days on market $170,000 Active 72 DOM
-
2026-06-08days on market $170,000 Active 71 DOM
-
2026-06-07days on market $170,000 Active 70 DOM
-
2026-06-05days on market $170,000 Active 67 DOM
-
2026-06-03days on market $170,000 Active 66 DOM
-
2026-06-02days on market $170,000 Active 65 DOM
-
2026-06-01days on market $170,000 Active 64 DOM
-
2026-05-31days on market $170,000 Active 63 DOM
-
2026-05-30pricedays on market $170,000 Active 62 DOM
-
2026-05-06price $180,000
-
2026-03-30$190,000 Active
-
2026-02-13price $199,000
-
2026-01-27price $205,000
-
2026-01-21price $210,000
-
2026-01-14price $215,000
-
2026-01-05price $220,000
-
2025-12-19price $225,000
-
2025-12-12price $227,500
-
2025-11-28price $230,000
-
2025-11-15price $232,000
-
2025-10-30price $234,500
-
2025-10-19price $236,500
-
2025-08-22$238,500 Active
-
2025-07-30price $239,500
-
2025-06-27$240,000 Active
-
2021-10-22soldstatus $130,000 Closed
-
2021-09-29historical Contingent (No Show)
-
2021-09-05price $145,000
-
2021-08-13price $149,000
-
2021-08-03price $155,000
-
2021-06-03price $159,000
-
2021-04-30price $163,000
-
2021-03-20status Active
-
2020-09-18$169,000 Active
ⓘ Source: listings_history table (triggers on properties + properties_extension) + one-shot
backfill from property_details.listing_events for pre-trigger history.
Tax reassessment forecast CA · Resets to sale price
- Current annual tax
- $358 · $30/mo
- Projected year-2 tax
- $1,292 · $108/mo
- Expected delta
- +$934/yr (+$78/mo · 261.2%)
ⓘ Screening estimate from a state-policy table — verify with the county assessor before closing.
Climate risk First Street
- Flood 7/10 Severe FEMA zone X (unshaded) · 99% chance over 30 yrs
- Wildfire 5/10 Major
- Heat 4/10 Moderate 7 d/yr ≥93°F today · 15 d/yr by 30 yrs out
- Wind 1/10 Low
- Air quality 10/10 Extreme 21 unhealthy d/yr today · 21 by 30 yrs out
Nearby sold comps map
Loading sold comps map…
Walkable amenities ~0.75 mi
Loading nearby amenities…
Taxation est. · year 1
- Rental income
- $29,432
- − Mortgage interest
- −$9,523
- − Property taxes
- −$358
- − Insurance
- −$1,648
- − Repairs & maintenance
- −$2,355
- − Management
- −$2,355
- − Depreciation
- −$4,945
- Taxable income
- $8,249
- Est. tax owed @ 24.0%
- −$1,980
- After-tax cash flow
- $8,568/yr
For passive investors: Depreciation is non-cash, so a rental often shows a tax loss while cash-flowing — sheltering income. Rental losses are passive: they offset passive income freely, and up to $25,000/yr can offset ordinary (W-2) income if you actively participate and your MAGI is under $100k (phasing out to $0 by $150k); unused losses carry forward. On sale, claimed depreciation is recaptured at up to 25%, and gains may owe capital-gains tax (a 1031 exchange can defer both). Figures are a year-1 estimate at your 24.0% rate — not tax advice; consult a CPA.
Schools (NCES district)
- District
- Santa Rosa High
- NCES district ID
- 0635830
- Math proficiency
- 31% —
- Reading proficiency
- 47% —
- Median HH income
- $62,000
- Composite
- 37.25/100
- National rank
- #8972
- State rank
- #703 of 1400 in CA
Livability — Santa Rosa
- Score
- 75/100
- State rank
- #112
- US rank
- #3940
Category grades
Schools grade is shown separately in the Schools card above.
Census & demographics
- Census place
- Santa Rosa, CA
- County
- Sonoma County · 449,805 people
- City population
- 210,074
- Metro
- Santa Rosa-Petaluma, CA
- Population (ZIP)
- 25,616
- Household income
- $107,867
- Rent vs Own
- Severe rent burden
- 908.0
Population outlook (Sonoma County) Hauer SSP2
- Today (2025)
- 539,935 people
- By 2030
- 554,870 · +2.8%
- By 2040
- 573,262 · +6.2%
- By 2050
- 580,715 · +7.6%
- By 2075
- 579,229 · +7.3%
- By 2100
- 547,835 · +1.5%
Race, ethnicity, and origin ACS 2023
- Neighborhood character
- Predominantly White (69%)
- Race & ethnicity
- White 69% Hispanic / Latino 18% Two or more races 11% Asian 7% Native American 1%
- Hispanic origin (detail)
- Mexican 15%
- Common ancestry
- Lithuanian 3% Scotch-Irish 3% Slovak 3%
- Foreign-born
- 14% · Canada, China, Vietnam
- Languages at home
- 79% English-only · Spanish 10% Other Indo-European 3% Chinese 2%
Political lean MEDSL · Sonoma
- 2024 margin
- Solid D (+46.2) · D 71.4% · R 25.2% · Other 3.3%
- 2008→2024 swing
- -3.4pp toward R · 2008: 49.6pp · 2024: 46.2pp
- All cycles
- 2024: D+46.2 2020: D+51.5 2016: D+47.9 2012: D+44.9 2008: D+49.6
Not yet ingested
- Civics
- —
Market trends
- HPI YoY
- ▼ -750.32%
- Current HPI
- 226.8795
- Rent YoY
- ▲ 3.28%
- Metro
- Santa Rosa-Petaluma, CA
- State GDP YoY
- ▲ 3.21%
- F500 in state
- 116
Industry mix (Fortune 500 HQ in CA)
| Industry | F500 HQs | Revenue |
|---|---|---|
| Technology | 27 | $1,492B |
|
||
| Financial Services | 3 | $174B |
|
||
| Retail | 3 | $44B |
|
||
| Insurance | 3 | $26B |
|
||
| Media / Entertainment | 2 | $115B |
|
||
| Pharmaceuticals / Biotech | 2 | $62B |
|
||
Price history
+6.5% since first listed25 events — show timeline
- 2026-05-06 Price Changed $180,000 BAREIS
- 2026-03-30 Listed $190,000 BAREIS
- 2026-02-13 Price Changed $199,000 BAREIS
- 2026-01-27 Price Changed $205,000 BAREIS
- 2026-01-21 Price Changed $210,000 BAREIS
- 2026-01-14 Price Changed $215,000 BAREIS
- 2026-01-05 Price Changed $220,000 BAREIS
- 2025-12-19 Price Changed $225,000 BAREIS
- 2025-12-12 Price Changed $227,500 BAREIS
- 2025-11-28 Price Changed $230,000 BAREIS
- 2025-11-15 Price Changed $232,000 BAREIS
- 2025-10-30 Price Changed $234,500 BAREIS
- 2025-10-19 Price Changed $236,500 BAREIS
- 2025-08-22 Listed $238,500 BAREIS
- 2025-07-30 Price Changed $239,500 BAREIS
- 2025-06-27 Listed $240,000 BAREIS
- 2021-10-22 Sold (MLS) $130,000 BAREIS
- 2021-09-29 Contingent — BAREIS
- 2021-09-05 Price Changed $145,000 BAREIS
- 2021-08-13 Price Changed $149,000 BAREIS
- 2021-08-03 Price Changed $155,000 BAREIS
- 2021-06-03 Price Changed $159,000 BAREIS
- 2021-04-30 Price Changed $163,000 BAREIS
- 2021-03-20 Relisted — BAREIS
- 2020-09-18 Listed $169,000 BAREIS
Property tax history
+5.1%/yrLatest (2025): $358 · -0.6% YoY. Source: county tax records.
Cash-flow waterfall
monthlySold comps — $/sqft
last 12 mo · ≤1 miLoading sold comps…