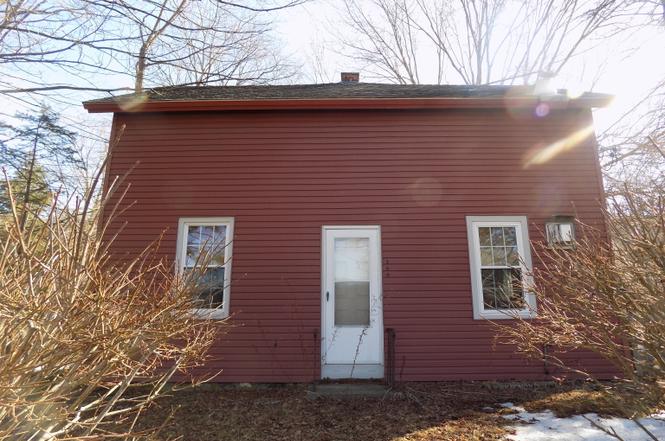
149 S Riverside Ave · Plymouth, CT
Flood risk 1/10 · Minimal
- FEMA flood zone
- —
- Chance of flooding over 30 yrs
- 0.0%
- Est. flood insurance / yr
- —
Fire risk 3/10 · Minor
- Est. fire insurance / yr
- $829 – $1,539
Heat risk 4/10 · Minor
- Hot days now (above 94°F)
- 7 days/yr
- Hot days in 30 yrs
- 17 days/yr
Wind risk 6/10 · Moderate
- Chance of severe wind over 30 yrs
- 27.0%
Air-quality risk 2/10 · Minimal
- Unhealthy air days now
- 1 days/yr
- Unhealthy air days in 30 yrs
- 1 days/yr
Risk factors via First Street. Map © Google.
Why this score? — see what drove the B grade
The composite is a weighted blend of 9 inputs, each scored 0–100. Each bar is that input's sub-score; the figure is the points it added to the 100-point composite (weight × sub-score).
- Cash flow +28.9/30.0
- DSCR +10.0/10.0
- 1% rule +9.0/10.0
- ARV discount +7.5/15.0
- Appreciation +5.0/10.0
- Schools +4.5/10.0
- Rent growth +2.5/5.0
- Livability +2.5/5.0
- Condition / age +2.5/5.0
$129,900
🖨 Deal sheet 📄 Offer letter ✓ Due diligence
Listing remarks
Calling all handy people. This home needs some updating to make it shine. Large kitchen dining area, living room, three bedrooms and bath. Newer roof. Nice rear yard. Well worth the effort.
Key facts
- Newer roof
- Nice rear yard
- 4,791 sq ft lot
Tags
Neighborhood map
What this means for you Summary
Snapshot
- This is a 2-bed/1.0-bath single-family listed at $130k.
Deal economics
- At list price, monthly cash flow is $440 ($5k/yr) — positive.
- The deal already cash-flows at list — no discount required.
- Meets the 1% rule at list price ($2k rent vs $130k).
- Recommended offer: $128k (1.5% below list) — sets the bar for market timing.
Location & tenants
- Location reads: area grade B — affects rentability + tenant quality, not the cash-flow math above.
- Plymouth School District (suburban): math 42% / reading 58% proficiency, ranked #78 of 153 in CT (top 51%) — acceptable for families but not a draw, mixed tenant base, ~2y average lease.
- Zoned schools: Terryville High School (math 44% / reading 64%, grade C-, #63 of 194 statewide, top 39%, 367 students, 43% FRL) — zoned schools average 43% FRL vs 22% district-wide (20 pts higher); higher-poverty schools than district average — tighter screening recommended.
- Market conditions: 2 active listings in the ZIP; 10 comparable units currently listed for rent nearby; rentals leasing fast (median 11d on market — plan ~1-2 weeks tenant-placement turnaround); 502 units permitted in Naugatuck Valley Planning Region in 2024 (171 in 5+ unit buildings).
Forward outlook
- In year one you build about $5k of equity ($898 loan paydown + $4k appreciation (3.0% local appreciation)).
- At projected returns (3.0% appreciation + 3.0% rent growth), your $36k cash investment doubles in ~4 years — after that, you're playing with house money.
- By year 7, paydown + projected appreciation supports a ~$30k cash-out refi (75% LTV) — recoverable capital for the next deal without selling this one.
Negotiation context
- It's been on market 19 days — a 2% lower offer ($128k) is reasonable based on typical stale-listing flexibility.
Risks & watch-outs
- Watch-outs: built in 1940 — expect roof / HVAC / electrical / plumbing capex.
- Climate carrying-cost: major wind risk, 27% chance of damaging wind over 30y — expect insurance premiums to compound above CPI over the hold.
Questions for the listing agent
- Built in 1940 — when were the roof, HVAC, electrical panel, plumbing, and water heater last replaced?
- Is there a deadline driving the sale (1031 exchange, divorce, estate, relocation)? That informs how much negotiation room exists.
- What's the average days-on-market for RENTAL listings here right now (not sales)? A rising rental-DOM trend means longer vacancies and softer asking-rent achievability than the comps imply.
- What's the recent tenant-quality profile in this submarket — average credit score on applications, eviction rate, late-payment / NSF rate, and stable-employment percentage? A property-management company in the area should have these aggregated.
- How much new for-sale + rental construction is in the pipeline within 1–3 miles? Heavy new supply typically softens prices + rents 12–24 months out; constrained supply supports both.
Investment metrics
- 1% rule
- 1.40% ✓
- Cap rate
- 10.36%
- Cash-on-cash
- 14.52%
- DSCR
- 1.65
- GRM
- 6.0
CMA / ARV
- ARV (on-the-fly)
- $278,760
- Comps found
- 2
Show comp detail 2 sales within ~0.75 mi
| Address | Dist | Beds/Ba | Sqft | Sold | Price | $/sf | Match |
|---|---|---|---|---|---|---|---|
| 33 Tunnel Rd | 0.27mi | 2/1.0 | 875 (-5%) | 18mo | $265,000 | $303 | 65 |
| 44 Old Waterbury Rd | 0.57mi | 3/1.5 (+1) | 1,008 (+10%) | 2mo | $300,000 | $298 | 49 |
Match score weights: distance 35% · size 25% · config 20% · recency 20%. Top-matched comps best support the ARV.
Projected returns pro-forma
3.0% appreciation · 3.0% rent growth · sell at horizon
- IRR
- 21.2%
- Equity multiple
- 2.20×
- Total profit
- $43,759
- Equity at exit
- $58,409
- IRR
- 22.3%
- Equity multiple
- 4.21×
- Total profit
- $116,645
- Equity at exit
- $90,015
Cash invested: $36,372 (down + closing). Projections, not guarantees.
Landlord ↔ Tenant lean methodology
- Overall (STATE)
- 27 Tenant-Leaning
- State Connecticut
- 27 Tenant-Leaning · D+7
- County
- — inherits STATE
- City
- — inherits STATE
ZIP-level market 06781
- Active inventory
- 2
- Price-to-rent
- 6.0×
Monthly cashflow live
- Estimated rent
- $1,816 high interval (Pro) →
- Mortgage (P&I)
- −$681
- Tax from tax record
- −$260 /mo · $3,114/yr
- Insurance
- −$54
- HOA
- −$0
- Vacancy / Maint / Mgmt
- −$381
- Net cashflow
- $440
Break-even live
UW: 25.0% down · 7.5% · 30yr · 1.5% tax · 5.0% vac · 8.0% maint · 8.0% mgmt
Financing live
Cash to close
- Down payment
- $32,475
- Closing costs
- $3,897
- Reserves months
- —
- Total cash needed
- —
Loan-product check · same deal, 3 products live
Conventional
25% down · 7.5% · 30yr
- Down + closing
- —
- Monthly P&I
- —
- Monthly cashflow
- —
- DSCR
- —
- Eligible?
- —
Personal DTI + credit; lowest rate.
DSCR
20% down · 8.5% · 30yr
- Down + closing
- —
- Monthly P&I
- —
- Monthly cashflow
- —
- DSCR
- —
- Eligible?
- —
No personal income docs; deal must DSCR.
Hard money
10% down · 12.0% · 12mo
- Down + closing
- —
- Monthly P&I
- —
- Monthly cashflow
- —
- DSCR
- —
- Eligible?
- —
Short-term bridge; refi at stabilization.
Rent comps 10 comps
| Address | Beds | Baths | Sqft | Rent | $/sqft | DOM | Units | Dist |
|---|---|---|---|---|---|---|---|---|
| 11 Roosevelt Ave Terryville, CT | 2.0 | 1.0 | 700 | $1,550 | $2.21 | 44d | 1 | 0.65mi |
| 3 Pearl St Unit 3 Terryville, CT | 2.0 | 1.0 | 930 | $1,450 | $1.56 | 24d | 1 | 0.71mi |
| 8 Burnham St Unit 2A Terryville, CT | 3.0 | 1.0 | 1100 | $2,495 | $2.27 | 2d | 1 | 0.74mi |
| 11 Burnham St Unit 5 Terryville, CT | 1.0 | 1.0 | 626 | $1,100 | $1.76 | 24d | 1 | 0.76mi |
| 34 S Main St Unit 3 Terryville, CT | 2.0 | 1.0 | 1000 | $1,600 | $1.60 | 3d | 1 | 1.04mi |
| 115 N Main St Unit 3rd Floor Terryville, CT | 2.0 | 1.0 | 687 | $1,450 | $2.11 | 2d | 1 | 1.14mi |
| 193 Newell Ave Unit 2nd Floor Bristol, CT | 2.0 | 1.0 | 1000 | $1,950 | $1.95 | 10d | 1 | 1.24mi |
| 174 Newell Ave Bristol, CT | 3.0 | 1.0 | 1100 | $3,000 | $2.73 | 10d | 1 | 1.24mi |
| 171 Newell Ave Bristol, CT | 3.0 | 1.0 | 1040 | $2,300 | $2.21 | 2d | 1 | 1.26mi |
| 282 Main St Terryville, CT | 2.0 | 1.0 | 900 | $1,650 | $1.83 | 2d | 1 | 1.43mi |
Listing history 8 events
-
2026-06-18days on market $129,900 Active 19 DOM
-
2026-06-17days on market $129,900 Active 18 DOM
-
2026-06-16days on market $129,900 Active 17 DOM
-
2026-06-15days on market $129,900 Active 16 DOM
-
2026-06-13days on market $129,900 Active 14 DOM
-
2026-06-13statusdays on market $129,900 Active 13 DOM
-
2026-03-23status Under Contract
-
2026-03-11$129,900 Active
ⓘ Source: listings_history table (triggers on properties + properties_extension) + one-shot
backfill from property_details.listing_events for pre-trigger history.
Tax reassessment forecast CT · Partial reset (capped growth)
- Current annual tax
- $3,114 · $260/mo
- Projected year-2 tax
- $3,114 · $260/mo
- Expected delta
- $0/yr ($0/mo · 0.0%)
ⓘ Screening estimate from a state-policy table — verify with the county assessor before closing.
Climate risk First Street
- Flood 1/10 Low 0% chance over 30 yrs
- Wildfire 3/10 Moderate
- Heat 4/10 Moderate 7 d/yr ≥94°F today · 17 d/yr by 30 yrs out
- Wind 6/10 Major 27% chance of damaging wind over 30 yrs
- Air quality 2/10 Low 1 unhealthy d/yr today · 1 by 30 yrs out
Nearby sold comps map
Loading sold comps map…
Walkable amenities ~0.75 mi
Loading nearby amenities…
Taxation est. · year 1
- Rental income
- $21,795
- − Mortgage interest
- −$7,276
- − Property taxes
- −$3,114
- − Insurance
- −$650
- − Repairs & maintenance
- −$1,744
- − Management
- −$1,744
- − Depreciation
- −$3,779
- Taxable income
- $3,489
- Est. tax owed @ 24.0%
- −$837
- After-tax cash flow
- $4,443/yr
For passive investors: Depreciation is non-cash, so a rental often shows a tax loss while cash-flowing — sheltering income. Rental losses are passive: they offset passive income freely, and up to $25,000/yr can offset ordinary (W-2) income if you actively participate and your MAGI is under $100k (phasing out to $0 by $150k); unused losses carry forward. On sale, claimed depreciation is recaptured at up to 25%, and gains may owe capital-gains tax (a 1031 exchange can defer both). Figures are a year-1 estimate at your 24.0% rate — not tax advice; consult a CPA.
Schools (NCES district)
- District
- Plymouth School District
- NCES district ID
- 0903330
- Math proficiency
- 42% ▼ -10.00%
- Reading proficiency
- 58% ▼ -2.00%
- Median HH income
- $71,517
- Composite
- 44.78/100
- National rank
- #2743
- State rank
- #78 of 153 in CT
Livability — Plymouth
No livability data for this city. (Only ~50 U.S. cities are tracked.)
Census & demographics
- Census place
- Terryville, CT
Population outlook (Naugatuck Valley County) Hauer SSP2
- By 2040
- 496,846
Not yet ingested
- Political lean
- —
- Race & ethnicity
- —
- Common origin
- —
- Civics
- —
Market trends
- HPI YoY
- —
- Current HPI
- —
- Rent YoY
- —
- Metro
- —
- State GDP YoY
- ▲ 1.06%
- F500 in state
- 38
Industry mix (Fortune 500 HQ in CT)
| Industry | F500 HQs | Revenue |
|---|---|---|
| Industrial Machinery | 4 | $38B |
|
||
| Insurance | 3 | $71B |
|
||
| Financial Services | 2 | $25B |
|
||
| Transportation / Logistics | 2 | $18B |
|
||
| Healthcare | 1 | $247B |
|
||
| Telecommunications | 1 | $55B |
|
||
Price history
2 events — show timeline
- 2026-03-23 Pending — Smart MLS
- 2026-03-11 Listed $129,900 Smart MLS
Property tax history
+2.5%/yrLatest (2023): $3,114 · +3.8% YoY. Source: county tax records.
Cash-flow waterfall
monthlySold comps — $/sqft
last 12 mo · ≤1 miLoading sold comps…