3615 Delancy St · Greensboro, NC
Flood risk 1/10 · Minimal
- FEMA flood zone
- X (unshaded)
- Chance of flooding over 30 yrs
- 0.0%
- Est. flood insurance / yr
- $507 – $1,088
Fire risk 1/10 · Minimal
- Est. fire insurance / yr
- $906 – $1,684
Heat risk 6/10 · Moderate
- Hot days now (above 103°F)
- 7 days/yr
- Hot days in 30 yrs
- 18 days/yr
Wind risk 4/10 · Minor
- Chance of severe wind over 30 yrs
- 15.0%
Air-quality risk 2/10 · Minimal
- Unhealthy air days now
- 1 days/yr
- Unhealthy air days in 30 yrs
- 2 days/yr
Risk factors via First Street. Map © Google.
Why this score? — see what drove the B- grade
The composite is a weighted blend of 9 inputs, each scored 0–100. Each bar is that input's sub-score; the figure is the points it added to the 100-point composite (weight × sub-score).
- Cash flow +30.0/30.0
- DSCR +10.0/10.0
- 1% rule +8.6/10.0
- ARV discount +7.5/15.0
- Livability +4.0/5.0
- Schools +3.6/10.0
- Rent growth +3.5/5.0
- Condition / age +2.5/5.0
- Appreciation +0.0/10.0
$85,000
🖨 Deal sheet 📄 Offer letter ✓ Due diligence
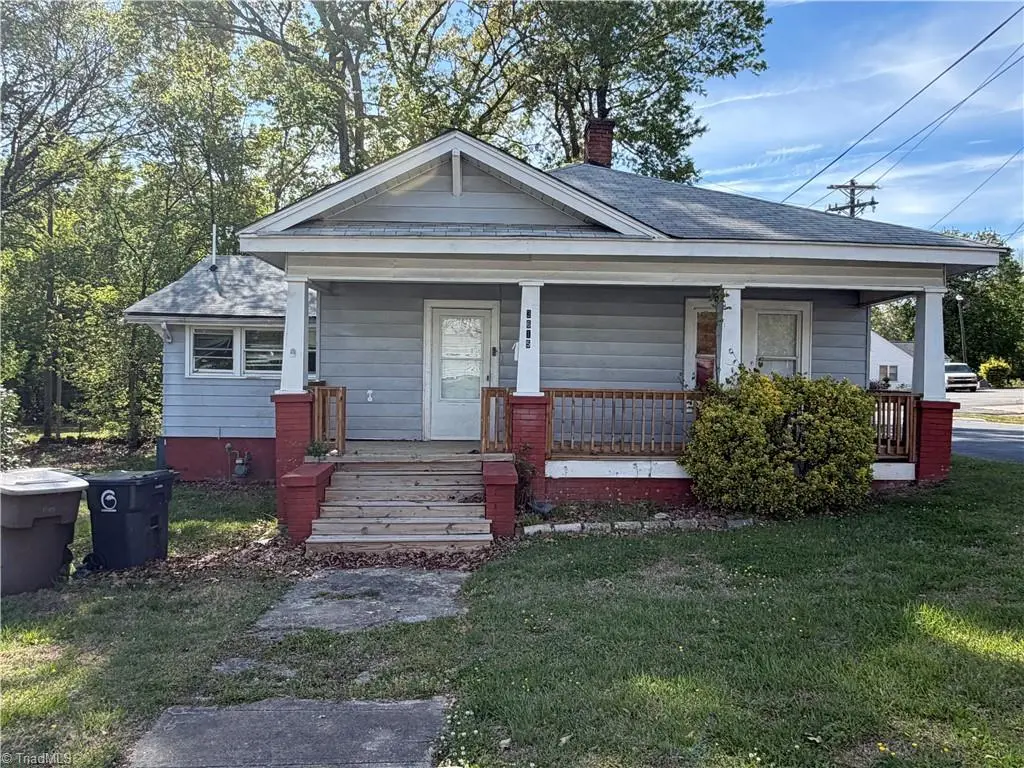
Listing remarks
2 bedroom, 1 bathroom house on corner lot. Needs TLC
Key facts
- 0.24 acre lot
- Built 1927
- Listed 11 days
Property features AI
Finance
- Other: Publicly maintained road access
- HOA & community: No homeowners association
Exterior
- Parking: Driveway parking
- Utilities: Public water; Public sewer; Electric water heater
- Home design: Residential stick/site-built house; One-story; Built in 1927; Existing structure
- Construction: Vinyl siding; Crawl space foundation
- Exterior features: City lot
Interior
- Kitchen: Kitchen on the main level; Electric water heater
- Bedrooms: Bedrooms located on the main level
- Bathrooms: 1 full bathroom
- Heating & cooling: Central air conditioning; Forced air heating using natural gas
- Interior features: Primary bedroom located on the main level
- Laundry & utility: Washer/dryer location not specified
Neighborhood map
What this means for you Summary
Snapshot
- This is a 2-bed/1.0-bath single-family listed at $85k.
Deal economics
- At list price, monthly cash flow is $357 ($4k/yr) — positive.
- The deal already cash-flows at list — no discount required.
- Meets the 1% rule at list price ($1k rent vs $85k).
- Cap rate 11.3% vs local median 3.8% in Greensboro — top-decile yield for the area; either an underpriced asset or a hidden risk that comps aren't pricing in. Stress-test before assuming the spread holds.
Location & tenants
- Location reads 81/100 on livability (#12 in NC, #1,335 nationally) — a professional / high-income tenant draw. Strengths: amenities A+, commute A+, cost of living A+; Watch: employment D, crime F.
- Guilford County Schools (urban): math 39% / reading 45% proficiency, ranked #99 of 178 in NC (top 56%) — families likely to look elsewhere, expect single-tenant / working-renter base with shorter leases.
- Market conditions: Rents rising (+3.8%/yr); 381 active listings in the ZIP; 34 comparable units currently listed for rent nearby; rentals at typical pace (median 23d on market — plan ~3-4 weeks tenant-placement turnaround); 3,843 units permitted in Guilford County in 2024 (2,397 in 5+ unit buildings).
Forward outlook
- Local home prices are declining (-3.0%/yr); year-one equity from $588 of loan paydown is wiped out by about $3k of value loss. Plan a longer hold.
- Guilford County population projected at +26% by 2050 — long-run rental-demand tailwind backs the buy-and-hold thesis.
- At projected returns (-3.0% appreciation + 3.8% rent growth), your $24k cash investment doubles in ~7 years — after that, you're playing with house money.
Negotiation context
- Only 11 days on market — expect competitive offers; lowballing is unlikely to land.
- 2 sale attempts with the ask held roughly flat each time — persistent listings suggest the price (not the market) is what's stuck; bring a comps-based counter.
Risks & watch-outs
- Watch-outs: built in 1927 — expect roof / HVAC / electrical / plumbing capex.
- Climate carrying-cost: extreme-heat days projected 7→18/yr by 2055 (HVAC capex compounding) — expect insurance premiums to compound above CPI over the hold.
Questions for the listing agent
- Built in 1927 — when were the roof, HVAC, electrical panel, plumbing, and water heater last replaced?
- Is there a deadline driving the sale (1031 exchange, divorce, estate, relocation)? That informs how much negotiation room exists.
- Crime grade is F in this area — have there been break-ins, vandalism, or insurance claims at this property in the last 3 years? What carrier currently insures it and at what premium?
- What's the average days-on-market for RENTAL listings here right now (not sales)? A rising rental-DOM trend means longer vacancies and softer asking-rent achievability than the comps imply.
- What's the recent tenant-quality profile in this submarket — average credit score on applications, eviction rate, late-payment / NSF rate, and stable-employment percentage? A property-management company in the area should have these aggregated.
- How much new for-sale + rental construction is in the pipeline within 1–3 miles? Heavy new supply typically softens prices + rents 12–24 months out; constrained supply supports both.
Investment metrics
- 1% rule
- 1.36% ✓
- Cap rate
- 11.34%
- Cash-on-cash
- 18.01%
- DSCR
- 1.80
- GRM
- 6.1
CMA / ARV
- ARV (on-the-fly)
- $179,496
- Comps found
- 12
Show comp detail 12 sales within ~0.75 mi
| Address | Dist | Beds/Ba | Sqft | Sold | Price | $/sf | Match |
|---|---|---|---|---|---|---|---|
| 612 Willard St | 0.15mi | 3/1.0 (+1) | 1,084 (-2%) | 2mo | $122,500 | $113 | 83 |
| 3615 Delancy St | 0.00mi | 2/1.0 | 1,228 (+11%) | 1mo | $85,000 | $69 | 81 |
| 3311 Beck St | 0.15mi | 2/1.0 | 1,014 (-8%) | 7mo | $128,700 | $127 | 73 |
| 809 Sykes Ave | 0.32mi | 3/1.0 (+1) | 1,126 (+2%) | 7mo | $182,000 | $162 | 71 |
| 2805 Kentwood St | 0.45mi | 3/1.5 (+1) | 1,102 (-0%) | 1mo | $195,000 | $177 | 70 |
| 701 Lowdermilk St | 0.56mi | 3/1.0 (+1) | 1,124 (+1%) | 8mo | $172,500 | $153 | 60 |
| 702 Sykes Ave | 0.23mi | 3/2.5 (+1) | 1,206 (+9%) | 11mo | $190,000 | $158 | 54 |
| 303 W Camel St | 0.74mi | 2/2.0 | 1,058 (-4%) | 5mo | $195,000 | $184 | 50 |
| 4004 Wooddale Ln | 0.67mi | 3/1.0 (+1) | 983 (-11%) | 1mo | $138,000 | $140 | 44 |
| 1209 Willard St | 0.68mi | 3/2.5 (+1) | 1,150 (+4%) | 9mo | $229,900 | $200 | 43 |
| 213 Guerrant St | 0.39mi | 3/2.0 (+1) | 1,260 (+14%) | 10mo | $235,000 | $187 | 42 |
| 2128 Textile Dr | 0.70mi | 3/2.0 (+1) | 1,040 (-6%) | 12mo | $188,800 | $182 | 38 |
Match score weights: distance 35% · size 25% · config 20% · recency 20%. Top-matched comps best support the ARV.
Projected returns pro-forma
-3.0% appreciation · 3.83% rent growth · sell at horizon
- IRR
- 10.5%
- Equity multiple
- 1.42×
- Total profit
- $9,947
- Equity at exit
- $12,674
- IRR
- 20.2%
- Equity multiple
- 2.76×
- Total profit
- $41,996
- Equity at exit
- $7,349
Cash invested: $23,800 (down + closing). Projections, not guarantees.
Landlord ↔ Tenant lean methodology
- Overall (STATE)
- 85 Strongly Landlord-Friendly
- State North Carolina
- 85 Strongly Landlord-Friendly · R+3
- County
- — inherits STATE
- City
- — inherits STATE
ZIP-level market 27405
- Home prices YoY
- -20.6%
- Rents YoY
- 3.8%
- Active inventory
- 381
- Price-to-rent
- 6.1×
Monthly cashflow live
- Estimated rent
- $1,152 high interval (Pro) →
- Mortgage (P&I)
- −$446
- Tax from tax record
- −$72 /mo · $863/yr
- Insurance
- −$35
- HOA
- −$0
- Vacancy / Maint / Mgmt
- −$242
- Net cashflow
- $357
Break-even live
UW: 25.0% down · 7.5% · 30yr · 1.5% tax · 5.0% vac · 8.0% maint · 8.0% mgmt
Financing live
Cash to close
- Down payment
- $21,250
- Closing costs
- $2,550
- Reserves months
- —
- Total cash needed
- —
Loan-product check · same deal, 3 products live
Conventional
25% down · 7.5% · 30yr
- Down + closing
- —
- Monthly P&I
- —
- Monthly cashflow
- —
- DSCR
- —
- Eligible?
- —
Personal DTI + credit; lowest rate.
DSCR
20% down · 8.5% · 30yr
- Down + closing
- —
- Monthly P&I
- —
- Monthly cashflow
- —
- DSCR
- —
- Eligible?
- —
No personal income docs; deal must DSCR.
Hard money
10% down · 12.0% · 12mo
- Down + closing
- —
- Monthly P&I
- —
- Monthly cashflow
- —
- DSCR
- —
- Eligible?
- —
Short-term bridge; refi at stabilization.
Rent comps 34 comps
| Address | Beds | Baths | Sqft | Rent | $/sqft | DOM | Units | Dist |
|---|---|---|---|---|---|---|---|---|
| 309 Holt Ave Greensboro, NC | 2.0 | 1.0 | 1000 | $1,175 | $1.18 | 23d | 1 | 0.15mi |
| 3320 Beck St Greensboro, NC | 1.0 | 1.0 | 1100 | $800 | $0.73 | 23d | 1 | 0.16mi |
| 610 Holt Ave Greensboro, NC | 2.0 | 1.0 | 1092 | $1,300 | $1.19 | 14d | 1 | 0.16mi |
| 3301 Beck St Greensboro, NC | 1.0 | 1.0 | 1000 | $800 | $0.80 | 23d | 1 | 0.18mi |
| 3314 Beck St Greensboro, NC | 1.0 | 1.0 | 1100 | $950 | $0.86 | 23d | 1 | 0.19mi |
| 703 Sykes Ave Greensboro, NC | 2.0 | 1.0 | 923 | $1,295 | $1.40 | 23d | 1 | 0.24mi |
| 2509 Pinnix St Unit B Greensboro, NC | 3.0 | 2.0 | 860 | $995 | $1.16 | 23d | 1 | 0.32mi |
| 810 Elwell Ave Greensboro, NC | 3.0 | 2.0 | 1280 | $1,500 | $1.17 | 14d | 1 | 0.42mi |
| 311 Guerrant St Greensboro, NC | 3.0 | 1.0 | 1025 | $1,295 | $1.26 | 23d | 1 | 0.48mi |
| 3900 Hahns Ln Greensboro, NC | 2.0 | 1.0 | 880 | $955 | $1.09 | 14d | 8 | 0.68mi |
| 1608 McPherson St Greensboro, NC | 3.0 | 2.0 | 1100 | $1,450 | $1.32 | 23d | 1 | 0.82mi |
| 110 S Raleigh St Greensboro, NC | 3.0 | 1.0 | 1000 | $1,200 | $1.20 | 23d | 1 | 0.83mi |
| 112 S Raleigh St Greensboro, NC | 3.0 | 1.0 | 1000 | $1,200 | $1.20 | 23d | 1 | 0.83mi |
| 4214 Kildare Dr Greensboro, NC | 3.0 | 1.5 | 1329 | $1,450 | $1.09 | 23d | 1 | 0.87mi |
| 4216 Parker St Unit C Greensboro, NC | 2.0 | 1.0 | 800 | $825 | $1.03 | 21d | 1 | 0.88mi |
| 209 Woodnell St Unit H Greensboro, NC | 2.0 | 1.0 | 750 | $975 | $1.30 | 18d | 1 | 0.91mi |
| 1622 Mcpherson St Unit 1912 Greensboro, NC | 2.0 | 1.0 | 860 | $850 | $0.99 | 23d | 1 | 0.94mi |
| 210 Woodnell St Unit G Greensboro, NC | 2.0 | 1.0 | 750 | $975 | $1.30 | 23d | 1 | 0.96mi |
| 2011 Lutheran St Greensboro, NC | 2.0 | 1.0 | 800 | $985 | $1.23 | 23d | 1 | 0.97mi |
| 1504 Autumn Dr Unit A Greensboro, NC | 2.0 | 1.0 | 820 | $895 | $1.09 | 23d | 1 | 1.00mi |
| 1604 Textile Dr Greensboro, NC | 2.0 | 1.0 | 930 | $1,245 | $1.34 | 23d | 1 | 1.01mi |
| 129 Aunt Mary Ave Unit A Greensboro, NC | 2.0 | 1.0 | 800 | $950 | $1.19 | 23d | 1 | 1.01mi |
| 306 Murraylane Rd Greensboro, NC | 3.0 | 2.0 | 1330 | $1,815 | $1.36 | 14d | 1 | 1.03mi |
| 1508 Tucker St Greensboro, NC | 2.0 | 2.0 | 875 | $1,195 | $1.37 | 23d | 1 | 1.03mi |
| 1603 Autumn Dr Apt A Greensboro, NC | 2.0 | 1.0 | 820 | $925 | $1.13 | 14d | 1 | 1.05mi |
| 201 Huffman St Greensboro, NC | 3.0 | 2.0 | 1350 | $1,000 | $0.74 | 14d | 1 | 1.08mi |
| 4302 Belfield Dr Greensboro, NC | 3.0 | 2.0 | 1300 | $1,755 | $1.35 | 23d | 1 | 1.14mi |
| 522 Banner Ave Greensboro, NC | 3.0 | 2.0 | 822 | $1,600 | $1.95 | 23d | 1 | 1.18mi |
| 600 Banner Ave Unit 614-B Greensboro, NC | 2.0 | 1.5 | 850 | $850 | $1.00 | 23d | 1 | 1.22mi |
| 8 Kings Forest Ct Greensboro, NC | 3.0 | 2.0 | 1120 | $1,650 | $1.47 | 23d | 1 | 1.22mi |
| 2001 Spencer St Greensboro, NC | 2.0 | 1.0 | 720 | $1,295 | $1.80 | 23d | 1 | 1.24mi |
| 403 S O Henry Blvd Unit Alexander Homes Greensboro, NC | 2.0 | 1.0 | 860 | $875 | $1.02 | 23d | 1 | 1.35mi |
| 1703 10th St Unit A Greensboro, NC | 3.0 | 1.0 | 864 | $1,075 | $1.24 | 23d | 1 | 1.38mi |
| 503 S O Henry Blvd Greensboro, NC | 2.0 | 1.0 | 860 | $850 | $0.99 | 23d | 1 | 1.39mi |
Listing history 3 events
-
2026-05-24status Pending
-
2026-05-12Due Diligence Period
-
2026-05-12$85,000
ⓘ Source: listings_history table (triggers on properties + properties_extension) + one-shot
backfill from property_details.listing_events for pre-trigger history.
Tax reassessment forecast NC · Resets to sale price
- Current annual tax
- $863 · $72/mo
- Projected year-2 tax
- $863 · $72/mo
- Expected delta
- $0/yr ($0/mo · 0.0%)
ⓘ Screening estimate from a state-policy table — verify with the county assessor before closing.
Climate risk First Street
- Flood 1/10 Low FEMA zone X (unshaded) · 0% chance over 30 yrs
- Wildfire 1/10 Low
- Heat 6/10 Major 7 d/yr ≥103°F today · 18 d/yr by 30 yrs out
- Wind 4/10 Moderate 15% chance of damaging wind over 30 yrs
- Air quality 2/10 Low 1 unhealthy d/yr today · 2 by 30 yrs out
Nearby sold comps map
Loading sold comps map…
Walkable amenities ~0.75 mi
Loading nearby amenities…
Taxation est. · year 1
- Rental income
- $13,827
- − Mortgage interest
- −$4,761
- − Property taxes
- −$863
- − Insurance
- −$425
- − Repairs & maintenance
- −$1,106
- − Management
- −$1,106
- − Depreciation
- −$2,473
- Taxable income
- $3,093
- Est. tax owed @ 24.0%
- −$742
- After-tax cash flow
- $3,545/yr
For passive investors: Depreciation is non-cash, so a rental often shows a tax loss while cash-flowing — sheltering income. Rental losses are passive: they offset passive income freely, and up to $25,000/yr can offset ordinary (W-2) income if you actively participate and your MAGI is under $100k (phasing out to $0 by $150k); unused losses carry forward. On sale, claimed depreciation is recaptured at up to 25%, and gains may owe capital-gains tax (a 1031 exchange can defer both). Figures are a year-1 estimate at your 24.0% rate — not tax advice; consult a CPA.
Schools (NCES district)
- District
- Guilford County Schools
- NCES district ID
- 3701920
- Math proficiency
- 39% ▲ 1.00%
- Reading proficiency
- 45% ▲ 1.00%
- Median HH income
- $46,315
- Composite
- 35.78/100
- National rank
- #4842
- State rank
- #99 of 178 in NC
Livability — Greensboro
- Score
- 81/100
- State rank
- #12
- US rank
- #1335
Category grades
Schools grade is shown separately in the Schools card above.
Census & demographics
- Census place
- Greensboro, NC
- County
- Guilford County · 487,190 people
- City population
- 329,421
- Metro
- Greensboro-High Point, NC
- Population (ZIP)
- 54,303
- Household income
- $47,431
- Rent vs Own
- Severe rent burden
- 2517.0
Population outlook (Guilford County) Hauer SSP2
- Today (2025)
- 584,596 people
- By 2030
- 616,851 · +5.5%
- By 2040
- 678,451 · +16.1%
- By 2050
- 734,788 · +25.7%
- By 2075
- 862,985 · +47.6%
- By 2100
- 948,704 · +62.3%
Race, ethnicity, and origin ACS 2023
- Neighborhood character
- Diverse neighborhood (Simpson 0.62)
- Race & ethnicity
- Black 57% White 20% Hispanic / Latino 14% Two or more races 7% Asian 4%
- Hispanic origin (detail)
- Mexican 9% Puerto Rican 2%
- Common ancestry
- Romanian 1% Ukrainian 1% Italian 1%
- Foreign-born
- 15% · Canada, Vietnam, China
- Languages at home
- 79% English-only · Spanish 11% Other Asian/Pacific 2% Other Indo-European 1%
Political lean MEDSL · Guilford
- 2024 margin
- Strong D (+21.8) · D 60.2% · R 38.4% · Other 1.4%
- 2008→2024 swing
- +3.5pp toward D · 2008: 18.4pp · 2024: 21.8pp
- All cycles
- 2024: D+21.8 2020: D+23.1 2016: D+20.0 2012: D+16.5 2008: D+18.4
Not yet ingested
- Civics
- —
Market trends
- HPI YoY
- ▼ -63.02%
- Current HPI
- 243.1261
- Rent YoY
- ▲ 3.83%
- Metro
- Greensboro-High Point, NC
- State GDP YoY
- ▲ 3.28%
- F500 in state
- 26
Industry mix (Fortune 500 HQ in NC)
| Industry | F500 HQs | Revenue |
|---|---|---|
| Financial Services | 2 | $213B |
|
||
| Retail | 2 | $95B |
|
||
| Industrial Conglomerate | 1 | $38B |
|
||
| Metals / Steel | 1 | $35B |
|
||
| Utilities | 1 | $30B |
|
||
| Industrial Machinery | 1 | $19B |
|
||
Price history
3 events — show timeline
- 2026-05-24 Pending — Triad MLS
- 2026-05-12 Listed — Triad MLS
- 2026-05-12 Listed $85,000 Triad MLS
Property tax history
+1.5%/yrLatest (2025): $863 · +0.0% YoY. Source: county tax records.
Cash-flow waterfall
monthlySold comps — $/sqft
last 12 mo · ≤1 miLoading sold comps…