900 N Idaho St Unit 107 · Post Falls, ID
Flood risk No data
- FEMA flood zone
- —
- Chance of flooding over 30 yrs
- —
- Est. flood insurance / yr
- —
Fire risk No data
- Est. fire insurance / yr
- —
Heat risk No data
- Hot days now (above threshold)
- —
- Hot days in 30 yrs
- —
Wind risk No data
- Chance of severe wind over 30 yrs
- —
Air-quality risk No data
- Unhealthy air days now
- —
- Unhealthy air days in 30 yrs
- —
Risk factors via First Street. Map © Google.
Why this score? — see what drove the B grade
The composite is a weighted blend of 9 inputs, each scored 0–100. Each bar is that input's sub-score; the figure is the points it added to the 100-point composite (weight × sub-score).
- Cash flow +30.0/30.0
- 1% rule +10.0/10.0
- DSCR +10.0/10.0
- ARV discount +7.5/15.0
- Livability +4.4/5.0
- Schools +4.2/10.0
- Rent growth +2.9/5.0
- Condition / age +2.5/5.0
- Appreciation +0.0/10.0
$95,000
🖨 Deal sheet 📄 Offer letter ✓ Due diligence
Listing remarks MLS
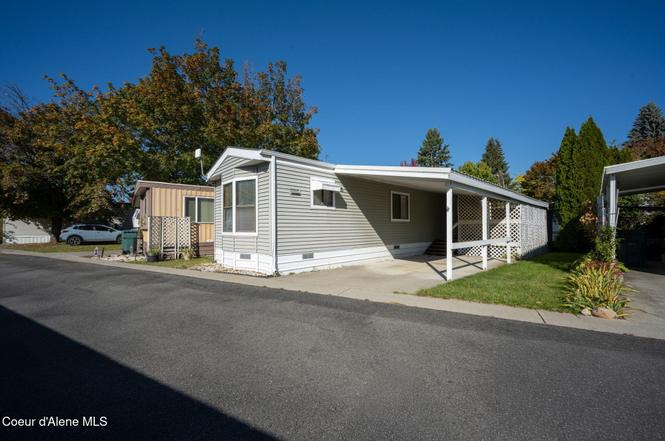
Well maintained, very clean, Single Wide located in River City Village, a 55 + Community, Covered Porch, Vaulted Ceilings, Breakfast Bar, Central Air, Gas forced air. Large Shed. Quiet street, Walking distance to shopping.
Key facts
- Garage
- Built 1991
- Listed 52 days
Neighborhood map
What this means for you Summary
Snapshot
- This is a 2-bed/1.0-bath manufactured listed at $95k.
Deal economics
- At list price, monthly cash flow is $577 ($7k/yr) — positive.
- The deal already cash-flows at list — no discount required.
- Meets the 1% rule at list price ($2k rent vs $95k).
- Recommended offer: $92k (3.0% below list) — sets the bar for market timing.
- Cap rate 13.6% vs local median 2.2% in Post Falls — top-decile yield for the area; either an underpriced asset or a hidden risk that comps aren't pricing in. Stress-test before assuming the spread holds.
Location & tenants
- Location reads 88/100 on livability (#1 in ID, #198 nationally) — a professional / high-income tenant draw. Strengths: crime A+, commute A+, housing A+.
- Post Falls District (suburban): math 43% / reading 56% proficiency, ranked #31 of 92 in ID (top 34%) — families likely to look elsewhere, expect single-tenant / working-renter base with shorter leases.
- Market conditions: Rents rising (+1.5%/yr); 625 active listings in the ZIP; 17 comparable units currently listed for rent nearby; rentals leasing fast (median 13d on market — plan ~1-2 weeks tenant-placement turnaround); solid renter incomes; 1,606 units permitted in Kootenai County in 2024 (154 in 5+ unit buildings).
Forward outlook
- Local home prices are declining (-3.0%/yr); year-one equity from $657 of loan paydown is wiped out by about $3k of value loss. Plan a longer hold.
- Kootenai County population projected at +33% by 2050 — long-run rental-demand tailwind backs the buy-and-hold thesis.
- At projected returns (-3.0% appreciation + 1.5% rent growth), your $27k cash investment doubles in ~5 years — after that, you're playing with house money.
Negotiation context
- It's been on market 53 days — a 3% lower offer ($92k) is reasonable based on typical stale-listing flexibility.
- 5 sale attempts since 10y ago with the ask held roughly flat each time — persistent listings suggest the price (not the market) is what's stuck; bring a comps-based counter.
Questions for the listing agent
- It's been on market 53 days. Have you received any prior offers? Is the seller open to a 3% concession, seller financing, or rate buy-down credit?
- Is there a deadline driving the sale (1031 exchange, divorce, estate, relocation)? That informs how much negotiation room exists.
- What's the average days-on-market for RENTAL listings here right now (not sales)? A rising rental-DOM trend means longer vacancies and softer asking-rent achievability than the comps imply.
- What's the recent tenant-quality profile in this submarket — average credit score on applications, eviction rate, late-payment / NSF rate, and stable-employment percentage? A property-management company in the area should have these aggregated.
- How much new for-sale + rental construction is in the pipeline within 1–3 miles? Heavy new supply typically softens prices + rents 12–24 months out; constrained supply supports both.
Investment metrics
- 1% rule
- 1.64% ✓
- Cap rate
- 13.58%
- Cash-on-cash
- 26.04%
- DSCR
- 2.16
- GRM
- 5.1
CMA / ARV
No comps found within radius.
Projected returns pro-forma
-3.0% appreciation · 1.46% rent growth · sell at horizon
- IRR
- 18.0%
- Equity multiple
- 1.71×
- Total profit
- $19,010
- Equity at exit
- $14,165
- IRR
- 25.3%
- Equity multiple
- 3.05×
- Total profit
- $54,507
- Equity at exit
- $8,214
Cash invested: $26,600 (down + closing). Projections, not guarantees.
Landlord ↔ Tenant lean methodology
- Overall (STATE)
- 91 Strongly Landlord-Friendly
- State Idaho
- 91 Strongly Landlord-Friendly · R+18
- County
- — inherits STATE
- City
- — inherits STATE
ZIP-level market 83854
- Rents YoY
- 1.5%
- Active inventory
- 625
- Price-to-rent
- 5.1×
Monthly cashflow live
- Estimated rent
- $1,562 high interval (Pro) →
- Mortgage (P&I)
- −$498
- Tax est. 1.5%
- −$119 /mo · $1,425/yr
- Insurance
- −$40
- HOA
- −$0
- Vacancy / Maint / Mgmt
- −$328
- Net cashflow
- $577
Break-even live
UW: 25.0% down · 7.5% · 30yr · 1.5% tax · 5.0% vac · 8.0% maint · 8.0% mgmt
Financing live
Cash to close
- Down payment
- $23,750
- Closing costs
- $2,850
- Reserves months
- —
- Total cash needed
- —
Loan-product check · same deal, 3 products live
Conventional
25% down · 7.5% · 30yr
- Down + closing
- —
- Monthly P&I
- —
- Monthly cashflow
- —
- DSCR
- —
- Eligible?
- —
Personal DTI + credit; lowest rate.
DSCR
20% down · 8.5% · 30yr
- Down + closing
- —
- Monthly P&I
- —
- Monthly cashflow
- —
- DSCR
- —
- Eligible?
- —
No personal income docs; deal must DSCR.
Hard money
10% down · 12.0% · 12mo
- Down + closing
- —
- Monthly P&I
- —
- Monthly cashflow
- —
- DSCR
- —
- Eligible?
- —
Short-term bridge; refi at stabilization.
Rent comps 17 comps
| Address | Beds | Baths | Sqft | Rent | $/sqft | DOM | Units | Dist |
|---|---|---|---|---|---|---|---|---|
| 1170 E Mullan Ave #203 Post Falls, ID | 1.0 | 1.0 | 800 | $1,495 | $1.87 | 21d | 1 | 0.23mi |
| 910 E 4th Ave Post Falls, ID | 1.0–3.0 | 1.0–2.0 | 884 | $1,635 | $1.85 | 13d | 8 | 0.44mi |
| 1124 E 4th Ave Post Falls, ID | 3.0 | 1.0–2.0 | 870 | $1,688 | $1.94 | 13d | 17 | 0.53mi |
| 117 E 14th Ave Unit 4 Post Falls, ID | 2.0 | 1.0 | 1000 | $1,295 | $1.29 | 13d | 1 | 0.58mi |
| 310 E Railroad Ave Unit E101 Post Falls, ID | 2.0 | 2.0 | 1005 | $1,630 | $1.62 | 13d | 1 | 0.60mi |
| 312 E Railroad Ave Post Falls, ID | 1.0–2.0 | 1.0–2.0 | 966 | $1,630 | $1.69 | 13d | 3 | 0.61mi |
| 306 E Railroad Ave Unit D202 Post Falls, ID | 2.0 | 2.0 | 1035 | $1,510 | $1.46 | 21d | 1 | 0.62mi |
| 705 E 2nd Ave Unit 101 Post Falls, ID | 2.0 | 1.0 | 844 | $1,505 | $1.78 | 13d | 1 | 0.67mi |
| 608 E 2nd Ave Unit 203 Post Falls, ID | 2.0 | 1.0 | 874 | $1,490 | $1.70 | 13d | 1 | 0.71mi |
| 214 E 3rd Ave Post Falls, ID | 2.0 | 1.0–2.0 | 768 | $1,665 | $2.17 | 13d | 7 | 0.74mi |
| 366 N Bay St Unit D13 Post Falls, ID | 2.0 | 2.0 | 815 | $1,400 | $1.72 | 21d | 1 | 0.76mi |
| 1800 N Spokane St Unit F18 Post Falls, ID | 2.0 | 1.0 | 875 | $1,400 | $1.60 | 21d | 1 | 0.77mi |
| 366 N Bay St Post Falls, ID | 2.0 | 2.0 | 815 | $1,400 | $1.72 | 13d | 1 | 0.78mi |
| 2008 N Catherine St Unit B Post Falls, ID | 2.0 | 1.0 | 1000 | $1,495 | $1.50 | 21d | 1 | 0.93mi |
| 848 N Chase Rd #205 Post Falls, ID | 2.0 | 2.0 | 1044 | $1,750 | $1.68 | 13d | 1 | 0.99mi |
| 2201 N Spokane St Unit 4 Post Falls, ID | 2.0 | 1.0 | 900 | $1,195 | $1.33 | 13d | 1 | 1.01mi |
| 1812 E Coeur D Alene Ave Post Falls, ID | 3.0 | 2.0 | 1122 | $1,895 | $1.69 | 21d | 1 | 1.07mi |
Listing history 29 events
-
2026-06-19days on market $95,000 Active 53 DOM
-
2026-06-18days on market $95,000 Active 52 DOM
-
2026-06-17days on market $95,000 Active 51 DOM
-
2026-06-16days on market $95,000 Active 50 DOM
-
2026-06-15days on market $95,000 Active 49 DOM
-
2026-06-14days on market $95,000 Active 47 DOM
-
2026-06-13days on market $95,000 Active 46 DOM
-
2026-06-10days on market $95,000 Active 44 DOM
-
2026-06-09days on market $95,000 Active 43 DOM
-
2026-06-08days on market $95,000 Active 42 DOM
-
2026-06-07days on market $95,000 Active 41 DOM
-
2026-06-05days on market $95,000 Active 38 DOM
-
2026-06-03days on market $95,000 Active 37 DOM
-
2026-06-02days on market $95,000 Active 36 DOM
-
2026-06-01days on market $95,000 Active 35 DOM
-
2026-05-31days on market $95,000 Active 34 DOM
-
2026-05-30days on market $95,000 Active 33 DOM
-
2026-04-13status Pending
-
2026-03-12$95,000 Active
-
2025-10-17$95,000 Active
-
2025-04-12status Pending 222-char remark
Show marketing remark (222 chars)
Well maintained, very clean, Single Wide located in River City Village, a 55 + Community, Covered Porch, Vaulted Ceilings, Breakfast Bar, Central Air, Gas forced air. Large Shed. Quiet street, Walking distance to shopping.
-
2025-04-01price $93,000 222-char remark
Show marketing remark (222 chars)
Well maintained, very clean, Single Wide located in River City Village, a 55 + Community, Covered Porch, Vaulted Ceilings, Breakfast Bar, Central Air, Gas forced air. Large Shed. Quiet street, Walking distance to shopping.
-
2025-03-06$108,000 Active 222-char remark
Show marketing remark (222 chars)
Well maintained, very clean, Single Wide located in River City Village, a 55 + Community, Covered Porch, Vaulted Ceilings, Breakfast Bar, Central Air, Gas forced air. Large Shed. Quiet street, Walking distance to shopping.
-
2018-10-05soldstatus Closed
-
2018-09-26status Pending
-
2018-09-06$53,000 Active
-
2016-12-30soldstatus
-
2016-12-15$28,000
-
2003-11-04soldstatus
ⓘ Source: listings_history table (triggers on properties + properties_extension) + one-shot
backfill from property_details.listing_events for pre-trigger history.
Nearby sold comps map
Loading sold comps map…
Walkable amenities ~0.75 mi
Loading nearby amenities…
Taxation est. · year 1
- Rental income
- $18,741
- − Mortgage interest
- −$5,321
- − Property taxes
- −$1,425
- − Insurance
- −$475
- − Repairs & maintenance
- −$1,499
- − Management
- −$1,499
- − Depreciation
- −$2,764
- Taxable income
- $5,757
- Est. tax owed @ 24.0%
- −$1,382
- After-tax cash flow
- $5,545/yr
For passive investors: Depreciation is non-cash, so a rental often shows a tax loss while cash-flowing — sheltering income. Rental losses are passive: they offset passive income freely, and up to $25,000/yr can offset ordinary (W-2) income if you actively participate and your MAGI is under $100k (phasing out to $0 by $150k); unused losses carry forward. On sale, claimed depreciation is recaptured at up to 25%, and gains may owe capital-gains tax (a 1031 exchange can defer both). Figures are a year-1 estimate at your 24.0% rate — not tax advice; consult a CPA.
Schools (NCES district)
- District
- Post Falls District
- NCES district ID
- 1602670
- Math proficiency
- 43% ▼ -5.00%
- Reading proficiency
- 56% ▬ 0.00%
- Median HH income
- $49,504
- Composite
- 42.27/100
- National rank
- #3268
- State rank
- #31 of 92 in ID
Livability — Post Falls
- Score
- 88/100
- State rank
- #1
- US rank
- #198
Category grades
Schools grade is shown separately in the Schools card above.
Census & demographics
- Census place
- Post Falls, ID
- County
- Kootenai County · 146,553 people
- City population
- 54,851
- Metro
- Coeur d'Alene, ID
- Population (ZIP)
- 54,851
- Household income
- $82,742
- Rent vs Own
- Severe rent burden
- 1218.0
Population outlook (Kootenai County) Hauer SSP2
- Today (2025)
- 177,692 people
- By 2030
- 190,689 · +7.3%
- By 2040
- 214,704 · +20.8%
- By 2050
- 236,510 · +33.1%
- By 2075
- 285,984 · +60.9%
- By 2100
- 316,459 · +78.1%
Race, ethnicity, and origin ACS 2023
- Neighborhood character
- Predominantly White (84%)
- Race & ethnicity
- White 84% Two or more races 10% Hispanic / Latino 6% Native American 1%
- Hispanic origin (detail)
- Mexican 4%
- Common ancestry
- Portuguese 4% Italian 3% Slovak 2%
- Foreign-born
- 2% · Canada
- Languages at home
- 96% English-only · Spanish 2%
Political lean MEDSL · Kootenai
- 2024 margin
- Solid R (+51.9) · D 22.9% · R 74.8% · Other 2.2%
- 2008→2024 swing
- -25.6pp toward R · 2008: -26.3pp · 2024: -51.9pp
- All cycles
- 2024: R+51.9 2020: R+42.9 2016: R+42.5 2012: R+34.3 2008: R+26.3
Not yet ingested
- Civics
- —
Market trends
- HPI YoY
- ▼ -259.70%
- Current HPI
- 259.7767
- Rent YoY
- ▲ 1.46%
- Metro
- Coeur d'Alene, ID
- State GDP YoY
- ▲ 4.51%
- F500 in state
- 6
Industry mix (Fortune 500 HQ in ID)
| Industry | F500 HQs | Revenue |
|---|---|---|
| Retail | 1 | $79B |
|
||
| Technology | 1 | $25B |
|
||
| Food / Agriculture | 1 | $6B |
|
||
Price history
+239.3% since first listed12 events — show timeline
- 2026-04-13 Pending — CDAMLS
- 2026-03-12 Listed $95,000 CDAMLS
- 2025-10-17 Listed $95,000 CDAMLS
- 2025-04-12 Pending — CDAMLS
- 2025-04-01 Price Changed $93,000 CDAMLS
- 2025-03-06 Listed $108,000 CDAMLS
- 2018-10-05 Sold (MLS) — CDAMLS
- 2018-09-26 Pending — CDAMLS
- 2018-09-06 Listed $53,000 CDAMLS
- 2016-12-30 Sold (MLS) — CDAMLS
- 2016-12-15 Listed $28,000 CDAMLS
- 2003-11-04 Sold (MLS) — CDAMLS
Cash-flow waterfall
monthlySold comps — $/sqft
last 12 mo · ≤1 miLoading sold comps…