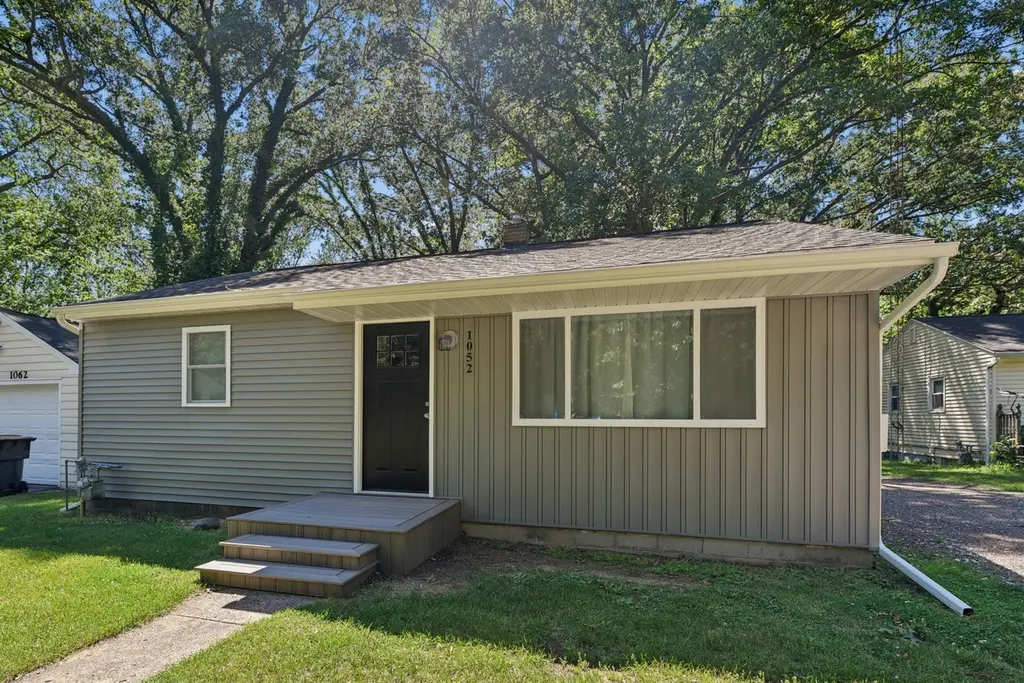
1052 Woodward Ave · St. Joseph, MI
Flood risk 1/10 · Minimal
- FEMA flood zone
- X (unshaded)
- Chance of flooding over 30 yrs
- 0.0%
- Est. flood insurance / yr
- $473 – $860
Fire risk 1/10 · Minimal
- Est. fire insurance / yr
- $784 – $1,456
Heat risk 2/10 · Minimal
- Hot days now (above 100°F)
- 7 days/yr
- Hot days in 30 yrs
- 13 days/yr
Wind risk 2/10 · Minimal
- Chance of severe wind over 30 yrs
- —
Air-quality risk 5/10 · Moderate
- Unhealthy air days now
- 8 days/yr
- Unhealthy air days in 30 yrs
- 8 days/yr
Risk factors via First Street. Map © Google.
Why this score? — see what drove the D- grade
The composite is a weighted blend of 9 inputs, each scored 0–100. Each bar is that input's sub-score; the figure is the points it added to the 100-point composite (weight × sub-score).
- Cash flow +18.5/30.0
- DSCR +5.8/10.0
- 1% rule +3.9/10.0
- Rent growth +2.5/5.0
- Livability +2.5/5.0
- Condition / age +2.5/5.0
- Schools +0.8/10.0
- ARV discount +0.0/15.0
- Appreciation +0.0/10.0
$134,000
🖨 Deal sheet (PDF) 📄 Offer letter ✓ Due diligence
Listing remarks MLS
Welcome to 1052 Woodward Ave, nestled just outside the Benton Harbor city limits in St. Joseph Township! This property offers the opportunity to own a Southwest Michigan home that is practically brand new from the studs out. Step inside to discover a completely revitalized interior. The heart of the home features a stunning, brand-new kitchen complete with all-new appliances. Enjoy the comfort of plush, newly installed carpeting throughout the living spaces and a fully remodeled, pristine bathroom. Peace of mind comes standard here, thanks to all-newer mechanicals including a new furnace in 2021 and a new water heater. The exterior has been completely transformed with a newer roof (2016), new gutters, soffits, fascia, and stylish new siding. With new doors and energy-efficient windows throughout, this home is completely turnkey and maintenance-free. Experience new construction peace of mind with classic charm. Don't miss this exceptionally renovated gem! MSHDA Eligible!!
Key facts
- New furnace
- Brand new kitchen
- All new appliances
Tags
Property features AI
Exterior
- Utilities: Public water; Natural gas connected; Electric water heater
- Home design: Ranch-style single family home; One story
- Construction: Built in 1952; Vinyl siding; Shingle roof; Crawl space foundation
- Exterior features: Paved road access; 0.2-acre lot
Interior
- Kitchen: Range; Refrigerator
- Bathrooms: 1 full bathroom
- Heating & cooling: Forced air heating; Window air conditioning units
- Interior features: Replacement windows; 5 total rooms
- Laundry & utility: Electric water heater
Neighborhood map
What this means for you Summary
Snapshot
- This is a 3-bed/1.0-bath single-family listed at $134k.
Deal economics
- At list price, monthly cash flow is $127 ($2k/yr) — positive.
- The deal already cash-flows at list — no discount required.
- To meet the 1% rule (rent ≥ 1% of price), the offer needs to be $120k (10.5% below list).
- Recommended offer: $120k (10.5% below list) — sets the bar for 1% rule.
- Cap rate 7.4% vs local median 3.0% in St. Joseph — top-decile yield for the area; either an underpriced asset or a hidden risk that comps aren't pricing in. Stress-test before assuming the spread holds.
Location & tenants
- Location reads: area grade D — affects rentability + tenant quality, not the cash-flow math above.
- Benton Harbor Area Schools (urban): math 4% / reading 7% proficiency, ranked #732 of 760 in MI (top 96%) — low school quality limits family demand, transient renter base, plan for 1-2y turnover; 89% free/reduced lunch — lower-income household profile, screen leases tightly.
- Zoned schools: Fair Plain Middle School (math 0% / reading 4%, grade F, #493 of 493 statewide, top 100%, 288 students, 97% FRL); Fair Plain Middle School (math 0% / reading 4%, grade F, #493 of 493 statewide, top 100%, 288 students, 97% FRL); Benton Harbor High School (math 5% / reading 5%, grade F, #704 of 713 statewide, top 100%, 495 students, 97% FRL).
- Market conditions: 184 active listings in the ZIP; 397 units permitted in Berrien County in 2024 (40 in 5+ unit buildings).
Forward outlook
- Local home prices are declining (-3.0%/yr); year-one equity from $926 of loan paydown is wiped out by about $4k of value loss. Plan a longer hold.
- Berrien County population projected at -16% by 2050 — secular population decline; favor cash flow + early exit over multi-decade hold.
Negotiation context
- Only 2 days on market — expect competitive offers; lowballing is unlikely to land.
- 3 sale attempts with the ask held roughly flat each time — persistent listings suggest the price (not the market) is what's stuck; bring a comps-based counter.
Risks & watch-outs
- Watch-outs: built in 1952 — expect roof / HVAC / electrical / plumbing capex.
Questions for the listing agent
- Built in 1952 — when were the roof, HVAC, electrical panel, plumbing, and water heater last replaced?
- Is there a deadline driving the sale (1031 exchange, divorce, estate, relocation)? That informs how much negotiation room exists.
- The area grade is low — what's the realistic commute time and amenity access for the typical tenant pool here? Any planned neighborhood developments (good or bad) we should know about?
- What's the average days-on-market for RENTAL listings here right now (not sales)? A rising rental-DOM trend means longer vacancies and softer asking-rent achievability than the comps imply.
- What's the recent tenant-quality profile in this submarket — average credit score on applications, eviction rate, late-payment / NSF rate, and stable-employment percentage? A property-management company in the area should have these aggregated.
- How much new for-sale + rental construction is in the pipeline within 1–3 miles? Heavy new supply typically softens prices + rents 12–24 months out; constrained supply supports both.
Investment metrics
- 1% rule
- 0.89% ✗
- Cap rate
- 7.43%
- Cash-on-cash
- 4.05%
- DSCR
- 1.18
- GRM
- 9.3
CMA / ARV
- ARV (on-the-fly)
- $110,160
- Comps found
- 5
Show comp detail 5 sales within ~0.75 mi
| Address | Dist | Beds/Ba | Sqft | Sold | Price | $/sf | Match |
|---|---|---|---|---|---|---|---|
| 244 Parker Ave | 0.22mi | 3/1.0 | 776 (+8%) | 11mo | $118,900 | $153 | 67 |
| 299 W May St | 0.16mi | 2/1.0 (-1) | 737 (+2%) | 20mo | $105,000 | $142 | 67 |
| 157 Cross St | 0.50mi | 2/1.0 (-1) | 730 (+1%) | 17mo | $129,900 | $178 | 56 |
| 479 Chippewa Rd | 0.66mi | 2/1.0 (-1) | 686 (-5%) | 14mo | $115,000 | $168 | 45 |
| 1067 Mcalister Ave | 0.54mi | 2/1.0 (-1) | 800 (+11%) | 23mo | $65,000 | $81 | 32 |
Match score weights: distance 35% · size 25% · config 20% · recency 20%. Top-matched comps best support the ARV.
Projected returns pro-forma
-3.0% appreciation · 3.0% rent growth · sell at horizon
- IRR
- -10.0%
- Equity multiple
- 0.63×
- Total profit
- $-13,702
- Equity at exit
- $19,980
- IRR
- -0.7%
- Equity multiple
- 0.95×
- Total profit
- $-1,744
- Equity at exit
- $11,586
Cash invested: $37,520 (down + closing). Projections, not guarantees.
Landlord ↔ Tenant lean methodology
- Overall (STATE)
- 62 Landlord-Friendly
- State Michigan
- 62 Landlord-Friendly · EVEN
- County
- — inherits STATE
- City
- — inherits STATE
ZIP-level market 49022
- Active inventory
- 184
- Price-to-rent
- 9.3×
Monthly cashflow live
- Estimated rent
- $1,199 medium interval (Pro) →
- Mortgage (P&I)
- −$703
- Tax from tax record
- −$62 /mo · $745/yr
- Insurance
- −$56
- HOA
- −$0
- Vacancy / Maint / Mgmt
- −$252
- Net cashflow
- $127
Break-even live
Sensitivity live
| Price | -10% $202 | -5% $164 | +0% $127 | +5% $89 | +10% $51 |
|---|---|---|---|---|---|
| Rent | -10% $32 | -5% $79 | +0% $127 | +5% $174 | +10% $221 |
| Rate | -1.0pp $194 | -0.5pp $161 | base $127 | +0.5pp $92 | +1.0pp $56 |
UW: 25.0% down · 7.5% · 30yr · 1.5% tax · 5.0% vac · 8.0% maint · 8.0% mgmt
Financing live
Cash to close
- Down payment
- $33,500
- Closing costs
- $4,020
- Reserves months
- —
- Total cash needed
- —
Loan-product check · same deal, 3 products live
Conventional
25% down · 7.5% · 30yr
- Down + closing
- —
- Monthly P&I
- —
- Monthly cashflow
- —
- DSCR
- —
- Eligible?
- —
Personal DTI + credit; lowest rate.
DSCR
20% down · 8.5% · 30yr
- Down + closing
- —
- Monthly P&I
- —
- Monthly cashflow
- —
- DSCR
- —
- Eligible?
- —
No personal income docs; deal must DSCR.
Hard money
10% down · 12.0% · 12mo
- Down + closing
- —
- Monthly P&I
- —
- Monthly cashflow
- —
- DSCR
- —
- Eligible?
- —
Short-term bridge; refi at stabilization.
Listing history 2 events
-
2026-06-22remarks 699-char remark
-
2026-06-22$134,000 Active 2 DOM
ⓘ Source: listings_history table (triggers on properties + properties_extension) + one-shot
backfill from property_details.listing_events for pre-trigger history.
Tax reassessment forecast MI · Partial reset (capped growth)
- Current annual tax
- $745 · $62/mo
- Projected year-2 tax
- $1,405 · $117/mo
- Expected delta
- +$659/yr (+$55/mo · 88.4%)
ⓘ Screening estimate from a state-policy table — verify with the county assessor before closing.
Climate risk First Street
- Flood 1/10 Low FEMA zone X (unshaded) · 0% chance over 30 yrs
- Wildfire 1/10 Low
- Heat 2/10 Low 7 d/yr ≥100°F today · 13 d/yr by 30 yrs out
- Wind 2/10 Low
- Air quality 5/10 Major 8 unhealthy d/yr today · 8 by 30 yrs out
Nearby sold comps map
Loading sold comps map…
Walkable amenities ~0.75 mi
Loading nearby amenities…
Taxation est. · year 1
- Rental income
- $14,388
- − Mortgage interest
- −$7,506
- − Property taxes
- −$745
- − Insurance
- −$670
- − Repairs & maintenance
- −$1,151
- − Management
- −$1,151
- − Depreciation
- −$3,898
- Taxable loss
- −$734
- Est. tax savings @ 24.0%
- +$176
- After-tax cash flow
- $1,695/yr
For passive investors: Depreciation is non-cash, so a rental often shows a tax loss while cash-flowing — sheltering income. Rental losses are passive: they offset passive income freely, and up to $25,000/yr can offset ordinary (W-2) income if you actively participate and your MAGI is under $100k (phasing out to $0 by $150k); unused losses carry forward. On sale, claimed depreciation is recaptured at up to 25%, and gains may owe capital-gains tax (a 1031 exchange can defer both). Figures are a year-1 estimate at your 24.0% rate — not tax advice; consult a CPA.
Schools (NCES district)
- District
- Benton Harbor Area Schools
- NCES district ID
- 2604830
- Math proficiency
- 4% ▬ 0.00%
- Reading proficiency
- 7% ▬ 0.00%
- Median HH income
- $27,038
- Composite
- 7.53/100
- National rank
- #14787
- State rank
- #732 of 760 in MI
Livability — St. Joseph
No livability data for this city. (Only ~50 U.S. cities are tracked.)
Census & demographics
- Census place
- Fair Plain, MI
- Population (ZIP)
- 29,796
Population outlook (Berrien County) Hauer SSP2
- Today (2025)
- 149,273 people
- By 2030
- 145,211 · -2.7%
- By 2040
- 135,435 · -9.3%
- By 2050
- 125,543 · -15.9%
- By 2075
- 103,986 · -30.3%
- By 2100
- 82,256 · -44.9%
Race, ethnicity, and origin ACS 2023
- Neighborhood character
- Diverse neighborhood (Simpson 0.61)
- Race & ethnicity
- Black 50% White 37% Hispanic / Latino 7% Two or more races 6% Native American 2%
- Hispanic origin (detail)
- Mexican 6%
- Common ancestry
- Romanian 1% Lithuanian 1% Slovak 1%
- Foreign-born
- 3% · Canada
- Languages at home
- 94% English-only · Spanish 5%
Political lean MEDSL · Berrien
- 2024 margin
- Lean R (+7.9) · D 45.4% · R 53.2% · Other 1.4%
- 2008→2024 swing
- -13.3pp toward R · 2008: 5.5pp · 2024: -7.9pp
- All cycles
- 2024: R+7.9 2020: R+7.4 2016: R+12.7 2012: R+6.6 2008: D+5.5
Not yet ingested
- Civics
- —
Market trends
- HPI YoY
- ▼ -309.81%
- Current HPI
- 209.9723
- Rent YoY
- —
- Metro
- —
- State GDP YoY
- ▲ 1.37%
- F500 in state
- 28
Industry mix (Fortune 500 HQ in MI)
| Industry | F500 HQs | Revenue |
|---|---|---|
| Automotive Parts | 3 | $48B |
|
||
| Automotive | 2 | $372B |
|
||
| Chemicals | 1 | $45B |
|
||
| Automotive Retail | 1 | $29B |
|
||
| Healthcare / Medical Devices | 1 | $23B |
|
||
| Automotive Technology | 1 | $20B |
|
||
Price history
+0.0% since first listed3 events — show timeline
- 2026-06-19 Listed $134,000 MiRealSource-MiMLS
- 2026-06-19 Listed $134,000 REALCOMP
- 2026-06-19 Listed $134,000 SW Michigan MLS
Property tax history
+1.0%/yrLatest (2024): $745 · +4.8% YoY. Source: county tax records.
Cash-flow waterfall
monthlySold comps — $/sqft
last 12 mo · ≤1 miLoading sold comps…