 🏷️ Likely Rental
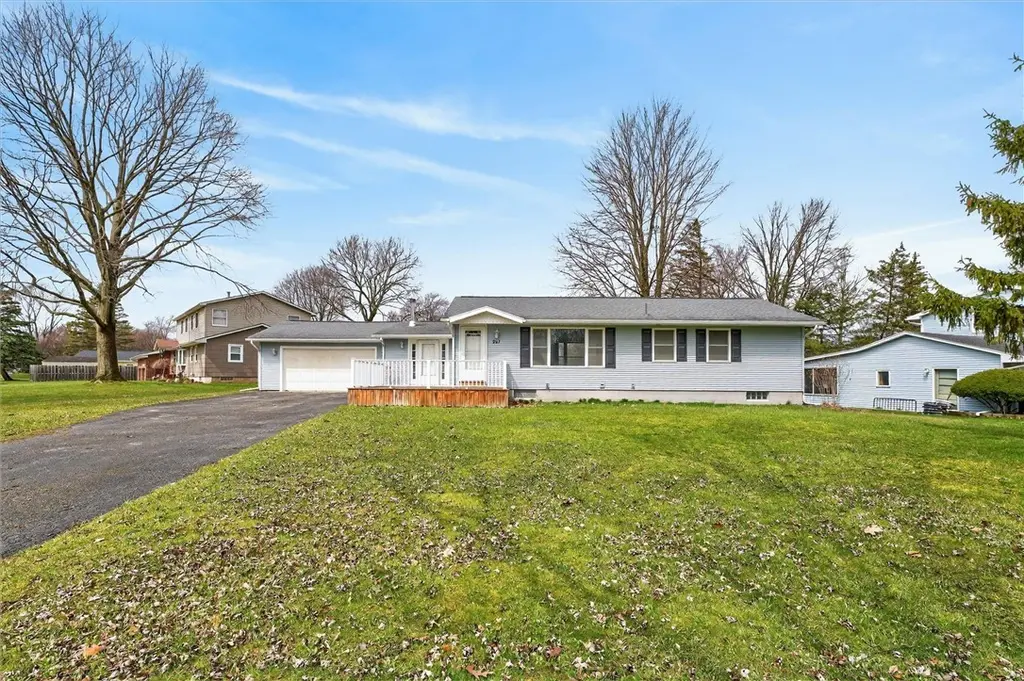
267 Valiant Dr · Brighton, NY
Flood risk 1/10 · Minimal
- FEMA flood zone
- X (unshaded)
- Chance of flooding over 30 yrs
- 0.0%
- Est. flood insurance / yr
- $473 – $860
Fire risk 1/10 · Minimal
- Est. fire insurance / yr
- $691 – $1,283
Heat risk 2/10 · Minimal
- Hot days now (above 94°F)
- 7 days/yr
- Hot days in 30 yrs
- 15 days/yr
Wind risk 1/10 · Minimal
- Chance of severe wind over 30 yrs
- —
Air-quality risk 2/10 · Minimal
- Unhealthy air days now
- 1 days/yr
- Unhealthy air days in 30 yrs
- 1 days/yr
Risk factors via First Street. Map © Google.
Why this score? — see what drove the C- grade
The composite is a weighted blend of 9 inputs, each scored 0–100. Each bar is that input's sub-score; the figure is the points it added to the 100-point composite (weight × sub-score).
- ARV discount +15.0/15.0
- Cash flow +12.2/30.0
- Schools +5.2/10.0
- 1% rule +4.8/10.0
- Rent growth +4.0/5.0
- Livability +4.0/5.0
- DSCR +3.6/10.0
- Condition / age +2.5/5.0
- Appreciation +0.0/10.0
$199,900
🖨 Deal sheet (PDF) 📄 Offer letter ✓ Due diligence
Listing remarks MLS
All the heavy lifting is done! Tear off roof 6 years old includes new skylight, Vinyl clad throermopane windows replaced 2014, Siding 2014,High efficiency furnace and central air 2017, hot water tank 2011, replacement shed 2014, all exterior doors replaced. Remodeled bath, all floors are either hardwoods or ceramic tile(great for allergy relief), wood burning stove, Master bedroom offers spacious walk in closet, glass block basement windows, covered deck overlooks backyard, spacious deck at front entry too! Oversized 2 car attached garage, Wall mounted TV's NOT included but brackets are included, all garage and basement fluorescent lighting IS included. RGE avg $170/month. Convenient neighborhood off East Henrietta Rd near Calkins.
Key facts
- Remodeled bathroom
- Full basement
- Tear-off roof
Tags
Neighborhood map
What this means for you Summary
Snapshot
- This is a 2-bed/1.0-bath single-family listed at $200k.
Deal economics
- At list price, monthly cash flow is $-41 ($-497/yr) — negative.
- To cash-flow at today's rent, offer at most $193k (3.7% below list).
- To meet the 1% rule (rent ≥ 1% of price), the offer needs to be $195k (2.2% below list).
- Recommended offer: $193k (3.7% below list) — sets the bar for cash-flow.
- Cap rate 6.0% vs local median 3.9% in Brighton — top-decile yield for the area; either an underpriced asset or a hidden risk that comps aren't pricing in. Stress-test before assuming the spread holds.
Location & tenants
- Location reads 81/100 on livability (#89 in NY, #1,379 nationally) — a professional / high-income tenant draw. Strengths: housing A+, health & safety A+, employment B+; Watch: crime D+, amenities D-.
- Rush-Henrietta Central School District (suburban): math 62% / reading 57% proficiency, ranked #237 of 590 in NY (top 40%) — acceptable for families but not a draw, mixed tenant base, ~2y average lease.
- Zoned schools: Floyd S Winslow Elementary School (math 72% / reading 67%, grade A-, #447 of 2,108 statewide, top 24%, 488 students, 33% FRL); Charles H Roth Junior High School (math 42% / reading 57%, grade C, #280 of 729 statewide, top 40%, 531 students, 55% FRL); Rush-Henrietta Senior High School (math 97% / reading 72%, grade A, #379 of 1,100 statewide, top 36%, 1,300 students, 43% FRL).
- Market conditions: Rents rising fast (+6.1%/yr); 48 active listings in the ZIP; 2 comparable units currently listed for rent nearby; 1,169 units permitted in Monroe County in 2024 (591 in 5+ unit buildings).
- This rent runs 36% of the median local income ($65k/yr) — at the standard rent-burdened threshold; future hikes will face affordability resistance.
Forward outlook
- Local home prices are declining (-3.0%/yr); year-one equity from $1k of loan paydown is wiped out by about $6k of value loss. Plan a longer hold.
- Monroe County population projected to shrink 6% by 2050 — rents likely to lag national; underwrite the cash flow, not the appreciation.
Negotiation context
- Only 5 days on market — expect competitive offers; lowballing is unlikely to land.
- 3 sale attempts since 16y ago with the ask held roughly flat each time — persistent listings suggest the price (not the market) is what's stuck; bring a comps-based counter.
- Current owner paid $122k; list at $200k implies a 64% gain — meaningful room to come down on a strong offer.
Risks & watch-outs
- Watch-outs: property tax is 2.7% of price; built in 1959 — expect roof / HVAC / electrical / plumbing capex.
Questions for the listing agent
- What do current leases actually rent for vs. the listed asking? Can we see a recent rent roll and the last 12 months of T-12 income?
- Built in 1959 — when were the roof, HVAC, electrical panel, plumbing, and water heater last replaced?
- Property tax is high relative to price — has the assessment been appealed recently, and will the sale trigger a re-assessment?
- Is there a deadline driving the sale (1031 exchange, divorce, estate, relocation)? That informs how much negotiation room exists.
- Schools are B-rated — typically a magnet for longer-tenancy family renters. What's the average tenant stay here, and is there a school-zone premium baked into asking?
- Crime grade is D in this area — have there been break-ins, vandalism, or insurance claims at this property in the last 3 years? What carrier currently insures it and at what premium?
- What's the average days-on-market for RENTAL listings here right now (not sales)? A rising rental-DOM trend means longer vacancies and softer asking-rent achievability than the comps imply.
- What's the recent tenant-quality profile in this submarket — average credit score on applications, eviction rate, late-payment / NSF rate, and stable-employment percentage? A property-management company in the area should have these aggregated.
- How much new for-sale + rental construction is in the pipeline within 1–3 miles? Heavy new supply typically softens prices + rents 12–24 months out; constrained supply supports both.
Investment metrics
- 1% rule
- 0.98% ✗
- Cap rate
- 6.04%
- Cash-on-cash
- -0.89%
- DSCR
- 0.96
- GRM
- 8.5
CMA / ARV
- ARV (on-the-fly)
- $265,608
- Comps found
- 12
Show comp detail 12 sales within ~0.75 mi
| Address | Dist | Beds/Ba | Sqft | Sold | Price | $/sf | Match |
|---|---|---|---|---|---|---|---|
| 267 Valiant Dr | 0.00mi | 2/1.0 | 1,224 (0%) | 1mo | $300,000 | $245 | 100 |
| 174 Valiant Dr | 0.22mi | 3/1.0 (+1) | 1,268 (+4%) | 2mo | $296,000 | $233 | 77 |
| 1900 Lehigh Station Rd | 0.09mi | 3/1.0 (+1) | 1,175 (-4%) | 10mo | $225,000 | $191 | 76 |
| 1108 Farnsworth Rd S | 0.33mi | 3/1.0 (+1) | 1,108 (-10%) | 6mo | $220,000 | $199 | 59 |
| 132 Colony Ln | 0.32mi | 3/1.0 (+1) | 1,120 (-8%) | 10mo | $243,000 | $217 | 57 |
| 65 Masthead | 0.16mi | 3/1.5 (+1) | 1,052 (-14%) | 8mo | $270,000 | $257 | 56 |
| 87 Colony Ln | 0.43mi | 3/1.0 (+1) | 1,120 (-8%) | 7mo | $235,000 | $210 | 55 |
| 40 Colleen | 0.73mi | 3/1.0 (+1) | 1,225 (+0%) | 11mo | $241,000 | $197 | 52 |
| 28 Campfire Rd S | 0.65mi | 3/1.5 (+1) | 1,056 (-14%) | 7mo | $240,000 | $227 | 34 |
| 53 Campfire Rd S | 0.72mi | 3/1.0 (+1) | 1,056 (-14%) | 8mo | $221,600 | $210 | 32 |
| 36 Hartwood Dr | 0.69mi | 3/2.0 (+1) | 1,394 (+14%) | 7mo | $205,000 | $147 | 30 |
| 12 Buffalo Horn Cir | 0.72mi | 3/1.0 (+1) | 1,056 (-14%) | 11mo | $262,500 | $249 | 30 |
Match score weights: distance 35% · size 25% · config 20% · recency 20%. Top-matched comps best support the ARV.
Projected returns pro-forma
-3.0% appreciation · 6.06% rent growth · sell at horizon
- IRR
- -13.8%
- Equity multiple
- 0.49×
- Total profit
- $-28,673
- Equity at exit
- $29,806
- IRR
- -0.1%
- Equity multiple
- 0.99×
- Total profit
- $-630
- Equity at exit
- $17,284
Cash invested: $55,972 (down + closing). Projections, not guarantees.
Landlord ↔ Tenant lean methodology
- Overall (STATE)
- 15 Strongly Tenant-Friendly
- State New York
- 15 Strongly Tenant-Friendly · D+10
- County
- — inherits STATE
- City
- — inherits STATE
ZIP-level market 14623
- Rents YoY
- 6.1%
- Active inventory
- 48
- Price-to-rent
- 8.5×
Monthly cashflow live
- Estimated rent
- $1,955 medium interval (Pro) →
- Mortgage (P&I)
- −$1,048
- Tax from tax record
- −$454 /mo · $5,448/yr
- Insurance
- −$83
- HOA
- −$0
- Vacancy / Maint / Mgmt
- −$410
- Net cashflow
- $-41
Break-even live
Sensitivity live
| Price | -10% $72 | -5% $15 | +0% $-41 | +5% $-98 | +10% $-155 |
|---|---|---|---|---|---|
| Rent | -10% $-196 | -5% $-119 | +0% $-41 | +5% $36 | +10% $113 |
| Rate | -1.0pp $59 | -0.5pp $9 | base $-41 | +0.5pp $-93 | +1.0pp $-146 |
UW: 25.0% down · 7.5% · 30yr · 1.5% tax · 5.0% vac · 8.0% maint · 8.0% mgmt
Financing live
Cash to close
- Down payment
- $49,975
- Closing costs
- $5,997
- Reserves months
- —
- Total cash needed
- —
Loan-product check · same deal, 3 products live
Conventional
25% down · 7.5% · 30yr
- Down + closing
- —
- Monthly P&I
- —
- Monthly cashflow
- —
- DSCR
- —
- Eligible?
- —
Personal DTI + credit; lowest rate.
DSCR
20% down · 8.5% · 30yr
- Down + closing
- —
- Monthly P&I
- —
- Monthly cashflow
- —
- DSCR
- —
- Eligible?
- —
No personal income docs; deal must DSCR.
Hard money
10% down · 12.0% · 12mo
- Down + closing
- —
- Monthly P&I
- —
- Monthly cashflow
- —
- DSCR
- —
- Eligible?
- —
Short-term bridge; refi at stabilization.
Rent comps 2 comps
| Address | Beds | Baths | Sqft | Rent | $/sqft | DOM | Units | Dist |
|---|---|---|---|---|---|---|---|---|
| 2001-2055 E Henrietta Rd Rochester, NY | 2.0 | 1.0 | 650 | $1,525 | $2.35 | 4d | 8 | 1.34mi |
| 142 Prentiss Way Unit 1 Henrietta, NY | 3.0 | 1.0 | 1368 | $2,000 | $1.46 | 13d | 1 | 1.40mi |
Listing history 10 events
-
2026-04-07status Pending
-
2026-04-02$199,900 Active
-
2018-03-02soldstatus $122,000
-
2018-03-01soldstatus $122,000 Closed Sale or Rented 741-char remark
Show marketing remark (741 chars)
All the heavy lifting is done! Tear off roof 6 years old includes new skylight, Vinyl clad throermopane windows replaced 2014, Siding 2014,High efficiency furnace and central air 2017, hot water tank 2011, replacement shed 2014, all exterior doors replaced. Remodeled bath, all floors are either hardwoods or ceramic tile(great for allergy relief), wood burning stove, Master bedroom offers spacious walk in closet, glass block basement windows, covered deck overlooks backyard, spacious deck at front entry too! Oversized 2 car attached garage, Wall mounted TV's NOT included but brackets are included, all garage and basement fluorescent lighting IS included. RGE avg $170/month. Convenient neighborhood off East Henrietta Rd near Calkins.
-
2018-01-14status Pending Sale 741-char remark
Show marketing remark (741 chars)
All the heavy lifting is done! Tear off roof 6 years old includes new skylight, Vinyl clad throermopane windows replaced 2014, Siding 2014,High efficiency furnace and central air 2017, hot water tank 2011, replacement shed 2014, all exterior doors replaced. Remodeled bath, all floors are either hardwoods or ceramic tile(great for allergy relief), wood burning stove, Master bedroom offers spacious walk in closet, glass block basement windows, covered deck overlooks backyard, spacious deck at front entry too! Oversized 2 car attached garage, Wall mounted TV's NOT included but brackets are included, all garage and basement fluorescent lighting IS included. RGE avg $170/month. Convenient neighborhood off East Henrietta Rd near Calkins.
-
2018-01-09$124,900 Active 741-char remark
Show marketing remark (741 chars)
All the heavy lifting is done! Tear off roof 6 years old includes new skylight, Vinyl clad throermopane windows replaced 2014, Siding 2014,High efficiency furnace and central air 2017, hot water tank 2011, replacement shed 2014, all exterior doors replaced. Remodeled bath, all floors are either hardwoods or ceramic tile(great for allergy relief), wood burning stove, Master bedroom offers spacious walk in closet, glass block basement windows, covered deck overlooks backyard, spacious deck at front entry too! Oversized 2 car attached garage, Wall mounted TV's NOT included but brackets are included, all garage and basement fluorescent lighting IS included. RGE avg $170/month. Convenient neighborhood off East Henrietta Rd near Calkins.
-
2011-02-09soldstatus $81,500 19-char remark
Show marketing remark (19 chars)
PROPERTY SOLD AS-IS
-
2010-10-19$84,900 19-char remark
Show marketing remark (19 chars)
PROPERTY SOLD AS-IS
-
2001-10-11soldstatus $98,000
-
1996-05-29soldstatus $82,000
ⓘ Source: listings_history table (triggers on properties + properties_extension) + one-shot
backfill from property_details.listing_events for pre-trigger history.
Tax reassessment forecast NY · Partial reset (capped growth)
- Current annual tax
- $5,448 · $454/mo
- Projected year-2 tax
- $5,448 · $454/mo
- Expected delta
- $0/yr ($0/mo · 0.0%)
ⓘ Screening estimate from a state-policy table — verify with the county assessor before closing.
Climate risk First Street
- Flood 1/10 Low FEMA zone X (unshaded) · 0% chance over 30 yrs
- Wildfire 1/10 Low
- Heat 2/10 Low 7 d/yr ≥94°F today · 15 d/yr by 30 yrs out
- Wind 1/10 Low
- Air quality 2/10 Low 1 unhealthy d/yr today · 1 by 30 yrs out
Nearby sold comps map
Loading sold comps map…
Walkable amenities ~0.75 mi
Loading nearby amenities…
Taxation est. · year 1
- Rental income
- $23,456
- − Mortgage interest
- −$11,198
- − Property taxes
- −$5,448
- − Insurance
- −$1,000
- − Repairs & maintenance
- −$1,877
- − Management
- −$1,877
- − Depreciation
- −$5,815
- Taxable loss
- −$3,757
- Est. tax savings @ 24.0%
- +$902
- After-tax cash flow
- $405/yr
For passive investors: Depreciation is non-cash, so a rental often shows a tax loss while cash-flowing — sheltering income. Rental losses are passive: they offset passive income freely, and up to $25,000/yr can offset ordinary (W-2) income if you actively participate and your MAGI is under $100k (phasing out to $0 by $150k); unused losses carry forward. On sale, claimed depreciation is recaptured at up to 25%, and gains may owe capital-gains tax (a 1031 exchange can defer both). Figures are a year-1 estimate at your 24.0% rate — not tax advice; consult a CPA.
Schools (NCES district)
- District
- Rush-Henrietta Central School District
- NCES district ID
- 3625170
- Math proficiency
- 62% ▼ -6.00%
- Reading proficiency
- 57% ▲ 1.00%
- Median HH income
- $58,682
- Composite
- 51.52/100
- National rank
- #1720
- State rank
- #237 of 590 in NY
Livability — Brighton
- Score
- 81/100
- State rank
- #89
- US rank
- #1379
Category grades
Schools grade is shown separately in the Schools card above.
Census & demographics
- County
- Monroe County · 674,131 people
- City population
- 38,703
- Metro
- Rochester, NY
- Population (ZIP)
- 26,032
- Household income
- $65,342
- Rent vs Own
- Severe rent burden
- 1161.0
Population outlook (Monroe County) Hauer SSP2
- Today (2025)
- 759,460 people
- By 2030
- 757,154 · -0.3%
- By 2040
- 740,644 · -2.5%
- By 2050
- 714,443 · -5.9%
- By 2075
- 645,883 · -15.0%
- By 2100
- 547,084 · -28.0%
Race, ethnicity, and origin ACS 2023
- Neighborhood character
- Predominantly White (67%)
- Race & ethnicity
- White 67% Asian 15% Black 8% Two or more races 6% Hispanic / Latino 6%
- Hispanic origin (detail)
- Puerto Rican 3%
- Common ancestry
- Romanian 4% Iranian 2% Lithuanian 2%
- Foreign-born
- 14% · China, Canada, Vietnam
- Languages at home
- 84% English-only · Chinese 4% Other Indo-European 3% Spanish 2%
Political lean MEDSL · Monroe
- 2024 margin
- D (+19.1) · D 59.5% · R 40.5%
- 2008→2024 swing
- +1.4pp toward D · 2008: 17.7pp · 2024: 19.1pp
- All cycles
- 2024: D+19.1 2020: D+21.0 2016: D+14.1 2012: D+17.4 2008: D+17.7
Not yet ingested
- Civics
- —
Market trends
- HPI YoY
- ▼ -180.68%
- Current HPI
- 262.8187
- Rent YoY
- ▲ 6.06%
- Metro
- Rochester, NY
- State GDP YoY
- ▲ 2.60%
- F500 in state
- 92
Industry mix (Fortune 500 HQ in NY)
| Industry | F500 HQs | Revenue |
|---|---|---|
| Financial Services | 10 | $950B |
|
||
| Consumer Goods | 9 | $162B |
|
||
| Insurance | 4 | $225B |
|
||
| Telecommunications | 2 | $144B |
|
||
| Pharmaceuticals | 2 | $112B |
|
||
| Media / Entertainment | 2 | $69B |
|
||
Price history
+143.8% since first listed10 events — show timeline
- 2026-04-07 Pending — UNYREIS
- 2026-04-02 Listed $199,900 UNYREIS
- 2018-03-02 Sold (Public Records) $122,000 Public Records
- 2018-03-01 Sold (MLS) $122,000 UNYREIS
- 2018-01-14 Pending — UNYREIS
- 2018-01-09 Listed $124,900 UNYREIS
- 2011-02-09 Sold (MLS) $81,500 UNYREIS
- 2010-10-19 Listed $84,900 UNYREIS
- 2001-10-11 Sold (Public Records) $98,000 Public Records
- 1996-05-29 Sold (Public Records) $82,000 Public Records
Property tax history
+6.0%/yrLatest (2025): $5,448 · +5.6% YoY. Source: county tax records.
Cash-flow waterfall
monthlySold comps — $/sqft
last 12 mo · ≤1 miLoading sold comps…