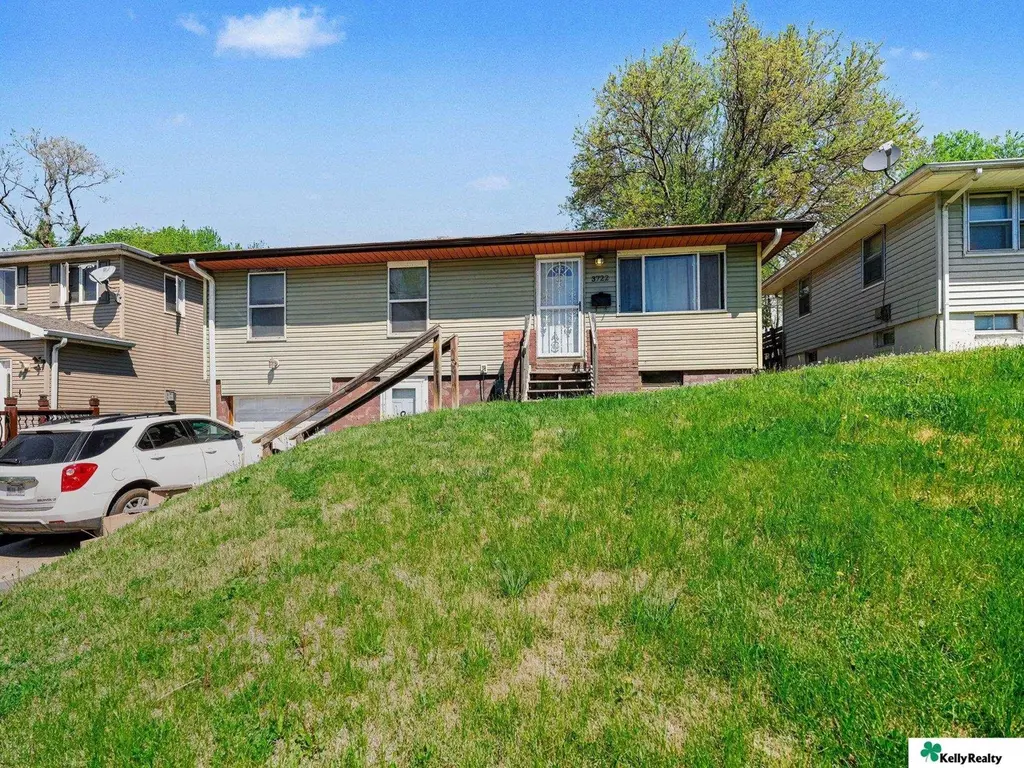
3722 Crown Pointe Ave · Omaha, NE
Flood risk 1/10 · Minimal
- FEMA flood zone
- X (unshaded)
- Chance of flooding over 30 yrs
- 0.0%
- Est. flood insurance / yr
- $473 – $860
Fire risk 1/10 · Minimal
- Est. fire insurance / yr
- $1,161 – $2,155
Heat risk 3/10 · Minor
- Hot days now (above 105°F)
- 7 days/yr
- Hot days in 30 yrs
- 15 days/yr
Wind risk 2/10 · Minimal
- Chance of severe wind over 30 yrs
- —
Air-quality risk 2/10 · Minimal
- Unhealthy air days now
- 0 days/yr
- Unhealthy air days in 30 yrs
- 1 days/yr
Risk factors via First Street. Map © Google.
Why this score? — see what drove the C+ grade
The composite is a weighted blend of 9 inputs, each scored 0–100. Each bar is that input's sub-score; the figure is the points it added to the 100-point composite (weight × sub-score).
- Cash flow +21.4/30.0
- Appreciation +10.0/10.0
- ARV discount +7.0/15.0
- DSCR +6.8/10.0
- 1% rule +5.6/10.0
- Livability +4.2/5.0
- Rent growth +3.3/5.0
- Condition / age +2.5/5.0
- Schools +2.1/10.0
$150,000
🖨 Deal sheet 📄 Offer letter ✓ Due diligence
Listing remarks MLS
Calling all buyers willing to do your thing. Potential is here. Sold as is. Needs patch, paint repairs and flooring. Dr. is eating area. Ceiling fans. Walk out basement. Large back yard
Key facts
- 6,534 sq ft lot
- Garage
- Built 1957
Property features AI
Exterior
- Parking: Attached garage with space for 1 vehicle; One covered parking space
- Utilities: Public water; Public sewer
- Home design: Single-family residential; Not new / not a model; Built in 1957
- Construction: Block foundation
- Exterior features: Deck; Chain link fencing; Lot up to 1/4 acre (approximately 0.15 acres, 50 x 138)
Interior
- Bedrooms: Master bedroom on the main floor; Second bedroom on the main floor; Third bedroom on the main floor
- Bathrooms: Two bathrooms total, one full bath on the main level
- Heating & cooling: Electric forced-air heating; Central air conditioning
- Interior features: Walk-out basement access; No fireplaces
Neighborhood map
What this means for you Summary
Snapshot
- This is a 3-bed/1.0-bath single-family listed at $150k.
Deal economics
- At list price, monthly cash flow is $223 ($3k/yr) — positive.
- The deal already cash-flows at list — no discount required.
- Meets the 1% rule at list price ($2k rent vs $150k).
- Recommended offer: $146k (3.0% below list) — sets the bar for market timing.
- Cap rate 8.1% vs local median 3.6% in Omaha — top-decile yield for the area; either an underpriced asset or a hidden risk that comps aren't pricing in. Stress-test before assuming the spread holds.
Location & tenants
- Location reads 84/100 on livability (#7 in NE, #663 nationally) — a professional / high-income tenant draw. Strengths: amenities A+, commute A+, cost of living A+; Watch: crime F.
- Omaha Public Schools (urban): math 20% / reading 28% proficiency, ranked #110 of 111 in NE (top 99%) — low school quality limits family demand, transient renter base, plan for 1-2y turnover; 62% free/reduced lunch — lower-income household profile, screen leases tightly.
- Zoned schools: Belvedere Elementary School (math 2% / reading 12%, grade F, #497 of 502 statewide, top 99%, 366 students, 0% FRL); North High School (math 21% / reading 25%, grade F, #247 of 261 statewide, top 95%, 1,796 students, 0% FRL) — zoned schools average 0% FRL vs 62% district-wide (62 pts lower); this property's tenant base skews higher-income than the district average.
- Market conditions: Rents rising (+3.2%/yr); 139 active listings in the ZIP; 19 comparable units currently listed for rent nearby; rentals at typical pace (median 24d on market — plan ~3-4 weeks tenant-placement turnaround); lower-income renter base — watch delinquency; 4,539 units permitted in Douglas County in 2024 (2,583 in 5+ unit buildings).
Forward outlook
- In year one you build about $16k of equity ($1k loan paydown + $15k appreciation (10.0% local appreciation)).
- Douglas County population projected at +28% by 2050 — long-run rental-demand tailwind backs the buy-and-hold thesis.
- At projected returns (10.0% appreciation + 3.2% rent growth), your $42k cash investment doubles in ~3 years — after that, you're playing with house money.
- By year 3, paydown + projected appreciation supports a ~$41k cash-out refi (75% LTV) — recoverable capital for the next deal without selling this one.
Negotiation context
- It's been on market 49 days — a 3% lower offer ($146k) is reasonable based on typical stale-listing flexibility.
- 2 sale attempts since 17y ago with the ask held roughly flat each time — persistent listings suggest the price (not the market) is what's stuck; bring a comps-based counter.
- Current owner paid $27k; list at $150k implies a 458% gain — meaningful room to come down on a strong offer.
Risks & watch-outs
- Watch-outs: built in 1957 — expect roof / HVAC / electrical / plumbing capex.
Questions for the listing agent
- It's been on market 49 days. Have you received any prior offers? Is the seller open to a 3% concession, seller financing, or rate buy-down credit?
- Built in 1957 — when were the roof, HVAC, electrical panel, plumbing, and water heater last replaced?
- Is there a deadline driving the sale (1031 exchange, divorce, estate, relocation)? That informs how much negotiation room exists.
- Crime grade is F in this area — have there been break-ins, vandalism, or insurance claims at this property in the last 3 years? What carrier currently insures it and at what premium?
- What's the average days-on-market for RENTAL listings here right now (not sales)? A rising rental-DOM trend means longer vacancies and softer asking-rent achievability than the comps imply.
- What's the recent tenant-quality profile in this submarket — average credit score on applications, eviction rate, late-payment / NSF rate, and stable-employment percentage? A property-management company in the area should have these aggregated.
- How much new for-sale + rental construction is in the pipeline within 1–3 miles? Heavy new supply typically softens prices + rents 12–24 months out; constrained supply supports both.
Investment metrics
- 1% rule
- 1.06% ✓
- Cap rate
- 8.08%
- Cash-on-cash
- 6.38%
- DSCR
- 1.28
- GRM
- 7.9
CMA / ARV
- ARV (median comp)
- $148,205
- List price
- $150,000
- Delta
- 1.21%
- Verdict
- FAIR
- Comps
- 20 within 1.0 mi
Show comp detail 12 sales within ~0.75 mi
| Address | Dist | Beds/Ba | Sqft | Sold | Price | $/sf | Match |
|---|---|---|---|---|---|---|---|
| 6341 N 37th St | 0.27mi | 3/1.0 | 1,332 (-4%) | 2mo | $155,000 | $116 | 78 |
| 6520 N 33 St | 0.49mi | 3/1.0 | 1,404 (+1%) | 4mo | $150,000 | $107 | 72 |
| 3632 Ellison Ave | 0.27mi | 3/1.0 | 1,513 (+9%) | 3mo | $150,000 | $99 | 70 |
| 5302 N 39th Cir | 0.45mi | 3/2.0 | 1,300 (-6%) | 5mo | $120,000 | $92 | 60 |
| 3071 Arcadia Ave | 0.53mi | 3/1.5 | 1,301 (-6%) | 4mo | $115,000 | $88 | 60 |
| 4013 Newport Ave | 0.46mi | 3/1.5 | 1,257 (-10%) | 4mo | $190,000 | $151 | 57 |
| 4240 Nebraska Ave | 0.46mi | 2/1.5 (-1) | 1,512 (+9%) | 2mo | $166,000 | $110 | 55 |
| 3442 Martin Ave | 0.61mi | 3/1.5 | 1,510 (+9%) | 2mo | $179,900 | $119 | 53 |
| 4429 Redick Ave | 0.61mi | 4/1.0 (+1) | 1,296 (-7%) | 3mo | $145,000 | $112 | 53 |
| 3454 Martin Ave | 0.57mi | 3/2.0 | 1,504 (+8%) | 5mo | $203,000 | $135 | 52 |
| 4740 N 39th St | 0.73mi | 4/2.0 (+1) | 1,524 (+10%) | 1mo | $195,000 | $128 | 40 |
| 3405 Ernst St | 0.71mi | 2/1.0 (-1) | 1,201 (-14%) | 4mo | $155,000 | $129 | 36 |
Match score weights: distance 35% · size 25% · config 20% · recency 20%. Top-matched comps best support the ARV.
Projected returns pro-forma
10.0% appreciation · 3.22% rent growth · sell at horizon
- IRR
- 29.0%
- Equity multiple
- 3.29×
- Total profit
- $96,286
- Equity at exit
- $135,132
- IRR
- 25.3%
- Equity multiple
- 7.50×
- Total profit
- $273,124
- Equity at exit
- $291,417
Cash invested: $42,000 (down + closing). Projections, not guarantees.
Landlord ↔ Tenant lean methodology
- Overall (STATE)
- 83 Strongly Landlord-Friendly
- State Nebraska
- 83 Strongly Landlord-Friendly · R+13
- County
- — inherits STATE
- City
- — inherits STATE
ZIP-level market 68111
- Home prices YoY
- 4.0%
- Rents YoY
- 3.2%
- Active inventory
- 139
- Price-to-rent
- 7.9×
Monthly cashflow live
- Estimated rent
- $1,587 high interval (Pro) →
- Mortgage (P&I)
- −$787
- Tax from tax record
- −$181 /mo · $2,174/yr
- Insurance
- −$62
- HOA
- −$0
- Vacancy / Maint / Mgmt
- −$333
- Net cashflow
- $223
Break-even live
UW: 25.0% down · 7.5% · 30yr · 1.5% tax · 5.0% vac · 8.0% maint · 8.0% mgmt
Financing live
Cash to close
- Down payment
- $37,500
- Closing costs
- $4,500
- Reserves months
- —
- Total cash needed
- —
Loan-product check · same deal, 3 products live
Conventional
25% down · 7.5% · 30yr
- Down + closing
- —
- Monthly P&I
- —
- Monthly cashflow
- —
- DSCR
- —
- Eligible?
- —
Personal DTI + credit; lowest rate.
DSCR
20% down · 8.5% · 30yr
- Down + closing
- —
- Monthly P&I
- —
- Monthly cashflow
- —
- DSCR
- —
- Eligible?
- —
No personal income docs; deal must DSCR.
Hard money
10% down · 12.0% · 12mo
- Down + closing
- —
- Monthly P&I
- —
- Monthly cashflow
- —
- DSCR
- —
- Eligible?
- —
Short-term bridge; refi at stabilization.
Rent comps 19 comps
| Address | Beds | Baths | Sqft | Rent | $/sqft | DOM | Units | Dist |
|---|---|---|---|---|---|---|---|---|
| 3901 Curtis Ave Omaha, NE | 2.0 | 2.5 | 1745 | $1,850 | $1.06 | 3d | 1 | 0.21mi |
| 4018 Bauman Ave Omaha, NE | 3.0 | 1.0 | 925 | $1,380 | $1.49 | 43d | 1 | 0.46mi |
| 4026 Bauman Ave Omaha, NE | 4.0 | 1.0 | 1350 | $1,695 | $1.26 | 43d | 1 | 0.47mi |
| 6124 N 30th St Unit STREET2 Omaha, NE | 2.0 | 1.0 | 1190 | $1,075 | $0.90 | 43d | 1 | 0.64mi |
| 4470 Redman Ave Unit 4470A Omaha, NE | 2.0 | 1.5 | 980 | $1,050 | $1.07 | 10d | 1 | 0.66mi |
| 2873 Kansas Ave Omaha, NE | 3.0 | 2.0 | 1112 | $1,450 | $1.30 | 23d | 1 | 0.72mi |
| 3164 Ida St Omaha, NE | 3.0 | 1.0 | 946 | $1,600 | $1.69 | 2d | 1 | 0.74mi |
| 3164 Ida St Omaha, NE | 3.0 | 1.0 | 946 | $1,600 | $1.69 | 43d | 1 | 0.74mi |
| 3164 Ida St Omaha, NE | 3.0 | 1.0 | 946 | $1,600 | $1.69 | 10d | 1 | 0.74mi |
| 4707 N 40th Ave Omaha, NE | 3.0 | 1.0 | 1337 | $1,500 | $1.12 | 21d | 1 | 0.81mi |
| 3501 Weber Cir Omaha, NE | 3.0 | 2.0 | 1600 | $1,700 | $1.06 | 10d | 1 | 0.85mi |
| 2723 Newport Ave Omaha, NE | 2.0 | 1.0 | 1079 | $1,450 | $1.34 | 2d | 1 | 0.94mi |
| 4657 Camden Ave Omaha, NE | 3.0 | 1.0 | 1250 | $1,500 | $1.20 | 43d | 1 | 0.98mi |
| 3030 Ernst St Omaha, NE | 3.0 | 2.0 | 1500 | $1,500 | $1.00 | 2d | 1 | 0.99mi |
| 2436 Laurel Ave Omaha, NE | 3.0 | 1.0 | 1582 | $1,495 | $0.95 | 23d | 1 | 1.07mi |
| 5348 N 25th St Omaha, NE | 4.0 | 1.0 | 1446 | $1,600 | $1.11 | 43d | 1 | 1.12mi |
| 3366 Craig Ave Omaha, NE | 4.0 | 1.0 | 1250 | $1,511 | $1.21 | 19d | 1 | 1.12mi |
| 4918 Ames Ave Unit 17 Omaha, NE | 2.0 | 1.5 | 1074 | $850 | $0.79 | 23d | 1 | 1.33mi |
| 4852 Boyd St Omaha, NE | 2.0 | 2.0 | 912 | $1,500 | $1.64 | 43d | 1 | 1.42mi |
Listing history 18 events
-
2026-06-18days on market $150,000 Active 49 DOM
-
2026-06-17days on market $150,000 Active 48 DOM
-
2026-06-16days on market $150,000 Active 47 DOM
-
2026-06-15days on market $150,000 Active 46 DOM
-
2026-06-13days on market $150,000 Active 44 DOM
-
2026-06-10days on market $150,000 Active 41 DOM
-
2026-06-09days on market $150,000 Active 40 DOM
-
2026-06-08days on market $150,000 Active 39 DOM
-
2026-06-07days on market $150,000 Active 38 DOM
-
2026-06-03days on market $150,000 Active 34 DOM
-
2026-06-03days on market $150,000 Active 33 DOM
-
2026-06-01days on market $150,000 Active 32 DOM
-
2026-06-01days on market $150,000 Active 31 DOM
-
2026-04-30$150,000 New 283-char remark
-
2010-01-04soldstatus $26,900 192-char remark
Show marketing remark (192 chars)
Calling all buyers willing to do your thing. Potential is here. Sold as is. Needs patch, paint repairs and flooring. Dr. is eating area. Ceiling fans. Walk out basement. Large back yard
-
2009-11-30historical 192-char remark
Show marketing remark (192 chars)
Calling all buyers willing to do your thing. Potential is here. Sold as is. Needs patch, paint repairs and flooring. Dr. is eating area. Ceiling fans. Walk out basement. Large back yard
-
2009-10-22$29,000 192-char remark
Show marketing remark (192 chars)
Calling all buyers willing to do your thing. Potential is here. Sold as is. Needs patch, paint repairs and flooring. Dr. is eating area. Ceiling fans. Walk out basement. Large back yard
-
2001-02-16soldstatus $64,000
ⓘ Source: listings_history table (triggers on properties + properties_extension) + one-shot
backfill from property_details.listing_events for pre-trigger history.
Tax reassessment forecast NE · Resets to sale price
- Current annual tax
- $2,174 · $181/mo
- Projected year-2 tax
- $2,595 · $216/mo
- Expected delta
- +$421/yr (+$35/mo · 19.4%)
ⓘ Screening estimate from a state-policy table — verify with the county assessor before closing.
Climate risk First Street
- Flood 1/10 Low FEMA zone X (unshaded) · 0% chance over 30 yrs
- Wildfire 1/10 Low
- Heat 3/10 Moderate 7 d/yr ≥105°F today · 15 d/yr by 30 yrs out
- Wind 2/10 Low
- Air quality 2/10 Low 0 unhealthy d/yr today · 1 by 30 yrs out
Nearby sold comps map
Loading sold comps map…
Walkable amenities ~0.75 mi
Loading nearby amenities…
Taxation est. · year 1
- Rental income
- $19,041
- − Mortgage interest
- −$8,402
- − Property taxes
- −$2,174
- − Insurance
- −$750
- − Repairs & maintenance
- −$1,523
- − Management
- −$1,523
- − Depreciation
- −$4,364
- Taxable income
- $305
- Est. tax owed @ 24.0%
- −$73
- After-tax cash flow
- $2,606/yr
For passive investors: Depreciation is non-cash, so a rental often shows a tax loss while cash-flowing — sheltering income. Rental losses are passive: they offset passive income freely, and up to $25,000/yr can offset ordinary (W-2) income if you actively participate and your MAGI is under $100k (phasing out to $0 by $150k); unused losses carry forward. On sale, claimed depreciation is recaptured at up to 25%, and gains may owe capital-gains tax (a 1031 exchange can defer both). Figures are a year-1 estimate at your 24.0% rate — not tax advice; consult a CPA.
Schools (NCES district)
- District
- Omaha Public Schools
- NCES district ID
- 3174820
- Math proficiency
- 20% ▼ -10.00%
- Reading proficiency
- 28% ▼ -5.00%
- Median HH income
- $46,039
- Composite
- 20.83/100
- National rank
- #8502
- State rank
- #110 of 111 in NE
Livability — Omaha
- Score
- 84/100
- State rank
- #7
- US rank
- #663
Category grades
Schools grade is shown separately in the Schools card above.
Census & demographics
- Census place
- Omaha, NE
- County
- Douglas County · 538,646 people
- City population
- 552,986
- Metro
- Omaha-Council Bluffs, NE-IA
- Population (ZIP)
- 24,210
- Household income
- $42,185
- Rent vs Own
- Severe rent burden
- 1913.0
Population outlook (Douglas County) Hauer SSP2
- Today (2025)
- 625,245 people
- By 2030
- 661,613 · +5.8%
- By 2040
- 732,395 · +17.1%
- By 2050
- 801,988 · +28.3%
- By 2075
- 968,637 · +54.9%
- By 2100
- 1,101,871 · +76.2%
Race, ethnicity, and origin ACS 2023
- Neighborhood character
- Diverse neighborhood (Simpson 0.65)
- Race & ethnicity
- Black 52% Hispanic / Latino 21% White 17% Two or more races 15% Asian 3% Native American 1%
- Hispanic origin (detail)
- Mexican 14%
- Common ancestry
- Ukrainian 3% Lithuanian 0%
- Foreign-born
- 14% · Canada, Philippines
- Languages at home
- 75% English-only · Spanish 16% Other Asian/Pacific 3% French/Haitian/Cajun 1%
Political lean MEDSL · Douglas
- 2024 margin
- D (+10.2) · D 54.4% · R 44.2% · Other 1.4%
- 2008→2024 swing
- +5.5pp toward D · 2008: 4.6pp · 2024: 10.2pp
- All cycles
- 2024: D+10.2 2020: D+11.3 2016: D+1.4 2012: R+4.3 2008: D+4.6
Not yet ingested
- Civics
- —
Market trends
- HPI YoY
- ▲ 13.82%
- Current HPI
- 358.7174
- Rent YoY
- ▲ 3.22%
- Metro
- Omaha-Council Bluffs, NE-IA
- State GDP YoY
- ▲ 0.68%
- F500 in state
- 2
Industry mix (Fortune 500 HQ in NE)
| Industry | F500 HQs | Revenue |
|---|---|---|
| Conglomerate | 1 | $371B |
|
||
Price history
+134.4% since first listed5 events — show timeline
- 2026-04-30 Listed $150,000 GPRMLS
- 2010-01-04 Sold (MLS) $26,900 GPRMLS
- 2009-11-30 Listing Removed — GPRMLS
- 2009-10-22 Listed $29,000 GPRMLS
- 2001-02-16 Sold (Public Records) $64,000 Public Records
Property tax history
+5.7%/yrLatest (2025): $2,174 · +7.6% YoY. Source: county tax records.
Cash-flow waterfall
monthlySold comps — $/sqft
last 12 mo · ≤1 miLoading sold comps…