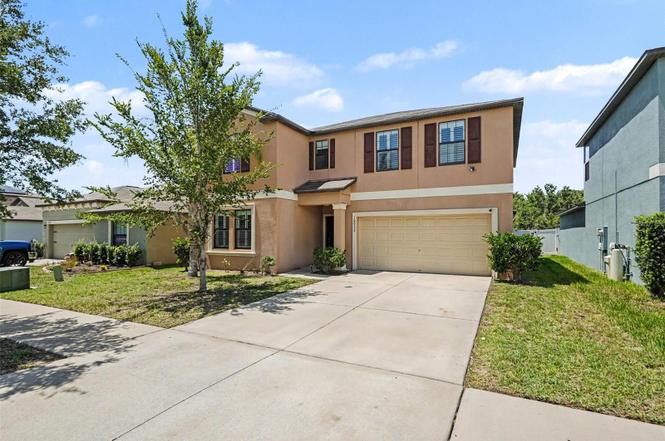
10022 Carloway Hills Dr · Balm, FL
Flood risk 1/10 · Minimal
- FEMA flood zone
- X (unshaded)
- Chance of flooding over 30 yrs
- 0.0%
- Est. flood insurance / yr
- $507 – $1,088
Fire risk 5/10 · Moderate
- Est. fire insurance / yr
- $947 – $1,759
Heat risk 10/10 · Severe
- Hot days now (above 109°F)
- 7 days/yr
- Hot days in 30 yrs
- 27 days/yr
Wind risk 10/10 · Severe
- Chance of severe wind over 30 yrs
- 99.0%
Air-quality risk 3/10 · Minor
- Unhealthy air days now
- 3 days/yr
- Unhealthy air days in 30 yrs
- 3 days/yr
Risk factors via First Street. Map © Google.
Why this score? — see what drove the D grade
The composite is a weighted blend of 9 inputs, each scored 0–100. Each bar is that input's sub-score; the figure is the points it added to the 100-point composite (weight × sub-score).
- Cash flow +11.1/30.0
- ARV discount +7.5/15.0
- Schools +4.2/10.0
- Appreciation +3.8/10.0
- 1% rule +3.4/10.0
- DSCR +3.2/10.0
- Livability +3.2/5.0
- Condition / age +2.5/5.0
- Rent growth +1.9/5.0
$425,000
🖨 Deal sheet (PDF) 📄 Offer letter ✓ Due diligence
Listing remarks MLS
Under Construction-The Trenton will give you all the space you and your family need. At 3,326 square feet, this six bedroom three bath home provides comfort and convenience. This unique layout has the master suite and bathroom downstairs, providing the ultimate privacy. An additional bedroom and a flex room are downstairs, making it easy for night owls to have their space without disturbing sleeping family members. Four main bedrooms are upstairs, as well as a huge loft, perfect for game or movie nights. You will find the Trenton to be the perfect home for your large family, or to easily entertain and accommodate overnight guests.
Key facts
- Open floor plan
- Community center
- Center island
Tags
Property features AI
Finance
- Other: Property type: Residential - Single family; Zoning: RES SF; Living area about 3,362 sq ft; total building area about 4,018 sq ft; Lot about 0.12 acres (approx. 50 x 110)
- Financial info: Other annual assessment approximately $2,275
- HOA & community: HOA managed by Citadel Property Management Group; Monthly HOA fee approximately $5 (about $60 annually); Community amenities: fitness center, pool, basketball court, sidewalks; Pets allowed
Exterior
- Parking: Driveway; Attached garage with garage door opener; 2-car garage
- Utilities: Public water; Public sewer; Electricity connected; Water connected; Sewer connected; Irrigation equipment
- Home design: Single family residence; Two-story home; South facing; Completed condition; Slab foundation
- Construction: Block and stucco construction; Shingle roof; Built on slab foundation
- Exterior features: Covered screened patio/porch; Exterior lighting; Sidewalks; Sliding doors; Vinyl fencing; Mature landscaping with oak trees; Conservation area nearby; Level, paved lot
Interior
- Kitchen: Dishwasher; Disposal; Microwave; Range; Refrigerator; Solid surface counters; Eat-in kitchen
- Bedrooms: 6 bedrooms
- Flooring: Carpet; Ceramic tile
- Bathrooms: 3 full bathrooms
- Heating & cooling: Central heating; Electric heating; Heat pump; Central air conditioning; Ceiling fans
- Interior features: Ceiling fans; Eat-in kitchen; Kitchen/family room combo; Open floorplan; Solid surface counters; Walk-in closets
- Laundry & utility: Laundry room with washer and dryer hookups; Electric dryer hookup; Inside laundry
Neighborhood map
What this means for you Summary
Snapshot
- This is a 6-bed/3.0-bath single-family listed at $425k.
Deal economics
- At list price, monthly cash flow is $-174 ($-2k/yr) — negative.
- To cash-flow at today's rent, offer at most $394k (7.2% below list).
- To meet the 1% rule (rent ≥ 1% of price), the offer needs to be $356k (16.2% below list).
- Recommended offer: $356k (16.2% below list) — sets the bar for 1% rule.
Location & tenants
- Location reads 63/100 on livability (#742 in FL) — a middle-class / working-renter tenant base. Strengths: crime A+, employment A+, housing A+; Watch: amenities F, commute F, health & safety F.
- Hillsborough (suburban): math 47% / reading 50% proficiency, ranked #41 of 73 in FL (top 56%) — families likely to look elsewhere, expect single-tenant / working-renter base with shorter leases.
- Zoned schools: Belmont Elementary School (math 42% / reading 45%, grade F, #1,345 of 2,144 statewide, top 64%, 987 students, 44% FRL); Shields Middle School (math 29% / reading 27%, grade F, #486 of 571 statewide, top 86%, 1,867 students, 68% FRL); Jule F Sumner High School (math 43% / reading 43%, grade F, #255 of 667 statewide, top 39%, 3,827 students, 43% FRL) — zoned schools at 52% FRL track the district average.
- Market conditions: Rents soft (-2.5%/yr); 689 active listings in the ZIP; 3 comparable units currently listed for rent nearby; rentals at typical pace (median 26d on market — plan ~3-4 weeks tenant-placement turnaround); solid renter incomes; 9,053 units permitted in Hillsborough County in 2024 (4,555 in 5+ unit buildings).
- This rent runs 44% of the median local income ($98k/yr) — at the standard rent-burdened threshold; future hikes will face affordability resistance.
Forward outlook
- Local home prices are declining (-2.4%/yr); year-one equity from $3k of loan paydown is wiped out by about $10k of value loss. Plan a longer hold.
- Hillsborough County population projected at +37% by 2050 — long-run rental-demand tailwind backs the buy-and-hold thesis.
Negotiation context
- Only 4 days on market — expect competitive offers; lowballing is unlikely to land.
- 3 sale attempts since 8y ago with the ask held roughly flat each time — persistent listings suggest the price (not the market) is what's stuck; bring a comps-based counter.
- Current owner paid $255k; list at $425k implies a 67% gain — meaningful room to come down on a strong offer.
Risks & watch-outs
- Climate carrying-cost: severe wind risk, 99% chance of damaging wind over 30y; moderate wildfire risk; extreme-heat days projected 7→27/yr by 2055 (HVAC capex compounding) — expect insurance premiums to compound above CPI over the hold.
Questions for the listing agent
- What do current leases actually rent for vs. the listed asking? Can we see a recent rent roll and the last 12 months of T-12 income?
- What does the HOA fee cover, when was the last increase, and are there any pending special assessments or reserve-fund shortfalls?
- Is there a deadline driving the sale (1031 exchange, divorce, estate, relocation)? That informs how much negotiation room exists.
- Schools are F-rated, which usually means shorter tenancies and higher turnover. Who's the typical renter profile here, and what's been the actual vacancy rate?
- The area grade is low — what's the realistic commute time and amenity access for the typical tenant pool here? Any planned neighborhood developments (good or bad) we should know about?
- What's the average days-on-market for RENTAL listings here right now (not sales)? A rising rental-DOM trend means longer vacancies and softer asking-rent achievability than the comps imply.
- What's the recent tenant-quality profile in this submarket — average credit score on applications, eviction rate, late-payment / NSF rate, and stable-employment percentage? A property-management company in the area should have these aggregated.
- How much new for-sale + rental construction is in the pipeline within 1–3 miles? Heavy new supply typically softens prices + rents 12–24 months out; constrained supply supports both.
Investment metrics
- 1% rule
- 0.84% ✗
- Cap rate
- 5.80%
- Cash-on-cash
- -1.76%
- DSCR
- 0.92
- GRM
- 9.9
CMA / ARV
No comps found within radius.
Projected returns pro-forma
-2.35% appreciation · 0.0% rent growth · sell at horizon
- IRR
- -18.1%
- Equity multiple
- 0.34×
- Total profit
- $-78,586
- Equity at exit
- $75,851
- IRR
- -16.2%
- Equity multiple
- 0.06×
- Total profit
- $-112,442
- Equity at exit
- $58,550
Cash invested: $119,000 (down + closing). Projections, not guarantees.
Landlord ↔ Tenant lean methodology
- Overall (STATE)
- 87 Strongly Landlord-Friendly
- State Florida
- 87 Strongly Landlord-Friendly · R+3
- County
- — inherits STATE
- City
- — inherits STATE
ZIP-level market 33598
- Home prices YoY
- -0.9%
- Rents YoY
- -2.5%
- Active inventory
- 689
- Price-to-rent
- 9.9×
Monthly cashflow live
- Estimated rent
- $3,563 medium interval (Pro) →
- Mortgage (P&I)
- −$2,229
- Tax from tax record
- −$578 /mo · $6,934/yr
- Insurance
- −$177
- HOA
- −$5
- Vacancy / Maint / Mgmt
- −$748
- Net cashflow
- $-174
Break-even live
Sensitivity live
| Price | -10% $66 | -5% $-54 | +0% $-174 | +5% $-295 | +10% $-415 |
|---|---|---|---|---|---|
| Rent | -10% $-456 | -5% $-315 | +0% $-174 | +5% $-33 | +10% $107 |
| Rate | -1.0pp $40 | -0.5pp $-66 | base $-174 | +0.5pp $-284 | +1.0pp $-396 |
UW: 25.0% down · 7.5% · 30yr · 1.5% tax · 5.0% vac · 8.0% maint · 8.0% mgmt
Financing live
Cash to close
- Down payment
- $106,250
- Closing costs
- $12,750
- Reserves months
- —
- Total cash needed
- —
Loan-product check · same deal, 3 products live
Conventional
25% down · 7.5% · 30yr
- Down + closing
- —
- Monthly P&I
- —
- Monthly cashflow
- —
- DSCR
- —
- Eligible?
- —
Personal DTI + credit; lowest rate.
DSCR
20% down · 8.5% · 30yr
- Down + closing
- —
- Monthly P&I
- —
- Monthly cashflow
- —
- DSCR
- —
- Eligible?
- —
No personal income docs; deal must DSCR.
Hard money
10% down · 12.0% · 12mo
- Down + closing
- —
- Monthly P&I
- —
- Monthly cashflow
- —
- DSCR
- —
- Eligible?
- —
Short-term bridge; refi at stabilization.
Rent comps 3 comps
| Address | Beds | Baths | Sqft | Rent | $/sqft | DOM | Units | Dist |
|---|---|---|---|---|---|---|---|---|
| 14153 Arbor Pines Dr Riverview, FL | 5.0 | 2.5 | 2889 | $3,586 | $1.24 | 26d | 1 | 1.18mi |
| 14112 Poke Ridge Dr Riverview, FL | 5.0 | 3.5 | 3467 | $3,200 | $0.92 | 26d | 1 | 1.29mi |
| 11167 Leland Groves Dr Riverview, FL | 5.0 | 3.0 | 2526 | $3,500 | $1.39 | 26d | 1 | 1.36mi |
HOA detail
- Monthly dues
- $5 · $60/yr
Listing history 3 events
-
2026-06-21days on market $425,000 Active 4 DOM
-
2026-06-17remarks 693-char remark
-
2026-06-17$425,000 Active 1 DOM
ⓘ Source: listings_history table (triggers on properties + properties_extension) + one-shot
backfill from property_details.listing_events for pre-trigger history.
Tax reassessment forecast FL · Resets to sale price
- Current annual tax
- $6,934 · $578/mo
- Projected year-2 tax
- $6,934 · $578/mo
- Expected delta
- $0/yr ($0/mo · 0.0%)
ⓘ Screening estimate from a state-policy table — verify with the county assessor before closing.
Climate risk First Street
- Flood 1/10 Low FEMA zone X (unshaded) · 0% chance over 30 yrs
- Wildfire 5/10 Major
- Heat 10/10 Extreme 7 d/yr ≥109°F today · 27 d/yr by 30 yrs out
- Wind 10/10 Extreme 99% chance of damaging wind over 30 yrs
- Air quality 3/10 Moderate 3 unhealthy d/yr today · 3 by 30 yrs out
Nearby sold comps map
Loading sold comps map…
Walkable amenities ~0.75 mi
Loading nearby amenities…
Taxation est. · year 1
- Rental income
- $42,751
- − Mortgage interest
- −$23,807
- − Property taxes
- −$6,934
- − Insurance
- −$2,125
- − Repairs & maintenance
- −$3,420
- − Management
- −$3,420
- − HOA
- −$60
- − Depreciation
- −$12,364
- Taxable loss
- −$9,378
- Est. tax savings @ 24.0%
- +$2,251
- After-tax cash flow
- $160/yr
For passive investors: Depreciation is non-cash, so a rental often shows a tax loss while cash-flowing — sheltering income. Rental losses are passive: they offset passive income freely, and up to $25,000/yr can offset ordinary (W-2) income if you actively participate and your MAGI is under $100k (phasing out to $0 by $150k); unused losses carry forward. On sale, claimed depreciation is recaptured at up to 25%, and gains may owe capital-gains tax (a 1031 exchange can defer both). Figures are a year-1 estimate at your 24.0% rate — not tax advice; consult a CPA.
Schools (NCES district)
- District
- Hillsborough
- NCES district ID
- 1200870
- Math proficiency
- 47% ▼ -8.00%
- Reading proficiency
- 50% ▼ -4.00%
- Median HH income
- $50,622
- Composite
- 41.6/100
- National rank
- #3435
- State rank
- #41 of 73 in FL
Livability — Balm
- Score
- 63/100
- State rank
- #742
- US rank
- #16016
Category grades
Schools grade is shown separately in the Schools card above.
Census & demographics
- Census place
- Balm, FL
- County
- Hillsborough County · 1,540,968 people
- City population
- 196
- Metro
- Tampa-St. Petersburg-Clearwater, FL
- Population (ZIP)
- 32,820
- Household income
- $97,520
- Rent vs Own
- Severe rent burden
- 149.0
Population outlook (Hillsborough County) Hauer SSP2
- Today (2025)
- 1,607,022 people
- By 2030
- 1,733,968 · +7.9%
- By 2040
- 1,979,565 · +23.2%
- By 2050
- 2,203,427 · +37.1%
- By 2075
- 2,667,893 · +66.0%
- By 2100
- 2,891,558 · +79.9%
Race, ethnicity, and origin ACS 2023
- Neighborhood character
- Diverse neighborhood (Simpson 0.67)
- Race & ethnicity
- White 40% Hispanic / Latino 39% Black 14% Two or more races 11% Asian 2%
- Hispanic origin (detail)
- Mexican 26% Puerto Rican 3% Cuban 1%
- Common ancestry
- Romanian 2% Scotch-Irish 2% Lithuanian 1%
- Foreign-born
- 23% · Canada, Jamaica, Guatemala
- Languages at home
- 62% English-only · Spanish 35% Other Indo-European 1% Arabic 1%
Political lean MEDSL · Hillsborough
- 2024 margin
- Toss-up / Even · D 47.8% · R 50.9% · Other 1.3%
- 2008→2024 swing
- -10.2pp toward R · 2008: 7.1pp · 2024: -3.1pp
- All cycles
- 2024: R+3.1 2020: D+6.9 2016: D+6.8 2012: D+6.7 2008: D+7.1
Not yet ingested
- Civics
- —
Market trends
- HPI YoY
- ▼ -2.35%
- Current HPI
- 271.8552
- Rent YoY
- ▼ -2.50%
- Metro
- Tampa-St. Petersburg-Clearwater, FL
- State GDP YoY
- ▲ 3.28%
- F500 in state
- 36
Industry mix (Fortune 500 HQ in FL)
| Industry | F500 HQs | Revenue |
|---|---|---|
| Industrial Technology | 2 | $29B |
|
||
| Insurance | 2 | $17B |
|
||
| Retail | 1 | $60B |
|
||
| Technology Distribution | 1 | $58B |
|
||
| Homebuilding | 1 | $35B |
|
||
| Technology Manufacturing | 1 | $35B |
|
||
Price history
+65.0% since first listed11 events — show timeline
- 2026-06-17 Listed $425,000 Stellar MLS as Distributed by MLS Grid
- 2018-06-20 Sold (MLS) $254,990 Stellar MLS as Distributed by MLS Grid
- 2018-05-16 Pending — Stellar MLS as Distributed by MLS Grid
- 2018-05-10 Price Changed $254,990 Stellar MLS as Distributed by MLS Grid
- 2018-04-30 Price Changed $258,490 Stellar MLS as Distributed by MLS Grid
- 2018-04-30 Relisted — Stellar MLS as Distributed by MLS Grid
- 2018-04-11 Pending — Stellar MLS as Distributed by MLS Grid
- 2018-03-24 Pending — Stellar MLS as Distributed by MLS Grid
- 2018-03-22 Pending — Stellar MLS as Distributed by MLS Grid
- 2018-02-01 Pending — Stellar MLS as Distributed by MLS Grid
- 2018-01-18 Listed $257,590 Stellar MLS as Distributed by MLS Grid
Property tax history
+16.9%/yrLatest (2025): $6,934 · +7.7% YoY. Source: county tax records.
Cash-flow waterfall
monthlySold comps — $/sqft
last 12 mo · ≤1 miLoading sold comps…