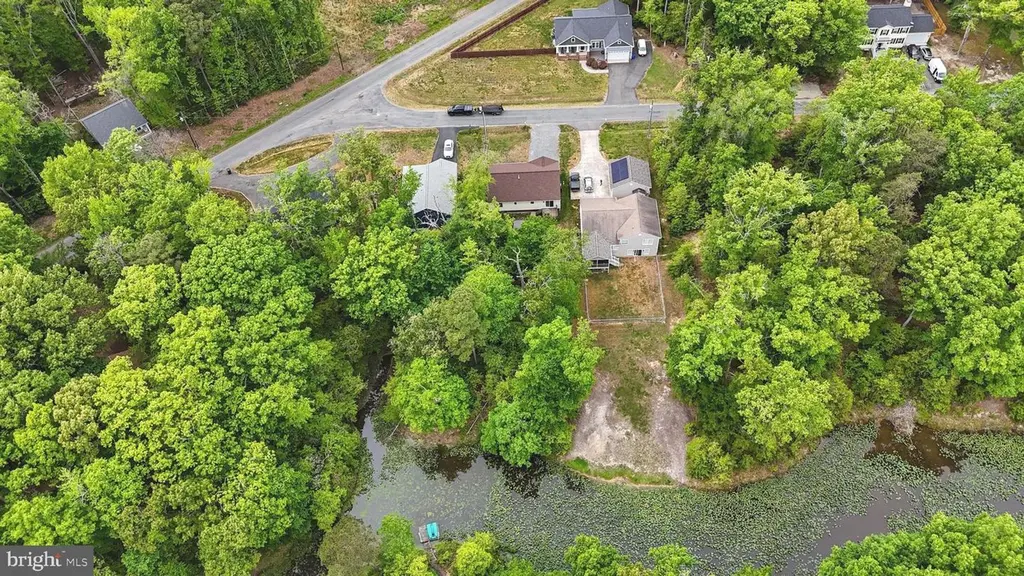
32 Placid Rd · Colonial Beach, VA
Flood risk 9/10 · Severe
- FEMA flood zone
- X (unshaded)
- Chance of flooding over 30 yrs
- 0.99%
- Est. flood insurance / yr
- $507 – $1,088
Fire risk 4/10 · Minor
- Est. fire insurance / yr
- $666 – $1,236
Heat risk 8/10 · Major
- Hot days now (above 108°F)
- 7 days/yr
- Hot days in 30 yrs
- 16 days/yr
Wind risk 6/10 · Moderate
- Chance of severe wind over 30 yrs
- 27.0%
Air-quality risk 2/10 · Minimal
- Unhealthy air days now
- 2 days/yr
- Unhealthy air days in 30 yrs
- 2 days/yr
Risk factors via First Street. Map © Google.
Why this score? — see what drove the D grade
The composite is a weighted blend of 9 inputs, each scored 0–100. Each bar is that input's sub-score; the figure is the points it added to the 100-point composite (weight × sub-score).
- Cash flow +13.6/30.0
- ARV discount +9.7/15.0
- DSCR +4.1/10.0
- Schools +4.0/10.0
- Livability +3.0/5.0
- 1% rule +2.9/10.0
- Rent growth +2.5/5.0
- Condition / age +2.5/5.0
- Appreciation +0.0/10.0
$299,999
🖨 Deal sheet (PDF) 📄 Offer letter ✓ Due diligence
Listing remarks
What if your backyard could be your place to fish, kayak, relax, and unwind? Welcome to 32 Placid Rd, 2022-built Colonial Beach home in the Placid Bay area backing to Maddox Creek What makes this home truly stand out is the setting — the property backs to Maddox Creek, offering direct backyard access for fishing, kayaking, nature watching, and quiet evenings surrounded by wooded privacy. Whether you are looking for a full-time residence, weekend getaway, or low-maintenance coastal retreat, this home delivers the lifestyle without the stress of an older waterfront property. Inside, you’ll find a comfortable and functional layout with open living space, a spacious kitchen, private
Key facts
- 0.25 acre lot
- 4 parking spots
- Built 2022
Property features AI
Finance
- Other: Fee simple ownership; Property in excellent condition; Ground rent paid annually
- HOA & community: Community boat ramp; Community center; HOA covers pier/dock maintenance and common area maintenance
Exterior
- Parking: Gravel driveway; Driveway parking; Four driveway/parking spaces (total 4 spaces)
- Utilities: Public or community water available; Public sewer; Sewer available, water available; Phone and cable available; Electric available; Electric hot water
- Home design: Detached property; Estimated year built; Architectural shingle roof; Vinyl siding; Crawl space foundation; Vinyl-clad double-hung windows; Located on a creek (Mattox Creek)
- Construction: Vinyl siding construction; Architectural shingle roof; Crawl space foundation; Detached structure
- Exterior features: Deck(s); Exterior lighting; Shed; Private setting with landscaping; Backs to trees; Stream/creek on property; Tidal wetland; Fishing available; Has water view; 50 feet of water frontage
Interior
- Kitchen: Built-in microwave; Dishwasher; Stove; Refrigerator; Icemaker; Exhaust fan; Stainless steel appliances; Energy-efficient appliances; Electric water heater
- Bedrooms: Master bedroom; Bedroom 2; Bedroom 3; Three bedrooms on the main level
- Flooring: Luxury vinyl tile; Carpet
- Bathrooms: Two full bathrooms (both on the main level)
- Heating & cooling: Energy Star heating system with heat pump(s); Energy Star cooling system with heat pump(s); Electric heating and cooling; 200+ amp electric service
- Interior features: Open floor plan; Ceiling fans; Chair railings; Sliding glass door; Six-panel doors; Drywall walls and ceilings; Entry-level bedroom; Family room off kitchen; No basement
- Laundry & utility: Main-floor laundry hookups
Neighborhood map
What this means for you Summary
Snapshot
- This is a 3-bed/2.0-bath single-family listed at $300k.
Deal economics
- At list price, monthly cash flow is $-52 ($-627/yr) — negative.
- To cash-flow at today's rent, offer at most $291k (3.1% below list).
- To meet the 1% rule (rent ≥ 1% of price), the offer needs to be $238k (20.6% below list).
- Recommended offer: $238k (20.6% below list) — sets the bar for 1% rule.
- Cap rate 6.3% vs local median 4.5% in Colonial Beach — top-decile yield for the area; either an underpriced asset or a hidden risk that comps aren't pricing in. Stress-test before assuming the spread holds.
Location & tenants
- Location reads 59/100 on livability (#460 in VA) — a working-class tenant base; expect higher turnover. Strengths: crime B, cost of living B; Watch: amenities F, commute F, health & safety F.
- Westmoreland County Public School District (rural): math 34% / reading 59% proficiency, ranked #105 of 131 in VA (top 80%) — families likely to look elsewhere, expect single-tenant / working-renter base with shorter leases; 64% free/reduced lunch — lower-income household profile, screen leases tightly.
- Zoned schools: Washington District Elementary (math 32% / reading 52%, grade F, #866 of 1,108 statewide, top 80%, 385 students, 100% FRL); Montross Middle (math 38% / reading 58%, grade C-, #247 of 342 statewide, top 74%, 309 students, 101% FRL); Westmoreland High (math 32% / reading 82%, grade C, #263 of 319 statewide, top 84%, 486 students, 100% FRL) — zoned schools average 100% FRL vs 64% district-wide (36 pts higher); higher-poverty schools than district average — tighter screening recommended.
- Market conditions: 195 active listings in the ZIP; 5 comparable units currently listed for rent nearby; rentals at typical pace (median 16d on market — plan ~3-4 weeks tenant-placement turnaround); 40% of comp listings sitting > 30 days — soft ceiling on asking rent; 220 units permitted in Westmoreland County in 2024 (0 in 5+ unit buildings).
- This rent runs 44% of the median local income ($65k/yr) — at the standard rent-burdened threshold; future hikes will face affordability resistance.
Forward outlook
- Local home prices are declining (-3.0%/yr); year-one equity from $2k of loan paydown is wiped out by about $9k of value loss. Plan a longer hold.
- Westmoreland County population projected to shrink 7% by 2050 — rents likely to lag national; underwrite the cash flow, not the appreciation.
Negotiation context
- It's been on market 51 days — a 3% lower offer ($291k) is reasonable based on typical stale-listing flexibility.
Risks & watch-outs
- Watch-outs: flood insurance adds $66/mo.
- Climate carrying-cost: severe flood risk; major wind risk, 27% chance of damaging wind over 30y; extreme-heat days projected 7→16/yr by 2055 (HVAC capex compounding) — expect insurance premiums to compound above CPI over the hold.
Questions for the listing agent
- What do current leases actually rent for vs. the listed asking? Can we see a recent rent roll and the last 12 months of T-12 income?
- It's been on market 51 days. Have you received any prior offers? Is the seller open to a 21% concession, seller financing, or rate buy-down credit?
- What's the actual annual flood-insurance premium (NFIP or private), and is the property in a SFHA with mandatory coverage?
- Is there a deadline driving the sale (1031 exchange, divorce, estate, relocation)? That informs how much negotiation room exists.
- Schools are B-rated — typically a magnet for longer-tenancy family renters. What's the average tenant stay here, and is there a school-zone premium baked into asking?
- The area grade is low — what's the realistic commute time and amenity access for the typical tenant pool here? Any planned neighborhood developments (good or bad) we should know about?
- What's the average days-on-market for RENTAL listings here right now (not sales)? A rising rental-DOM trend means longer vacancies and softer asking-rent achievability than the comps imply.
- What's the recent tenant-quality profile in this submarket — average credit score on applications, eviction rate, late-payment / NSF rate, and stable-employment percentage? A property-management company in the area should have these aggregated.
- How much new for-sale + rental construction is in the pipeline within 1–3 miles? Heavy new supply typically softens prices + rents 12–24 months out; constrained supply supports both.
Investment metrics
- 1% rule
- 0.79% ✗
- Cap rate
- 6.35%
- Cash-on-cash
- 0.20%
- DSCR
- 1.01
- GRM
- 10.5
CMA / ARV
- ARV (median comp)
- $315,332
- List price
- $299,999
- Delta
- -4.86%
- Verdict
- FAIR
- Comps
- 20 within 1.0 mi
Show comp detail 12 sales within ~0.75 mi
| Address | Dist | Beds/Ba | Sqft | Sold | Price | $/sf | Match |
|---|---|---|---|---|---|---|---|
| 633 Shorewood Dr | 0.18mi | 3/2.0 | 1,420 (-5%) | 2mo | $367,000 | $258 | 81 |
| 249 Wildwood Rd | 0.12mi | 3/2.0 | 1,296 (-14%) | 1mo | $359,000 | $277 | 71 |
| 62 Salina Ln | 0.41mi | 3/2.0 | 1,575 (+5%) | 3mo | $345,000 | $219 | 70 |
| 46 Salina Ln | 0.41mi | 3/2.0 | 1,575 (+5%) | 4mo | $339,000 | $215 | 69 |
| 497 Circle Ln | 0.57mi | 3/2.0 | 1,552 (+4%) | 0mo | $365,000 | $235 | 67 |
| 192 Woodmount Dr | 0.56mi | 3/3.0 | 1,552 (+4%) | 3mo | $368,637 | $238 | 62 |
| 204 Woodmount Dr | 0.54mi | 3/2.5 | 1,416 (-6%) | 3mo | $365,900 | $258 | 61 |
| 261 Azure Dr | 0.31mi | 3/2.0 | 1,288 (-14%) | 2mo | $311,000 | $241 | 61 |
| 339 Azure Dr | 0.30mi | 3/2.0 | 1,288 (-14%) | 3mo | $310,000 | $241 | 60 |
| 228 Dale Dr | 0.46mi | 3/2.0 | 1,334 (-11%) | 1mo | $335,000 | $251 | 59 |
| 84 Pinewood Ln | 0.40mi | 3/2.0 | 1,300 (-13%) | 1mo | $324,900 | $250 | 58 |
| 784 Lakeview Dr | 0.64mi | 3/2.0 | 1,334 (-11%) | 4mo | $330,000 | $247 | 49 |
Match score weights: distance 35% · size 25% · config 20% · recency 20%. Top-matched comps best support the ARV.
Projected returns pro-forma
-3.0% appreciation · 3.0% rent growth · sell at horizon
- IRR
- -17.6%
- Equity multiple
- 0.38×
- Total profit
- $-51,991
- Equity at exit
- $44,731
- IRR
- -9.7%
- Equity multiple
- 0.41×
- Total profit
- $-49,760
- Equity at exit
- $25,938
Cash invested: $84,000 (down + closing). Projections, not guarantees.
Landlord ↔ Tenant lean methodology
- Overall (STATE)
- 55 Moderately Landlord-Leaning
- State Virginia
- 55 Moderately Landlord-Leaning · D+2
- County
- — inherits STATE
- City
- — inherits STATE
ZIP-level market 22443
- Active inventory
- 195
- Price-to-rent
- 10.5×
Monthly cashflow live
- Estimated rent
- $2,383 high interval (Pro) →
- Mortgage (P&I)
- −$1,573
- Tax from tax record
- −$170 /mo · $2,038/yr
- Insurance
- −$125
- Flood insurance flood zone
- −$66 /mo · $798/yr
- HOA
- −$0
- Vacancy / Maint / Mgmt
- −$500
- Net cashflow
- $-52
Break-even live
Sensitivity live
| Price | -10% $118 | -5% $33 | +0% $-52 | +5% $-137 | +10% $-222 |
|---|---|---|---|---|---|
| Rent | -10% $-240 | -5% $-146 | +0% $-52 | +5% $42 | +10% $136 |
| Rate | -1.0pp $99 | -0.5pp $24 | base $-52 | +0.5pp $-130 | +1.0pp $-209 |
UW: 25.0% down · 7.5% · 30yr · 1.5% tax · 5.0% vac · 8.0% maint · 8.0% mgmt
Financing live
Cash to close
- Down payment
- $75,000
- Closing costs
- $9,000
- Reserves months
- —
- Total cash needed
- —
Loan-product check · same deal, 3 products live
Conventional
25% down · 7.5% · 30yr
- Down + closing
- —
- Monthly P&I
- —
- Monthly cashflow
- —
- DSCR
- —
- Eligible?
- —
Personal DTI + credit; lowest rate.
DSCR
20% down · 8.5% · 30yr
- Down + closing
- —
- Monthly P&I
- —
- Monthly cashflow
- —
- DSCR
- —
- Eligible?
- —
No personal income docs; deal must DSCR.
Hard money
10% down · 12.0% · 12mo
- Down + closing
- —
- Monthly P&I
- —
- Monthly cashflow
- —
- DSCR
- —
- Eligible?
- —
Short-term bridge; refi at stabilization.
Rent comps 5 comps
| Address | Beds | Baths | Sqft | Rent | $/sqft | DOM | Units | Dist |
|---|---|---|---|---|---|---|---|---|
| 314 Lake Dr Colonial Beach, VA | 4.0 | 2.0 | 1850 | $2,350 | $1.27 | 16d | 1 | 0.18mi |
| 47 Birch Ln Colonial Beach, VA | 3.0 | 2.0 | 1300 | $2,545 | $1.96 | 16d | 1 | 0.45mi |
| 236 Meadow View Ln Colonial Beach, VA | 3.0 | 2.5 | 1600 | $2,100 | $1.31 | 16d | 1 | 0.47mi |
| 14 Azalea Way Colonial Beach, VA | 3.0 | 2.0 | 1311 | $2,250 | $1.72 | 45d | 1 | 0.54mi |
| 990 Ebb Tide Dr Colonial Beach, VA | 3.0 | 2.5 | 1632 | $2,445 | $1.50 | 45d | 1 | 1.37mi |
Listing history 21 events
-
2026-06-21days on market $299,999 Active 51 DOM
-
2026-06-18days on market $299,999 Active 48 DOM
-
2026-06-17days on market $299,999 Active 47 DOM
-
2026-06-16days on market $299,999 Active 46 DOM
-
2026-06-15days on market $299,999 Active 45 DOM
-
2026-06-14days on market $299,999 Active 43 DOM
-
2026-06-13days on market $299,999 Active 42 DOM
-
2026-06-10days on market $299,999 Active 40 DOM
-
2026-06-09days on market $299,999 Active 39 DOM
-
2026-06-08days on market $299,999 Active 38 DOM
-
2026-06-07pricedays on market $299,999 Active 37 DOM
-
2026-06-03days on market $309,900 Active 33 DOM
-
2026-06-02days on market $309,900 Active 32 DOM
-
2026-06-01days on market $309,900 Active 31 DOM
-
2026-05-31days on market $309,900 Active 30 DOM
-
2026-05-31remarks 687-char remark
-
2026-05-31pricedays on market $309,900 Active 29 DOM
-
2026-05-13price $319,900 2221-char remark
-
2026-05-02$329,900 Active 2221-char remark
-
2026-05-01historical $329,900 2221-char remark
-
2023-02-22soldstatus $265,900
ⓘ Source: listings_history table (triggers on properties + properties_extension) + one-shot
backfill from property_details.listing_events for pre-trigger history.
Tax reassessment forecast VA · Resets to sale price
- Current annual tax
- $2,038 · $170/mo
- Projected year-2 tax
- $2,460 · $205/mo
- Expected delta
- +$422/yr (+$35/mo · 20.7%)
ⓘ Screening estimate from a state-policy table — verify with the county assessor before closing.
Climate risk First Street
- Flood 9/10 Extreme FEMA zone X (unshaded) · 99% chance over 30 yrs
- Wildfire 4/10 Moderate
- Heat 8/10 Severe 7 d/yr ≥108°F today · 16 d/yr by 30 yrs out
- Wind 6/10 Major 27% chance of damaging wind over 30 yrs
- Air quality 2/10 Low 2 unhealthy d/yr today · 2 by 30 yrs out
Nearby sold comps map
Loading sold comps map…
Walkable amenities ~0.75 mi
Loading nearby amenities…
Taxation est. · year 1
- Rental income
- $28,591
- − Mortgage interest
- −$16,805
- − Property taxes
- −$2,038
- − Insurance
- −$2,297
- − Repairs & maintenance
- −$2,287
- − Management
- −$2,287
- − Depreciation
- −$8,727
- Taxable loss
- −$5,851
- Est. tax savings @ 24.0%
- +$1,404
- After-tax cash flow
- $777/yr
For passive investors: Depreciation is non-cash, so a rental often shows a tax loss while cash-flowing — sheltering income. Rental losses are passive: they offset passive income freely, and up to $25,000/yr can offset ordinary (W-2) income if you actively participate and your MAGI is under $100k (phasing out to $0 by $150k); unused losses carry forward. On sale, claimed depreciation is recaptured at up to 25%, and gains may owe capital-gains tax (a 1031 exchange can defer both). Figures are a year-1 estimate at your 24.0% rate — not tax advice; consult a CPA.
Schools (NCES district)
- District
- Westmoreland County Public School District
- NCES district ID
- 5103980
- Math proficiency
- 34% ▼ -47.00%
- Reading proficiency
- 59% ▼ -11.00%
- Median HH income
- $51,665
- Composite
- 39.94/100
- National rank
- #3845
- State rank
- #105 of 131 in VA
Livability — Colonial Beach
- Score
- 59/100
- State rank
- #460
- US rank
- #19615
Category grades
Schools grade is shown separately in the Schools card above.
Census & demographics
- County
- Westmoreland County · 10,011 people
- City population
- 10,011
- Metro
- nan
- Population (ZIP)
- 10,011
- Household income
- $64,810
- Rent vs Own
- Severe rent burden
- 126.0
Population outlook (Westmoreland County) Hauer SSP2
- Today (2025)
- 17,643 people
- By 2030
- 17,520 · -0.7%
- By 2040
- 17,041 · -3.4%
- By 2050
- 16,397 · -7.1%
- By 2075
- 15,012 · -14.9%
- By 2100
- 12,917 · -26.8%
Race, ethnicity, and origin ACS 2023
- Neighborhood character
- Predominantly White (71%)
- Race & ethnicity
- White 71% Black 15% Two or more races 7% Hispanic / Latino 6% Asian 2%
- Hispanic origin (detail)
- Mexican 5%
- Common ancestry
- Slovak 2% Italian 2% Scotch-Irish 1%
- Foreign-born
- 3% · Canada
- Languages at home
- 96% English-only · Spanish 3%
Political lean MEDSL · Westmoreland
- 2024 margin
- R (+14.3) · D 42.4% · R 56.7%
- 2008→2024 swing
- -24.5pp toward R · 2008: 10.2pp · 2024: -14.3pp
- All cycles
- 2024: R+14.3 2020: R+8.2 2016: R+7.3 2012: D+0.5 2008: D+10.2
Not yet ingested
- Civics
- —
Market trends
- HPI YoY
- ▼ -127.23%
- Current HPI
- 152.1518
- Rent YoY
- —
- Metro
- nan
- State GDP YoY
- ▲ 2.40%
- F500 in state
- 50
Industry mix (Fortune 500 HQ in VA)
| Industry | F500 HQs | Revenue |
|---|---|---|
| Aerospace / Defense | 4 | $236B |
|
||
| Technology / Defense | 3 | $32B |
|
||
| Financial Services | 2 | $176B |
|
||
| Utilities | 2 | $27B |
|
||
| Insurance | 2 | $25B |
|
||
| Technology | 2 | $15B |
|
||
Price history
+12.8% since first listed6 events — show timeline
- 2026-06-05 Price Changed $299,999 BRIGHT MLS
- 2026-05-29 Price Changed $309,900 BRIGHT MLS
- 2026-05-13 Price Changed $319,900 BRIGHT MLS
- 2026-05-02 Listed $329,900 BRIGHT MLS
- 2026-05-01 Coming Soon $329,900 BRIGHT MLS
- 2023-02-22 Sold (Public Records) $265,900 Public Records
Property tax history
+24.7%/yrLatest (2025): $2,038 · +0.0% YoY. Source: county tax records.
Cash-flow waterfall
monthlySold comps — $/sqft
last 12 mo · ≤1 miLoading sold comps…