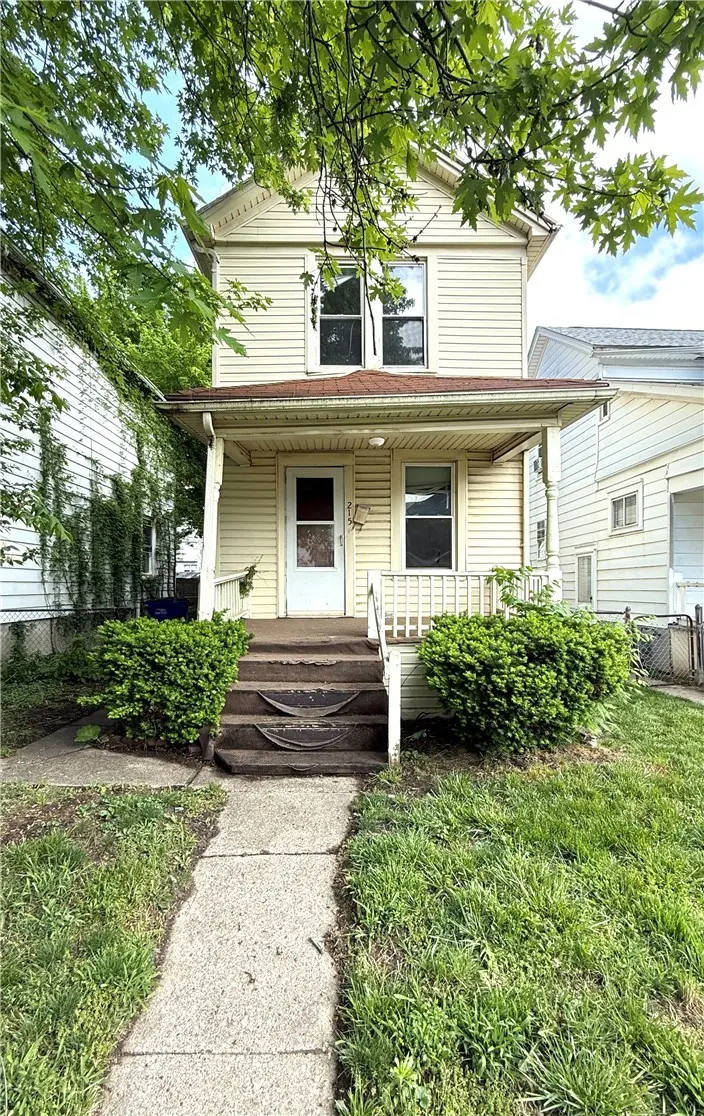
215 Heaton Ave · Dayton, OH
Flood risk No data
- FEMA flood zone
- —
- Chance of flooding over 30 yrs
- —
- Est. flood insurance / yr
- —
Fire risk No data
- Est. fire insurance / yr
- —
Heat risk No data
- Hot days now (above threshold)
- —
- Hot days in 30 yrs
- —
Wind risk No data
- Chance of severe wind over 30 yrs
- —
Air-quality risk No data
- Unhealthy air days now
- —
- Unhealthy air days in 30 yrs
- —
Risk factors via First Street. Map © Google.
Why this score? — see what drove the B+ grade
The composite is a weighted blend of 9 inputs, each scored 0–100. Each bar is that input's sub-score; the figure is the points it added to the 100-point composite (weight × sub-score).
- Cash flow +30.0/30.0
- ARV discount +15.0/15.0
- 1% rule +10.0/10.0
- DSCR +10.0/10.0
- Rent growth +5.0/5.0
- Livability +3.2/5.0
- Condition / age +2.5/5.0
- Schools +1.3/10.0
- Appreciation +0.0/10.0
$69,900
🖨 Deal sheet 📄 Offer letter ✓ Due diligence
Listing remarks
Value add opportunity in the highly desirable Belmont neighborhood! This 2 bedroom, 1 bath home features generously sized bedrooms, a full basement with furnace and hot water heater, and a fenced backyard. The property is currently vacant and offers a great opportunity for cosmetic improvements ideal for investors or buyers looking to add value without major renovations. Heating is forced air, and cooling is provided by window units.
Key facts
- Belmont neighborhood
- Full basement
- Fenced backyard
Tags
Property features AI
Finance
- Financial info: Offered for sale
- HOA & community: Listed by Agora's Maxxed Out Realty
Exterior
- Parking: No garage
- Utilities: Natural gas available; Public water
- Home design: Two-story single-family residence; Residential zoning
- Construction: Aluminum and vinyl siding
- Exterior features: Residential lot (approximately 25 x 35)
Interior
- Kitchen: Kitchen on the main level (approx. 10 x 12)
- Bedrooms: Two bedrooms on the second floor (each about 14 x 12)
- Bathrooms: One full bathroom (main level)
- Heating & cooling: Forced air heating; Window cooling units
- Interior features: Full unfinished basement
Neighborhood map
What this means for you Summary
Snapshot
- This is a 2-bed/1.0-bath single-family listed at $70k.
Deal economics
- At list price, monthly cash flow is $372 ($4k/yr) — positive.
- The deal already cash-flows at list — no discount required.
- Meets the 1% rule at list price ($1k rent vs $70k).
- Recommended offer: $69k (1.5% below list) — sets the bar for market timing.
- Cap rate 12.7% vs local median 7.4% in Dayton — top-decile yield for the area; either an underpriced asset or a hidden risk that comps aren't pricing in. Stress-test before assuming the spread holds.
Location & tenants
- Location reads 65/100 on livability (#716 in OH) — a middle-class / working-renter tenant base. Strengths: cost of living A+, housing A+, health & safety A; Watch: schools C-, amenities C-, crime F.
- Dayton City (urban): math 12% / reading 21% proficiency, ranked #641 of 656 in OH (top 98%) — low school quality limits family demand, transient renter base, plan for 1-2y turnover; 74% free/reduced lunch — lower-income household profile, screen leases tightly.
- Market conditions: Rents rising fast (+11.4%/yr); 92 active listings in the ZIP; 40 comparable units currently listed for rent nearby; rentals at typical pace (median 23d on market — plan ~3-4 weeks tenant-placement turnaround); 907 units permitted in Montgomery County in 2024 (416 in 5+ unit buildings).
Forward outlook
- Local home prices are declining (-3.0%/yr); year-one equity from $483 of loan paydown is wiped out by about $2k of value loss. Plan a longer hold.
- Montgomery County population projected at -10% by 2050 — secular population decline; favor cash flow + early exit over multi-decade hold.
- At projected returns (-3.0% appreciation + 8.0% rent growth), your $20k cash investment doubles in ~5 years — after that, you're playing with house money.
Negotiation context
- It's been on market 27 days — a 2% lower offer ($69k) is reasonable based on typical stale-listing flexibility.
- 5 sale attempts since 14y ago; this cycle's ask has dropped $5k (7%) from the opening price — seller is motivated, your offer sets the floor, not the list.
- Current owner paid $38k; list at $70k implies a 86% gain — meaningful room to come down on a strong offer.
Risks & watch-outs
- Watch-outs: built in 1912 — expect roof / HVAC / electrical / plumbing capex.
Questions for the listing agent
- Built in 1912 — when were the roof, HVAC, electrical panel, plumbing, and water heater last replaced?
- Is there a deadline driving the sale (1031 exchange, divorce, estate, relocation)? That informs how much negotiation room exists.
- Crime grade is F in this area — have there been break-ins, vandalism, or insurance claims at this property in the last 3 years? What carrier currently insures it and at what premium?
- What's the average days-on-market for RENTAL listings here right now (not sales)? A rising rental-DOM trend means longer vacancies and softer asking-rent achievability than the comps imply.
- What's the recent tenant-quality profile in this submarket — average credit score on applications, eviction rate, late-payment / NSF rate, and stable-employment percentage? A property-management company in the area should have these aggregated.
- How much new for-sale + rental construction is in the pipeline within 1–3 miles? Heavy new supply typically softens prices + rents 12–24 months out; constrained supply supports both.
Investment metrics
- 1% rule
- 1.57% ✓
- Cap rate
- 12.68%
- Cash-on-cash
- 22.82%
- DSCR
- 2.02
- GRM
- 5.3
CMA / ARV
- ARV (median comp)
- $90,198
- List price
- $69,900
- Delta
- -22.50%
- Verdict
- UNDERPRICED
- Comps
- 20 within 1.0 mi
Show comp detail 12 sales within ~0.75 mi
| Address | Dist | Beds/Ba | Sqft | Sold | Price | $/sf | Match |
|---|---|---|---|---|---|---|---|
| 208 Heaton Ave | 0.02mi | 2/1.0 | 1,032 (-0%) | 1mo | $57,500 | $56 | 97 |
| 225 Dover St | 0.20mi | 2/1.0 | 895 (-14%) | 2mo | $40,000 | $45 | 66 |
| 1219 Highland Ave | 0.34mi | 2/1.0 | 942 (-9%) | 3mo | $70,000 | $74 | 66 |
| 267 Indiana Ave | 0.29mi | 2/2.0 | 1,140 (+10%) | 1mo | $154,000 | $135 | 65 |
| 214 Pierce St | 0.39mi | 2/1.0 | 938 (-10%) | 2mo | $21,000 | $22 | 65 |
| 51 Little St | 0.50mi | 2/1.0 | 976 (-6%) | 7mo | $34,000 | $35 | 61 |
| 1205 Epworth Ave | 0.44mi | 2/1.0 | 930 (-10%) | 2mo | $74,969 | $81 | 61 |
| 51 Rogge St | 0.73mi | 2/1.0 | 1,102 (+6%) | 6mo | $144,000 | $131 | 50 |
| 2012 St. Charles Ave | 0.72mi | 2/1.0 | 945 (-9%) | 3mo | $80,500 | $85 | 49 |
| 1114 Arbor Ave | 0.73mi | 3/1.0 (+1) | 1,090 (+5%) | 7mo | $135,000 | $124 | 46 |
| 442 Oak St | 0.73mi | 1/1.0 (-1) | 932 (-10%) | 1mo | $98,010 | $105 | 44 |
| 337 Clover St | 0.52mi | 3/2.0 (+1) | 1,188 (+15%) | 6mo | $120,000 | $101 | 38 |
Match score weights: distance 35% · size 25% · config 20% · recency 20%. Top-matched comps best support the ARV.
Projected returns pro-forma
-3.0% appreciation · 8.0% rent growth · sell at horizon
- IRR
- 21.4%
- Equity multiple
- 1.93×
- Total profit
- $18,218
- Equity at exit
- $10,422
- IRR
- 32.7%
- Equity multiple
- 4.73×
- Total profit
- $72,937
- Equity at exit
- $6,044
Cash invested: $19,572 (down + closing). Projections, not guarantees.
Landlord ↔ Tenant lean methodology
- Overall (STATE)
- 73 Landlord-Friendly
- State Ohio
- 73 Landlord-Friendly · R+6
- County
- — inherits STATE
- City
- — inherits STATE
ZIP-level market 45410
- Home prices YoY
- -21.4%
- Rents YoY
- 11.4%
- Active inventory
- 92
- Price-to-rent
- 5.3×
Monthly cashflow live
- Estimated rent
- $1,099 high interval (Pro) →
- Mortgage (P&I)
- −$367
- Tax from tax record
- −$101 /mo · $1,206/yr
- Insurance
- −$29
- HOA
- −$0
- Vacancy / Maint / Mgmt
- −$231
- Net cashflow
- $372
Break-even live
UW: 25.0% down · 7.5% · 30yr · 1.5% tax · 5.0% vac · 8.0% maint · 8.0% mgmt
Financing live
Cash to close
- Down payment
- $17,475
- Closing costs
- $2,097
- Reserves months
- —
- Total cash needed
- —
Loan-product check · same deal, 3 products live
Conventional
25% down · 7.5% · 30yr
- Down + closing
- —
- Monthly P&I
- —
- Monthly cashflow
- —
- DSCR
- —
- Eligible?
- —
Personal DTI + credit; lowest rate.
DSCR
20% down · 8.5% · 30yr
- Down + closing
- —
- Monthly P&I
- —
- Monthly cashflow
- —
- DSCR
- —
- Eligible?
- —
No personal income docs; deal must DSCR.
Hard money
10% down · 12.0% · 12mo
- Down + closing
- —
- Monthly P&I
- —
- Monthly cashflow
- —
- DSCR
- —
- Eligible?
- —
Short-term bridge; refi at stabilization.
Rent comps 40 comps
| Address | Beds | Baths | Sqft | Rent | $/sqft | DOM | Units | Dist |
|---|---|---|---|---|---|---|---|---|
| 156 Gunckel Ave Apt 2 Dayton, OH | 2.0 | 1.0 | 800 | $700 | $0.88 | 23d | 1 | 0.11mi |
| 20 Lucerne Ave Dayton, OH | 3.0 | 1.0 | 1378 | $1,200 | $0.87 | 43d | 1 | 0.11mi |
| 1038 Walnut Hill Pl Dayton, OH | 3.0 | 1.0 | 1232 | $1,095 | $0.89 | 43d | 1 | 0.14mi |
| 1020 Walnut Hill Pl Dayton, OH | 3.0 | 1.0 | 1200 | $1,400 | $1.17 | 43d | 1 | 0.14mi |
| 57 Gunckel Ave Unit 57 Dayton, OH | 1.0 | 1.0 | 700 | $675 | $0.96 | 23d | 1 | 0.17mi |
| 136 Indiana Ave Dayton, OH | 3.0 | 1.0 | 1194 | $1,250 | $1.05 | 23d | 1 | 0.22mi |
| 1411 Wyoming St Dayton, OH | 3.0 | 1.0 | 1256 | $1,095 | $0.87 | 2d | 1 | 0.23mi |
| 1515 Wyoming St Dayton, OH | 3.0 | 1.0 | 1400 | $1,000 | $0.71 | 43d | 1 | 0.31mi |
| 313 Illinois Ave Dayton, OH | 3.0 | 1.0 | 1142 | $975 | $0.85 | 3d | 1 | 0.34mi |
| 9 Anderson St Dayton, OH | 1.0 | 1.0 | 850 | $750 | $0.88 | 23d | 1 | 0.34mi |
| 2132 Wayne Ave Dayton, OH | 3.0 | 2.0 | 1484 | $1,350 | $0.91 | 2d | 1 | 0.35mi |
| 2200 Wayne Ave Dayton, OH | 2.0 | 1.0 | 748 | $975 | $1.30 | 2d | 1 | 0.36mi |
| 2308 Wayne Ave Dayton, OH | 2.0 | 1.0 | 800 | $895 | $1.12 | 43d | 1 | 0.42mi |
| 1274 Highland Ave Unit A Dayton, OH | 1.0 | 1.0 | 900 | $795 | $0.88 | 23d | 1 | 0.44mi |
| 846 Xenia Ave Unit 848 Dayton, OH | 1.0 | 1.0 | 700 | $650 | $0.93 | 3d | 1 | 0.47mi |
| 1101 Phillips Ave Unit 1101 Dayton, OH | 3.0 | 1.5 | 1300 | $1,450 | $1.12 | 43d | 1 | 0.49mi |
| 534 Beckman St Dayton, OH | 3.0 | 2.0 | 1452 | $1,400 | $0.96 | 2d | 1 | 0.50mi |
| 519 Wyoming St Dayton, OH | 3.0 | 1.5 | 1240 | $1,600 | $1.29 | 43d | 1 | 0.54mi |
| 16 Mello Ave Unit A Dayton, OH | 1.0 | 1.0 | 1000 | $800 | $0.80 | 14d | 1 | 0.56mi |
| 323 Xenia Ave Unit 323B Dayton, OH | 2.0 | 1.0 | 800 | $700 | $0.88 | 3d | 1 | 0.60mi |
| 1410 Phillips Ave Unit 1 Dayton, OH | 2.0 | 1.0 | 1000 | $950 | $0.95 | 43d | 1 | 0.63mi |
| 637 Creighton Ave Dayton, OH | 3.0 | 1.0 | 1144 | $1,350 | $1.18 | 14d | 1 | 0.71mi |
| 2012 Saint Charles Ave Dayton, OH | 2.0 | 1.0 | 945 | $1,250 | $1.32 | 43d | 1 | 0.72mi |
| 2306 Alice St Dayton, OH | 3.0 | 1.0 | 918 | $1,200 | $1.31 | 3d | 1 | 0.76mi |
| 424 Bantz Ct Dayton, OH | 3.0 | 1.0 | 1192 | $1,050 | $0.88 | 3d | 1 | 0.78mi |
| 854 Santa Cruz Ave Dayton, OH | 3.0 | 1.0 | 1060 | $1,300 | $1.23 | 43d | 1 | 0.89mi |
| 243 Oak St Dayton, OH | 3.0 | 1.5 | 1316 | $1,600 | $1.22 | 3d | 1 | 0.90mi |
| 25 Garret St Dayton, OH | 2.0 | 1.5 | 1364 | $1,750 | $1.28 | 23d | 1 | 0.91mi |
| 2200 E 5th St Dayton, OH | 2.0 | 1.0 | 1000 | $825 | $0.82 | 23d | 1 | 0.96mi |
| 15 John St Unit 15 Dayton, OH | 2.0 | 1.0 | 1200 | $800 | $0.67 | 23d | 1 | 0.97mi |
| 706 Kolping Ave Unit 706 Dayton, OH | 3.0 | 1.5 | 1172 | $1,300 | $1.11 | 2d | 1 | 0.99mi |
| 2029 Brookline Ave Dayton, OH | 2.0 | 1.0 | 990 | $1,270 | $1.28 | 14d | 1 | 1.03mi |
| 425 Dayton Towers Dr Dayton, OH | 2.0 | 1.0–2.0 | 852 | $1,799 | $2.11 | 2d | 30 | 1.03mi |
| 820 Huffman Ave Unit 1/2 Dayton, OH | 1.0 | 1.0 | 768 | $695 | $0.90 | 43d | 1 | 1.04mi |
| 344 Firwood Dr Dayton, OH | 1.0–3.0 | 1.0–1.5 | 739 | $1,122 | $1.52 | 2d | 15 | 1.06mi |
| 2351 E 5th St Unit 2349-U Dayton, OH | 1.0 | 1.0 | 900 | $750 | $0.83 | 43d | 1 | 1.07mi |
| 619 Nathan Pl Dayton, OH | 2.0 | 1.0–2.0 | 729 | $1,608 | $2.21 | 2d | 7 | 1.08mi |
| 213 Burns Ave Dayton, OH | 2.0 | 1.5 | 1388 | $1,500 | $1.08 | 43d | 1 | 1.09mi |
| 213 Burns Ave Dayton, OH | 2.0 | 1.5 | 1388 | $1,500 | $1.08 | 14d | 1 | 1.09mi |
| 1354 Ohmer St Unit 1356C Dayton, OH | 2.0 | 2.0 | 1200 | $900 | $0.75 | 43d | 1 | 1.09mi |
Listing history 16 events
-
2026-05-13price $69,900 437-char remark
-
2026-04-25$74,900 Active 437-char remark
-
2026-02-12historical
-
2026-01-17status Pending
-
2025-11-04price $73,000
-
2025-09-18price $85,000
-
2025-07-21$95,000 Active
-
2014-06-01historical
-
2013-10-03$35,000
-
2013-07-31historical
-
2012-11-26$42,900
-
2012-10-31historical
-
2012-08-01$45,000
-
1994-06-03soldstatus $37,500
-
1990-06-05soldstatus $30,000
-
1980-01-01soldstatus $21,000
ⓘ Source: listings_history table (triggers on properties + properties_extension) + one-shot
backfill from property_details.listing_events for pre-trigger history.
Tax reassessment forecast OH · Partial reset (capped growth)
- Current annual tax
- $1,206 · $101/mo
- Projected year-2 tax
- $1,206 · $101/mo
- Expected delta
- $0/yr ($0/mo · 0.0%)
ⓘ Screening estimate from a state-policy table — verify with the county assessor before closing.
Nearby sold comps map
Loading sold comps map…
Walkable amenities ~0.75 mi
Loading nearby amenities…
Taxation est. · year 1
- Rental income
- $13,192
- − Mortgage interest
- −$3,915
- − Property taxes
- −$1,206
- − Insurance
- −$350
- − Repairs & maintenance
- −$1,055
- − Management
- −$1,055
- − Depreciation
- −$2,033
- Taxable income
- $3,577
- Est. tax owed @ 24.0%
- −$858
- After-tax cash flow
- $3,609/yr
For passive investors: Depreciation is non-cash, so a rental often shows a tax loss while cash-flowing — sheltering income. Rental losses are passive: they offset passive income freely, and up to $25,000/yr can offset ordinary (W-2) income if you actively participate and your MAGI is under $100k (phasing out to $0 by $150k); unused losses carry forward. On sale, claimed depreciation is recaptured at up to 25%, and gains may owe capital-gains tax (a 1031 exchange can defer both). Figures are a year-1 estimate at your 24.0% rate — not tax advice; consult a CPA.
Schools (NCES district)
- District
- Dayton City
- NCES district ID
- 3904384
- Math proficiency
- 12% ▼ -12.00%
- Reading proficiency
- 21% ▼ -11.00%
- Median HH income
- $28,688
- Composite
- 12.94/100
- National rank
- #9579
- State rank
- #641 of 656 in OH
Livability — Dayton
- Score
- 65/100
- State rank
- #716
- US rank
- #12895
Category grades
Schools grade is shown separately in the Schools card above.
Census & demographics
- Census place
- Dayton, OH
- County
- Montgomery County · 459,541 people
- City population
- 164,387
- Metro
- Dayton-Kettering, OH
- Population (ZIP)
- 14,694
- Household income
- $46,651
- Rent vs Own
- Severe rent burden
- 961.0
Population outlook (Montgomery County) Hauer SSP2
- Today (2025)
- 523,241 people
- By 2030
- 514,948 · -1.6%
- By 2040
- 493,378 · -5.7%
- By 2050
- 469,639 · -10.2%
- By 2075
- 418,360 · -20.0%
- By 2100
- 353,315 · -32.5%
Race, ethnicity, and origin ACS 2023
- Neighborhood character
- Predominantly White (71%)
- Race & ethnicity
- White 71% Black 15% Hispanic / Latino 7% Two or more races 6% Asian 1%
- Hispanic origin (detail)
- Mexican 3%
- Common ancestry
- Lithuanian 2% Iranian 2% Slovak 2%
- Foreign-born
- 5% · Canada, United Kingdom
- Languages at home
- 91% English-only · Spanish 6% Tagalog/Filipino 1% Other Asian/Pacific 1%
Political lean MEDSL · Montgomery
- 2024 margin
- Toss-up / Even · D 49.8% · R 49.3%
- 2008→2024 swing
- -5.8pp toward R · 2008: 6.2pp · 2024: 0.5pp
- All cycles
- 2024: D+0.5 2020: D+2.2 2016: R+1.2 2012: D+3.1 2008: D+6.2
Not yet ingested
- Civics
- —
Market trends
- HPI YoY
- ▼ -100.61%
- Current HPI
- 369.3938
- Rent YoY
- ▲ 11.37%
- Metro
- Dayton-Kettering, OH
- State GDP YoY
- ▲ 1.98%
- F500 in state
- 48
Industry mix (Fortune 500 HQ in OH)
| Industry | F500 HQs | Revenue |
|---|---|---|
| Insurance | 3 | $145B |
|
||
| Industrial Machinery | 3 | $49B |
|
||
| Financial Services | 3 | $24B |
|
||
| Consumer Goods | 2 | $93B |
|
||
| Aerospace / Defense | 2 | $47B |
|
||
| Utilities | 2 | $33B |
|
||
Price history
+232.9% since first listed17 events — show timeline
- 2026-05-23 Pending — Dayton MLS
- 2026-05-13 Price Changed $69,900 Dayton MLS
- 2026-04-25 Listed $74,900 Dayton MLS
- 2026-02-12 Listing Removed — Dayton MLS
- 2026-01-17 Pending — Dayton MLS
- 2025-11-04 Price Changed $73,000 Dayton MLS
- 2025-09-18 Price Changed $85,000 Dayton MLS
- 2025-07-21 Listed $95,000 Dayton MLS
- 2014-06-01 Listing Removed — Dayton MLS
- 2013-10-03 Listed $35,000 Dayton MLS
- 2013-07-31 Listing Removed — Dayton MLS
- 2012-11-26 Listed $42,900 Dayton MLS
- 2012-10-31 Listing Removed — Dayton MLS
- 2012-08-01 Listed $45,000 Dayton MLS
- 1994-06-03 Sold (Public Records) $37,500 Public Records
- 1990-06-05 Sold (Public Records) $30,000 Public Records
- 1980-01-01 Sold (Public Records) $21,000 Public Records
Property tax history
+0.2%/yrLatest (2025): $1,206 · -0.2% YoY. Source: county tax records.
Cash-flow waterfall
monthlySold comps — $/sqft
last 12 mo · ≤1 miLoading sold comps…