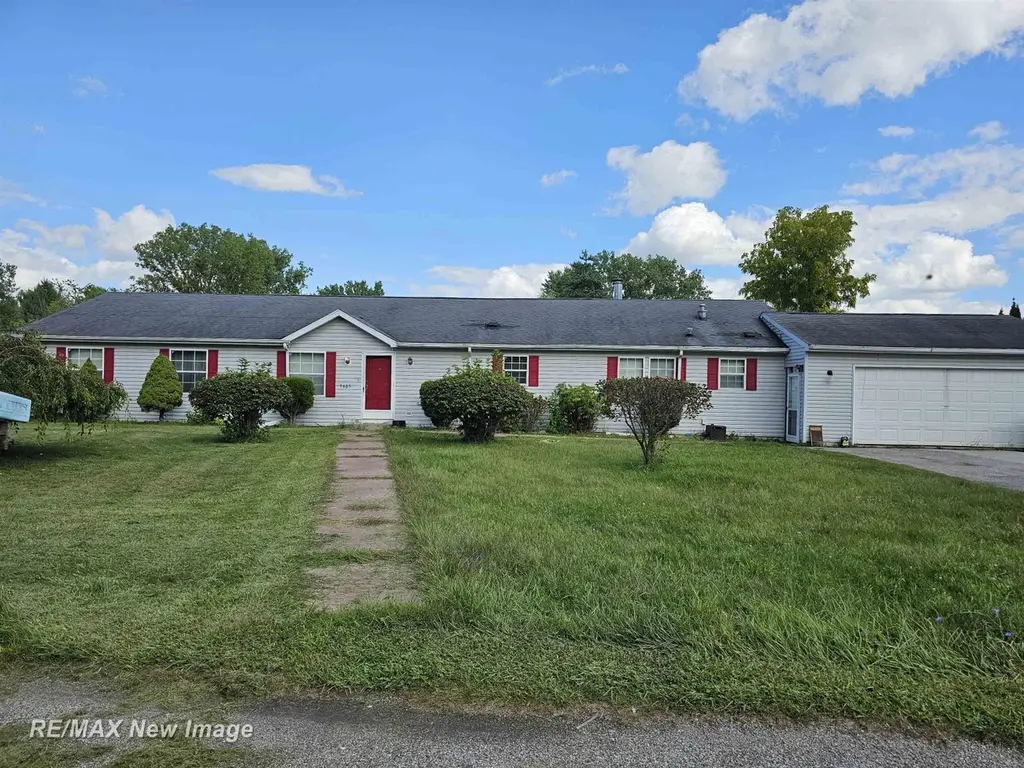
3605 Orange St · Bridgeport, MI
Flood risk 1/10 · Minimal
- FEMA flood zone
- X (unshaded)
- Chance of flooding over 30 yrs
- 0.0%
- Est. flood insurance / yr
- $473 – $860
Fire risk 1/10 · Minimal
- Est. fire insurance / yr
- $784 – $1,456
Heat risk 2/10 · Minimal
- Hot days now (above 99°F)
- 7 days/yr
- Hot days in 30 yrs
- 14 days/yr
Wind risk 1/10 · Minimal
- Chance of severe wind over 30 yrs
- —
Air-quality risk 2/10 · Minimal
- Unhealthy air days now
- 1 days/yr
- Unhealthy air days in 30 yrs
- 2 days/yr
Risk factors via First Street. Map © Google.
Why this score? — see what drove the D+ grade
The composite is a weighted blend of 9 inputs, each scored 0–100. Each bar is that input's sub-score; the figure is the points it added to the 100-point composite (weight × sub-score).
- Cash flow +23.9/30.0
- DSCR +7.7/10.0
- 1% rule +5.0/10.0
- Livability +2.9/5.0
- ARV discount +2.8/15.0
- Rent growth +2.5/5.0
- Condition / age +2.5/5.0
- Schools +1.0/10.0
- Appreciation +0.0/10.0
$142,500
🖨 Deal sheet (PDF) 📄 Offer letter ✓ Due diligence
Listing remarks MLS
Welcome to this spacious 4-bedroom, 2.5-bath Ranch/Modular home, perfectly situated on just under half an acre. The primary suite offers a private retreat with its own full bath and walk-in closets. You'll love the large kitchen with a center island, perfect for gathering and entertaining, as well as the inviting family room featuring a gas fireplace. An additional bonus room gives you the flexibility to create a home office, playroom, or hobby space. Whatever fits your lifestyle. With a 2-car garage and plenty of room both inside and out, this home is ready for you to bring your vision and make it your own!
Key facts
- Inviting family room
- Walk-in closets
- Gas fireplace
Tags
Neighborhood map
What this means for you Summary
Snapshot
- This is a 3-bed/1.5-bath single-family listed at $142k.
Deal economics
- At list price, monthly cash flow is $277 ($3k/yr) — positive.
- The deal already cash-flows at list — no discount required.
- Meets the 1% rule at list price ($1k rent vs $142k).
- Recommended offer: $130k (9.0% below list) — sets the bar for market timing.
- Cap rate 8.6% vs local median 6.0% in Bridgeport — top-decile yield for the area; either an underpriced asset or a hidden risk that comps aren't pricing in. Stress-test before assuming the spread holds.
Location & tenants
- Location reads 57/100 on livability (#638 in MI) — a working-class tenant base; expect higher turnover. Strengths: cost of living A+, housing A-; Watch: health & safety C-, crime D, schools F.
- Bridgeport-Spaulding Community School District (suburban): math 7% / reading 17% proficiency, ranked #513 of 540 in MI (top 95%) — low school quality limits family demand, transient renter base, plan for 1-2y turnover; 75% free/reduced lunch — lower-income household profile, screen leases tightly.
- Market conditions: 201 active listings in the ZIP; 154 units permitted in Saginaw County in 2024 (0 in 5+ unit buildings).
Forward outlook
- Local home prices are declining (-3.0%/yr); year-one equity from $985 of loan paydown is wiped out by about $4k of value loss. Plan a longer hold.
- Saginaw County population projected at -25% by 2050 — secular population decline; favor cash flow + early exit over multi-decade hold.
Negotiation context
- It's been on market 97 days — a 9% lower offer ($130k) is reasonable based on typical stale-listing flexibility.
- 6 sale attempts with the ask held roughly flat each time — persistent listings suggest the price (not the market) is what's stuck; bring a comps-based counter.
Questions for the listing agent
- It's been on market 97 days. Have you received any prior offers? Is the seller open to a 9% concession, seller financing, or rate buy-down credit?
- Why hasn't it sold? Are there any deal-killer items the seller is aware of (foundation, flood, title, zoning, code violations)?
- Is there a deadline driving the sale (1031 exchange, divorce, estate, relocation)? That informs how much negotiation room exists.
- Schools are F-rated, which usually means shorter tenancies and higher turnover. Who's the typical renter profile here, and what's been the actual vacancy rate?
- Crime grade is D in this area — have there been break-ins, vandalism, or insurance claims at this property in the last 3 years? What carrier currently insures it and at what premium?
- The area grade is low — what's the realistic commute time and amenity access for the typical tenant pool here? Any planned neighborhood developments (good or bad) we should know about?
- What's the average days-on-market for RENTAL listings here right now (not sales)? A rising rental-DOM trend means longer vacancies and softer asking-rent achievability than the comps imply.
- What's the recent tenant-quality profile in this submarket — average credit score on applications, eviction rate, late-payment / NSF rate, and stable-employment percentage? A property-management company in the area should have these aggregated.
- How much new for-sale + rental construction is in the pipeline within 1–3 miles? Heavy new supply typically softens prices + rents 12–24 months out; constrained supply supports both.
Investment metrics
- 1% rule
- 1.00% ✓
- Cap rate
- 8.62%
- Cash-on-cash
- 8.32%
- DSCR
- 1.37
- GRM
- 8.3
CMA / ARV
- ARV (median comp)
- $129,044
- List price
- $142,500
- Delta
- 10.43%
- Verdict
- OVERPRICED
- Comps
- 16 within 1.0 mi
Show comp detail 2 sales within ~0.75 mi
| Address | Dist | Beds/Ba | Sqft | Sold | Price | $/sf | Match |
|---|---|---|---|---|---|---|---|
| 3881 Olive St | 0.42mi | 3/2.0 | 2,300 (-9%) | 13mo | $60,000 | $26 | 52 |
| 2947 Tatham St | 0.75mi | 4/1.5 (+1) | 2,224 (-12%) | 22mo | $45,500 | $20 | 22 |
Match score weights: distance 35% · size 25% · config 20% · recency 20%. Top-matched comps best support the ARV.
Projected returns pro-forma
-3.0% appreciation · 3.0% rent growth · sell at horizon
- IRR
- -3.7%
- Equity multiple
- 0.86×
- Total profit
- $-5,533
- Equity at exit
- $21,247
- IRR
- 6.0%
- Equity multiple
- 1.44×
- Total profit
- $17,628
- Equity at exit
- $12,321
Cash invested: $39,900 (down + closing). Projections, not guarantees.
Landlord ↔ Tenant lean methodology
- Overall (STATE)
- 62 Landlord-Friendly
- State Michigan
- 62 Landlord-Friendly · EVEN
- County
- — inherits STATE
- City
- — inherits STATE
ZIP-level market 48601
- Home prices YoY
- -32.1%
- Active inventory
- 201
- Price-to-rent
- 8.3×
Monthly cashflow live
- Estimated rent
- $1,432 medium interval (Pro) →
- Mortgage (P&I)
- −$747
- Tax from tax record
- −$48 /mo · $574/yr
- Insurance
- −$59
- HOA
- −$0
- Vacancy / Maint / Mgmt
- −$301
- Net cashflow
- $277
Break-even live
Sensitivity live
| Price | -10% $357 | -5% $317 | +0% $277 | +5% $236 | +10% $196 |
|---|---|---|---|---|---|
| Rent | -10% $163 | -5% $220 | +0% $277 | +5% $333 | +10% $390 |
| Rate | -1.0pp $348 | -0.5pp $313 | base $277 | +0.5pp $240 | +1.0pp $202 |
UW: 25.0% down · 7.5% · 30yr · 1.5% tax · 5.0% vac · 8.0% maint · 8.0% mgmt
Financing live
Cash to close
- Down payment
- $35,625
- Closing costs
- $4,275
- Reserves months
- —
- Total cash needed
- —
Loan-product check · same deal, 3 products live
Conventional
25% down · 7.5% · 30yr
- Down + closing
- —
- Monthly P&I
- —
- Monthly cashflow
- —
- DSCR
- —
- Eligible?
- —
Personal DTI + credit; lowest rate.
DSCR
20% down · 8.5% · 30yr
- Down + closing
- —
- Monthly P&I
- —
- Monthly cashflow
- —
- DSCR
- —
- Eligible?
- —
No personal income docs; deal must DSCR.
Hard money
10% down · 12.0% · 12mo
- Down + closing
- —
- Monthly P&I
- —
- Monthly cashflow
- —
- DSCR
- —
- Eligible?
- —
Short-term bridge; refi at stabilization.
Listing history 24 events
-
2026-06-21days on market $142,500 Active 97 DOM
-
2026-06-18days on market $142,500 Active 95 DOM
-
2026-06-17days on market $142,500 Active 94 DOM
-
2026-06-17status $142,500 Active 93 DOM
-
2026-06-08status $142,500 Pending 93 DOM
-
2026-06-07days on market $142,500 Active 93 DOM
-
2026-06-07days on market $142,500 Active 92 DOM
-
2026-06-04days on market $142,500 Active 89 DOM
-
2026-06-02days on market $142,500 Active 88 DOM
-
2026-06-01days on market $142,500 Active 87 DOM
-
2026-05-31price $142,500 Active 86 DOM
-
2026-05-31days on market $149,900 Active 86 DOM
-
2026-05-31days on market $149,900 Active 85 DOM
-
2026-03-06$149,900 Active 615-char remark
Show marketing remark (615 chars)
Welcome to this spacious 4-bedroom, 2.5-bath Ranch/Modular home, perfectly situated on just under half an acre. The primary suite offers a private retreat with its own full bath and walk-in closets. You'll love the large kitchen with a center island, perfect for gathering and entertaining, as well as the inviting family room featuring a gas fireplace. An additional bonus room gives you the flexibility to create a home office, playroom, or hobby space. Whatever fits your lifestyle. With a 2-car garage and plenty of room both inside and out, this home is ready for you to bring your vision and make it your own!
-
2026-02-27historical
-
2025-10-06price $149,900
-
2025-10-05status Active
-
2025-10-05price $149,900
-
2025-10-05status Active
-
2025-09-26status Pending
-
2025-09-26status Pending
-
2025-09-11$169,900 Active
-
2025-09-11$169,900 Active
ⓘ Source: listings_history table (triggers on properties + properties_extension) + one-shot
backfill from property_details.listing_events for pre-trigger history.
Tax reassessment forecast MI · Partial reset (capped growth)
- Current annual tax
- $574 · $48/mo
- Projected year-2 tax
- $1,384 · $115/mo
- Expected delta
- +$810/yr (+$68/mo · 141.1%)
ⓘ Screening estimate from a state-policy table — verify with the county assessor before closing.
Climate risk First Street
- Flood 1/10 Low FEMA zone X (unshaded) · 0% chance over 30 yrs
- Wildfire 1/10 Low
- Heat 2/10 Low 7 d/yr ≥99°F today · 14 d/yr by 30 yrs out
- Wind 1/10 Low
- Air quality 2/10 Low 1 unhealthy d/yr today · 2 by 30 yrs out
Nearby sold comps map
Loading sold comps map…
Walkable amenities ~0.75 mi
Loading nearby amenities…
Taxation est. · year 1
- Rental income
- $17,181
- − Mortgage interest
- −$7,982
- − Property taxes
- −$574
- − Insurance
- −$712
- − Repairs & maintenance
- −$1,375
- − Management
- −$1,375
- − Depreciation
- −$4,145
- Taxable income
- $1,018
- Est. tax owed @ 24.0%
- −$244
- After-tax cash flow
- $3,075/yr
For passive investors: Depreciation is non-cash, so a rental often shows a tax loss while cash-flowing — sheltering income. Rental losses are passive: they offset passive income freely, and up to $25,000/yr can offset ordinary (W-2) income if you actively participate and your MAGI is under $100k (phasing out to $0 by $150k); unused losses carry forward. On sale, claimed depreciation is recaptured at up to 25%, and gains may owe capital-gains tax (a 1031 exchange can defer both). Figures are a year-1 estimate at your 24.0% rate — not tax advice; consult a CPA.
Schools (NCES district)
- District
- Bridgeport-Spaulding Community School District
- NCES district ID
- 2606780
- Math proficiency
- 7% ▼ -4.00%
- Reading proficiency
- 17% ▼ -5.00%
- Median HH income
- $38,403
- Composite
- 10.13/100
- National rank
- #9800
- State rank
- #513 of 540 in MI
Livability — Bridgeport
- Score
- 57/100
- State rank
- #638
- US rank
- #21636
Category grades
Schools grade is shown separately in the Schools card above.
Census & demographics
- Census place
- Bridgeport, MI
- Population (ZIP)
- 32,069
Population outlook (Saginaw County) Hauer SSP2
- Today (2025)
- 180,568 people
- By 2030
- 172,302 · -4.6%
- By 2040
- 153,919 · -14.8%
- By 2050
- 135,519 · -24.9%
- By 2075
- 97,199 · -46.2%
- By 2100
- 65,037 · -64.0%
Race, ethnicity, and origin ACS 2023
- Neighborhood character
- Diverse neighborhood (Simpson 0.56)
- Race & ethnicity
- Black 59% White 27% Hispanic / Latino 12% Two or more races 5%
- Hispanic origin (detail)
- Mexican 10%
- Common ancestry
- Romanian 2% Lithuanian 2%
- Foreign-born
- 1% · Canada
- Languages at home
- 96% English-only · Spanish 4%
Political lean MEDSL · Saginaw
- 2024 margin
- Toss-up / Even · D 47.7% · R 51.0% · Other 1.4%
- 2008→2024 swing
- -20.6pp toward R · 2008: 17.3pp · 2024: -3.3pp
- All cycles
- 2024: R+3.3 2020: D+0.3 2016: R+1.1 2012: D+11.9 2008: D+17.3
Not yet ingested
- Civics
- —
Market trends
- HPI YoY
- ▼ -93.46%
- Current HPI
- 197.3359
- Rent YoY
- —
- Metro
- —
- State GDP YoY
- ▲ 1.37%
- F500 in state
- 28
Industry mix (Fortune 500 HQ in MI)
| Industry | F500 HQs | Revenue |
|---|---|---|
| Automotive Parts | 3 | $48B |
|
||
| Automotive | 2 | $372B |
|
||
| Chemicals | 1 | $45B |
|
||
| Automotive Retail | 1 | $29B |
|
||
| Healthcare / Medical Devices | 1 | $23B |
|
||
| Automotive Technology | 1 | $20B |
|
||
Price history
-11.8% since first listed11 events — show timeline
- 2026-03-06 Listed $149,900 REALCOMP
- 2026-03-06 Listed $149,900 MiRealSource-MiMLS
- 2026-02-27 Listing Removed — MiRealSource-MiMLS
- 2025-10-06 Price Changed $149,900 MiRealSource-MiMLS
- 2025-10-05 Relisted — REALCOMP
- 2025-10-05 Price Changed $149,900 REALCOMP
- 2025-10-05 Relisted — MiRealSource-MiMLS
- 2025-09-26 Pending — REALCOMP
- 2025-09-26 Pending — MiRealSource-MiMLS
- 2025-09-11 Listed $169,900 MiRealSource-MiMLS
- 2025-09-11 Listed $169,900 REALCOMP
Property tax history
-8.5%/yrLatest (2025): $574 · -73.8% YoY. Source: county tax records.
Cash-flow waterfall
monthlySold comps — $/sqft
last 12 mo · ≤1 miLoading sold comps…