 🔨 Auction
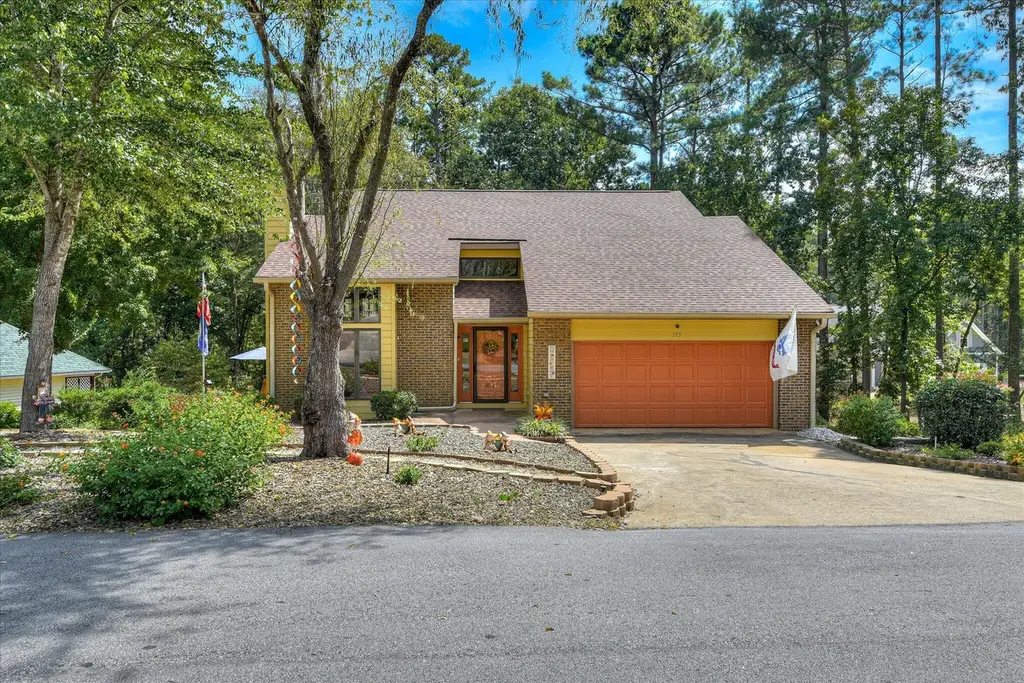
173 Tara Drive 173 · McCormick, SC
Flood risk 1/10 · Minimal
- FEMA flood zone
- X (unshaded)
- Chance of flooding over 30 yrs
- 0.0%
- Est. flood insurance / yr
- $507 – $1,088
Fire risk 3/10 · Minor
- Est. fire insurance / yr
- $783 – $1,453
Heat risk 6/10 · Moderate
- Hot days now (above 107°F)
- 7 days/yr
- Hot days in 30 yrs
- 18 days/yr
Wind risk 6/10 · Moderate
- Chance of severe wind over 30 yrs
- 48.0%
Air-quality risk 2/10 · Minimal
- Unhealthy air days now
- 2 days/yr
- Unhealthy air days in 30 yrs
- 2 days/yr
Risk factors via First Street. Map © Google.
Why this score? — see what drove the F grade
The composite is a weighted blend of 9 inputs, each scored 0–100. Each bar is that input's sub-score; the figure is the points it added to the 100-point composite (weight × sub-score).
- Appreciation +10.0/10.0
- ARV discount +7.5/15.0
- Livability +2.8/5.0
- Rent growth +2.5/5.0
- Condition / age +2.5/5.0
- Schools +1.6/10.0
- Cash flow +0.0/30.0
- 1% rule +0.0/10.0
- DSCR +0.0/10.0
$1
🖨 Deal sheet (PDF) 📄 Offer letter ✓ Due diligence
Listing remarks
For more information, visit www. AuctionZip.com ID #9375. Sales price for the property is not $1.00.. . House is being offered for auction on Wednesday, June 24, 2026 at 10:00 am and sales price will be determined by winning bidder. Sale is subject to owner confirmation. House to be sold AS IS. Home inspection and Preliminary CL100 are available upon request. For a successful buyer, $10,000 earnest money will be due on the day of the sale and closing within 30 days (with no financing contingency). Sales contract cannot be assigned. The house is within the Savannah Lakes Subdivision and is subject to the neighborhood covenants and restrictions. Old-Time Lake House Character, Rustic Charm,
Key facts
- Private boat dock
- Rustic lake retreat
- Spacious layout
Tags
Neighborhood map
What this means for you Summary
Snapshot
- This is a 4-bed/3.5-bath single-family listed at $1.
Deal economics
- At list price, monthly cash flow is $-2k ($-22k/yr) — negative.
- The deal already cash-flows at list — no discount required.
- Meets the 1% rule at list price ($1k rent vs $1).
Location & tenants
- Location reads 56/100 on livability (#295 in SC) — a working-class tenant base; expect higher turnover. Strengths: cost of living A+, housing B+; Watch: crime D+, amenities F, commute F.
- Mccormick 01 (rural): math 14% / reading 23% proficiency, ranked #73 of 80 in SC (top 91%) — low school quality limits family demand, transient renter base, plan for 1-2y turnover; 70% free/reduced lunch — lower-income household profile, screen leases tightly.
- Zoned schools: Mccormick Elementary (math 12% / reading 17%, grade F, #553 of 597 statewide, top 95%, 241 students, 100% FRL); Mccormick Middle (math 12% / reading 17%, grade F, #204 of 229 statewide, top 89%, 153 students, 100% FRL); Mccormick High (math 15% / reading 74%, grade D-, #165 of 196 statewide, top 84%, 188 students, 100% FRL) — zoned schools average 100% FRL vs 70% district-wide (30 pts higher); higher-poverty schools than district average — tighter screening recommended.
- Market conditions: 271 active listings in the ZIP; 141 units permitted in McCormick County in 2024 (0 in 5+ unit buildings).
Forward outlook
- In year one you build about $41k of equity ($3k loan paydown + $38k appreciation (10.0% local appreciation)).
- McCormick County population projected at -37% by 2050 — secular population decline; favor cash flow + early exit over multi-decade hold.
- By year 2, paydown + projected appreciation supports a ~$66k cash-out refi (75% LTV) — recoverable capital for the next deal without selling this one.
Negotiation context
- It's been on market 38 days — a 3% lower offer ($0) is reasonable based on typical stale-listing flexibility.
- 2 sale attempts; this cycle's ask has dropped $487k (100%) from the opening price — seller is motivated, your offer sets the floor, not the list.
Risks & watch-outs
- Watch-outs: property tax is 576609.0% of price.
- Climate carrying-cost: major wind risk, 48% chance of damaging wind over 30y; extreme-heat days projected 7→18/yr by 2055 (HVAC capex compounding) — expect insurance premiums to compound above CPI over the hold.
Questions for the listing agent
- What do current leases actually rent for vs. the listed asking? Can we see a recent rent roll and the last 12 months of T-12 income?
- It's been on market 38 days. Have you received any prior offers? Is the seller open to a 5% concession, seller financing, or rate buy-down credit?
- Property tax is high relative to price — has the assessment been appealed recently, and will the sale trigger a re-assessment?
- What does the HOA fee cover, when was the last increase, and are there any pending special assessments or reserve-fund shortfalls?
- Is there a deadline driving the sale (1031 exchange, divorce, estate, relocation)? That informs how much negotiation room exists.
- Schools are F-rated, which usually means shorter tenancies and higher turnover. Who's the typical renter profile here, and what's been the actual vacancy rate?
- Crime grade is D in this area — have there been break-ins, vandalism, or insurance claims at this property in the last 3 years? What carrier currently insures it and at what premium?
- The area grade is low — what's the realistic commute time and amenity access for the typical tenant pool here? Any planned neighborhood developments (good or bad) we should know about?
- What's the average days-on-market for RENTAL listings here right now (not sales)? A rising rental-DOM trend means longer vacancies and softer asking-rent achievability than the comps imply.
- What's the recent tenant-quality profile in this submarket — average credit score on applications, eviction rate, late-payment / NSF rate, and stable-employment percentage? A property-management company in the area should have these aggregated.
- How much new for-sale + rental construction is in the pipeline within 1–3 miles? Heavy new supply typically softens prices + rents 12–24 months out; constrained supply supports both.
Investment metrics
- 1% rule
- 0.34% ✗
- Cap rate
- 0.66%
- Cash-on-cash
- -20.13%
- DSCR
- 0.10
- GRM
- 24.5
CMA / ARV
- ARV (on-the-fly)
- $384,406
- Comps found
- 12
Show comp detail 12 sales within ~0.75 mi
| Address | Dist | Beds/Ba | Sqft | Sold | Price | $/sf | Match |
|---|---|---|---|---|---|---|---|
| 123 Tara Dr | 0.38mi | 3/2.0 (-1) | 2,174 (-2%) | 10mo | $299,000 | $138 | 59 |
| 111 Davis Ln | 0.53mi | 3/2.0 (-1) | 2,290 (+3%) | 6mo | $389,900 | $170 | 54 |
| 104 Driftwood Ln | 0.67mi | 3/2.0 (-1) | 2,204 (-1%) | 3mo | $535,000 | $243 | 53 |
| 115 Tara Dr | 0.47mi | 3/2.0 (-1) | 2,325 (+5%) | 8mo | $237,000 | $102 | 53 |
| 262 Brassie Dr | 0.75mi | 4/2.0 | 2,347 (+6%) | 2mo | $410,000 | $175 | 48 |
| 403 Sawgrass Cv | 0.53mi | 3/2.0 (-1) | 2,065 (-7%) | 9mo | $325,000 | $157 | 45 |
| 228 Heron Shrs | 0.34mi | 3/2.5 (-1) | 2,550 (+15%) | 10mo | $720,000 | $282 | 42 |
| 241 Fairway Dr | 0.67mi | 3/3.0 (-1) | 2,040 (-8%) | 8mo | $340,000 | $167 | 41 |
| 202 Dixie Ct | 0.39mi | 3/2.0 (-1) | 1,910 (-14%) | 8mo | $329,900 | $173 | 41 |
| 209 Fairway Dr. Dr | 0.60mi | 3/2.0 (-1) | 2,455 (+10%) | 9mo | $564,900 | $230 | 36 |
| 306 Greenview Ct | 0.70mi | 3/2.5 (-1) | 1,940 (-13%) | 2mo | $301,000 | $155 | 36 |
| 106 Driftwood Ln | 0.67mi | 3/2.5 (-1) | 2,513 (+13%) | 12mo | $540,000 | $215 | 28 |
Match score weights: distance 35% · size 25% · config 20% · recency 20%. Top-matched comps best support the ARV.
Projected returns pro-forma
10.0% appreciation · 3.0% rent growth · sell at horizon
- IRR
- 10.5%
- Equity multiple
- 1.88×
- Total profit
- $94,487
- Equity at exit
- $346,303
- IRR
- 11.6%
- Equity multiple
- 4.43×
- Total profit
- $368,943
- Equity at exit
- $746,816
Cash invested: $107,634 (down + closing). Projections, not guarantees.
Landlord ↔ Tenant lean methodology
- Overall (STATE)
- 90 Strongly Landlord-Friendly
- State South Carolina
- 90 Strongly Landlord-Friendly · R+6
- County
- — inherits STATE
- City
- — inherits STATE
ZIP-level market 29835
- Home prices YoY
- 8.6%
- Active inventory
- 271
Monthly cashflow live
- Estimated rent
- $1,305 medium interval (Pro) →
- Mortgage (P&I)
- −$2,016
- Tax est. 1.5%
- −$481 /mo · $5,766/yr
- Insurance
- −$160
- HOA
- −$180
- Vacancy / Maint / Mgmt
- −$274
- Net cashflow
- $-1,806
Break-even live
Sensitivity live
| Price | -10% $-1,540 | -5% $-1,673 | +0% $-1,806 | +5% $-1,938 | +10% $-2,071 |
|---|---|---|---|---|---|
| Rent | -10% $-1,909 | -5% $-1,857 | +0% $-1,806 | +5% $-1,754 | +10% $-1,703 |
| Rate | -1.0pp $-1,612 | -0.5pp $-1,708 | base $-1,806 | +0.5pp $-1,905 | +1.0pp $-2,007 |
UW: 25.0% down · 7.5% · 30yr · 1.5% tax · 5.0% vac · 8.0% maint · 8.0% mgmt
Financing live
Cash to close
- Down payment
- $96,102
- Closing costs
- $11,532
- Reserves months
- —
- Total cash needed
- —
Loan-product check · same deal, 3 products live
Conventional
25% down · 7.5% · 30yr
- Down + closing
- —
- Monthly P&I
- —
- Monthly cashflow
- —
- DSCR
- —
- Eligible?
- —
Personal DTI + credit; lowest rate.
DSCR
20% down · 8.5% · 30yr
- Down + closing
- —
- Monthly P&I
- —
- Monthly cashflow
- —
- DSCR
- —
- Eligible?
- —
No personal income docs; deal must DSCR.
Hard money
10% down · 12.0% · 12mo
- Down + closing
- —
- Monthly P&I
- —
- Monthly cashflow
- —
- DSCR
- —
- Eligible?
- —
Short-term bridge; refi at stabilization.
HOA detail
- Monthly dues
- $180 · $2,160/yr
Listing history 20 events
-
2026-06-18days on market $1 Active 38 DOM
-
2026-06-17price $1 Active 37 DOM
-
2026-06-17days on market $487,000 Active 37 DOM
-
2026-06-16days on market $487,000 Active 36 DOM
-
2026-06-15days on market $487,000 Active 35 DOM
-
2026-06-14days on market $487,000 Active 33 DOM
-
2026-06-10days on market $487,000 Active 30 DOM
-
2026-06-09days on market $487,000 Active 29 DOM
-
2026-06-08days on market $487,000 Active 28 DOM
-
2026-06-07days on market $487,000 Active 27 DOM
-
2026-06-05days on market $487,000 Active 24 DOM
-
2026-06-03days on market $487,000 Active 23 DOM
-
2026-06-02days on market $487,000 Active 22 DOM
-
2026-06-01days on market $487,000 Active 21 DOM
-
2026-05-31days on market $487,000 Active 20 DOM
-
2026-05-30days on market $487,000 Active 19 DOM
-
2026-05-11historical
-
2026-03-04price $487,000
-
2025-09-24$519,900 Active
-
2025-09-24$487,000 Active
ⓘ Source: listings_history table (triggers on properties + properties_extension) + one-shot
backfill from property_details.listing_events for pre-trigger history.
Climate risk First Street
- Flood 1/10 Low FEMA zone X (unshaded) · 0% chance over 30 yrs
- Wildfire 3/10 Moderate
- Heat 6/10 Major 7 d/yr ≥107°F today · 18 d/yr by 30 yrs out
- Wind 6/10 Major 48% chance of damaging wind over 30 yrs
- Air quality 2/10 Low 2 unhealthy d/yr today · 2 by 30 yrs out
Nearby sold comps map
Loading sold comps map…
Walkable amenities ~0.75 mi
Loading nearby amenities…
Taxation est. · year 1
- Rental income
- $15,660
- − Mortgage interest
- −$21,533
- − Property taxes
- −$5,766
- − Insurance
- −$1,922
- − Repairs & maintenance
- −$1,253
- − Management
- −$1,253
- − HOA
- −$2,160
- − Depreciation
- −$11,183
- Taxable loss
- −$29,410
- Est. tax savings @ 24.0%
- +$7,058
- After-tax cash flow
- $-14,609/yr
For passive investors: Depreciation is non-cash, so a rental often shows a tax loss while cash-flowing — sheltering income. Rental losses are passive: they offset passive income freely, and up to $25,000/yr can offset ordinary (W-2) income if you actively participate and your MAGI is under $100k (phasing out to $0 by $150k); unused losses carry forward. On sale, claimed depreciation is recaptured at up to 25%, and gains may owe capital-gains tax (a 1031 exchange can defer both). Figures are a year-1 estimate at your 24.0% rate — not tax advice; consult a CPA.
Schools (NCES district)
- District
- Mccormick 01
- NCES district ID
- 4503000
- Math proficiency
- 14% ▼ -6.00%
- Reading proficiency
- 23% ▲ 1.00%
- Median HH income
- $38,503
- Composite
- 15.54/100
- National rank
- #9299
- State rank
- #73 of 80 in SC
Livability — McCormick
- Score
- 56/100
- State rank
- #295
- US rank
- #22914
Category grades
Schools grade is shown separately in the Schools card above.
Census & demographics
- City population
- 7,107
- Population (ZIP)
- 6,325
Population outlook (McCormick County) Hauer SSP2
- Today (2025)
- 8,487 people
- By 2030
- 7,703 · -9.2%
- By 2040
- 6,309 · -25.7%
- By 2050
- 5,329 · -37.2%
- By 2075
- 4,081 · -51.9%
- By 2100
- 3,190 · -62.4%
Race, ethnicity, and origin ACS 2023
- Neighborhood character
- Majority White (53%)
- Race & ethnicity
- White 53% Black 42% Two or more races 4%
- Common ancestry
- Lithuanian 2% Slovak 2% Portuguese 1%
- Foreign-born
- 1% · Canada
- Languages at home
- 99% English-only · French/Haitian/Cajun 1%
Political lean MEDSL · McCormick
- 2024 margin
- R (+17.1) · D 40.8% · R 57.9% · Other 1.2%
- 2008→2024 swing
- -44.7pp toward R · 2008: 27.6pp · 2024: -17.1pp
- All cycles
- 2024: R+17.1 2020: R+4.8 2016: R+3.3 2012: D+3.4 2008: D+27.6
Not yet ingested
- Civics
- —
Market trends
- HPI YoY
- ▲ 16.20%
- Current HPI
- 204.8929
- Rent YoY
- —
- Metro
- —
- State GDP YoY
- ▲ 4.51%
- F500 in state
- 2
Industry mix (Fortune 500 HQ in SC)
| Industry | F500 HQs | Revenue |
|---|---|---|
| Packaging | 1 | $7B |
|
||
Price history
-6.3% since first listed4 events — show timeline
- 2026-05-11 Listing Removed — Hive MLS
- 2026-03-04 Price Changed $487,000 Hive MLS
- 2025-09-24 Listed $487,000 Hive MLS
- 2025-09-24 Listed $519,900 Hive MLS
Property tax history
+12.9%/yrLatest (2025): $6,200 · +272.2% YoY. Source: county tax records.
Cash-flow waterfall
monthlySold comps — $/sqft
last 12 mo · ≤1 miLoading sold comps…