10781 Ichetucknee Way · Trinity, FL
Flood risk No data
- FEMA flood zone
- —
- Chance of flooding over 30 yrs
- —
- Est. flood insurance / yr
- —
Fire risk No data
- Est. fire insurance / yr
- —
Heat risk No data
- Hot days now (above threshold)
- —
- Hot days in 30 yrs
- —
Wind risk No data
- Chance of severe wind over 30 yrs
- —
Air-quality risk No data
- Unhealthy air days now
- —
- Unhealthy air days in 30 yrs
- —
Risk factors via First Street. Map © Google.
Why this score? — see what drove the D grade
The composite is a weighted blend of 9 inputs, each scored 0–100. Each bar is that input's sub-score; the figure is the points it added to the 100-point composite (weight × sub-score).
- ARV discount +13.1/15.0
- Cash flow +10.9/30.0
- Schools +4.3/10.0
- Condition / age +4.0/5.0
- Livability +3.9/5.0
- 1% rule +3.2/10.0
- DSCR +3.2/10.0
- Rent growth +1.3/5.0
- Appreciation +0.0/10.0
$278,440
🖨 Deal sheet (PDF) 📄 Offer letter ✓ Due diligence
Listing remarks
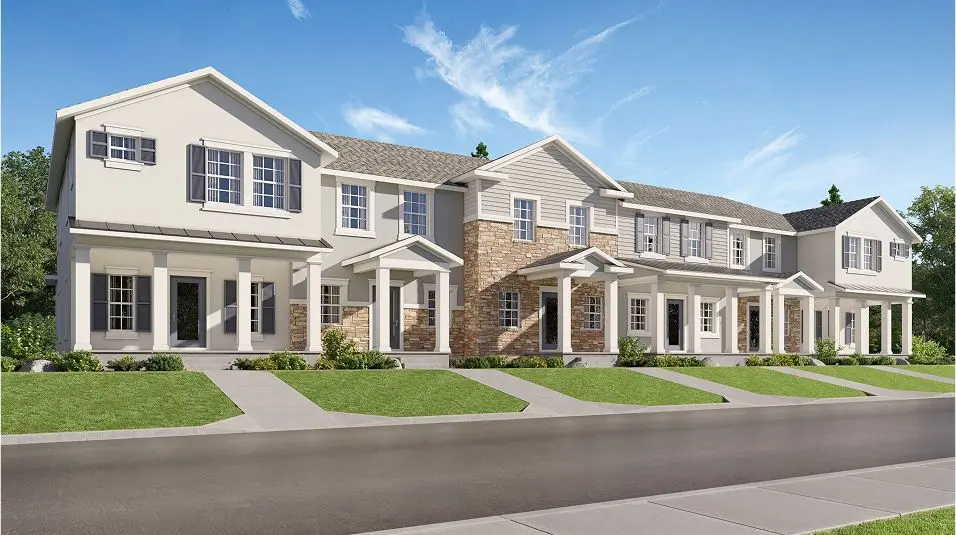
This new two-story townhome is host to an inviting open-concept layout on the first floor, combining the kitchen, living and dining areas to maximize interior space. Two bedrooms make up the second level, including a lavish owner's suite with a full bathroom and walk-in closet. A single-car garage offers ample storage and parking space at the back of the home.
Key facts
- Garage
- Built 2026
- Listed 10 days
Property features AI
Finance
- Financial info: List price $278,440
Exterior
- Parking: 1 garage space (1 total parking space)
- Home design: Single-family home (Cypress plan); Active listing
- Exterior features: Address: 10781 Ichetucknee Way, New Port Richey, FL 34655
Interior
- Bedrooms: 2 bedrooms
- Bathrooms: 2 full bathrooms and 1 half bathroom (2.5 total)
- Interior features: Spec (new construction, Cypress plan); Living area 1394
Neighborhood map
What this means for you Summary
Snapshot
- This is a 2-bed/2.5-bath townhouse listed at $278k. Condition is rated good.
Deal economics
- At list price, monthly cash flow is $-122 ($-1k/yr) — negative.
- To cash-flow at today's rent, offer at most $261k (6.4% below list).
- To meet the 1% rule (rent ≥ 1% of price), the offer needs to be $228k (18.1% below list).
- Recommended offer: $228k (18.1% below list) — sets the bar for 1% rule.
- Cap rate 5.8% vs local median 2.9% in Trinity — top-decile yield for the area; either an underpriced asset or a hidden risk that comps aren't pricing in. Stress-test before assuming the spread holds.
Location & tenants
- Location reads 78/100 on livability (#156 in FL, #2,369 nationally) — a middle-class / working-renter tenant base. Strengths: crime A+, employment A+, housing A+; Watch: cost of living D, amenities F, commute F.
- Pasco (suburban): math 50% / reading 52% proficiency, ranked #32 of 73 in FL (top 44%) — acceptable for families but not a draw, mixed tenant base, ~2y average lease.
- Zoned schools: Longleaf Elementary School (math 69% / reading 73%, grade A-, #320 of 2,144 statewide, top 15%, 639 students, 40% FRL); Seven Springs Middle School (math 73% / reading 65%, grade A, #68 of 571 statewide, top 12%, 1,628 students, 36% FRL); James W. Mitchell High School (math 60% / reading 63%, grade B-, #100 of 667 statewide, top 15%, 2,155 students, 32% FRL).
- Zoned-school proficiency averages 67% at this address vs 51% district-wide (+16 pts) — the actual schools serving this property are materially stronger than the Pasco average implies; a family-tenant draw the district grade alone would hide.
- Market conditions: Rents falling (-4.7%/yr); 547 active listings in the ZIP; 14 comparable units currently listed for rent nearby; rentals at typical pace (median 14d on market — plan ~3-4 weeks tenant-placement turnaround); solid renter incomes; 6,765 units permitted in Pasco County in 2024 (1,250 in 5+ unit buildings).
- This rent runs 32% of the median local income ($85k/yr) — at the standard rent-burdened threshold; future hikes will face affordability resistance.
Forward outlook
- Local home prices are declining (-3.0%/yr); year-one equity from $2k of loan paydown is wiped out by about $8k of value loss. Plan a longer hold.
- Pasco County population projected at +29% by 2050 — long-run rental-demand tailwind backs the buy-and-hold thesis.
Negotiation context
- Only 10 days on market — expect competitive offers; lowballing is unlikely to land.
Questions for the listing agent
- What do current leases actually rent for vs. the listed asking? Can we see a recent rent roll and the last 12 months of T-12 income?
- Is there a deadline driving the sale (1031 exchange, divorce, estate, relocation)? That informs how much negotiation room exists.
- Schools are A-rated — typically a magnet for longer-tenancy family renters. What's the average tenant stay here, and is there a school-zone premium baked into asking?
- The area grade is low — what's the realistic commute time and amenity access for the typical tenant pool here? Any planned neighborhood developments (good or bad) we should know about?
- What's the average days-on-market for RENTAL listings here right now (not sales)? A rising rental-DOM trend means longer vacancies and softer asking-rent achievability than the comps imply.
- What's the recent tenant-quality profile in this submarket — average credit score on applications, eviction rate, late-payment / NSF rate, and stable-employment percentage? A property-management company in the area should have these aggregated.
- How much new for-sale + rental construction is in the pipeline within 1–3 miles? Heavy new supply typically softens prices + rents 12–24 months out; constrained supply supports both.
Investment metrics
- 1% rule
- 0.82% ✗
- Cap rate
- 5.77%
- Cash-on-cash
- -1.88%
- DSCR
- 0.92
- GRM
- 10.2
CMA / ARV
- ARV (on-the-fly)
- $317,832
- Comps found
- 8
Show comp detail 8 sales within ~0.75 mi
| Address | Dist | Beds/Ba | Sqft | Sold | Price | $/sf | Match |
|---|---|---|---|---|---|---|---|
| 10815 Ichetucknee Way | 0.03mi | 3/2.5 (+1) | 1,510 (+8%) | 3mo | $331,540 | $220 | 77 |
| 10837 Ichetucknee | 0.05mi | 3/2.5 (+1) | 1,510 (+8%) | 3mo | $343,900 | $228 | 76 |
| 10629 Marsha Dr | 0.32mi | 3/2.5 (+1) | 1,530 (+10%) | 6mo | $355,000 | $232 | 59 |
| 10647 Marsha Dr | 0.32mi | 3/2.5 (+1) | 1,530 (+10%) | 18mo | $343,000 | $224 | 49 |
| 3448 Lonzalo Way | 0.37mi | 3/2.5 (+1) | 1,530 (+10%) | 16mo | $347,000 | $227 | 49 |
| 3429 Durrance St | 0.42mi | 3/2.5 (+1) | 1,530 (+10%) | 15mo | $335,000 | $219 | 46 |
| 3806 Herlong St | 0.63mi | 3/2.5 (+1) | 1,280 (-8%) | 19mo | $305,000 | $238 | 36 |
| 3803 Herlong St | 0.65mi | 3/2.5 (+1) | 1,240 (-11%) | 22mo | $300,000 | $242 | 28 |
Match score weights: distance 35% · size 25% · config 20% · recency 20%. Top-matched comps best support the ARV.
Projected returns pro-forma
-3.0% appreciation · 0.0% rent growth · sell at horizon
- IRR
- -22.8%
- Equity multiple
- 0.24×
- Total profit
- $-59,568
- Equity at exit
- $41,516
- IRR
- -27.6%
- Equity multiple
- -0.12×
- Total profit
- $-87,605
- Equity at exit
- $24,074
Cash invested: $77,963 (down + closing). Projections, not guarantees.
Landlord ↔ Tenant lean methodology
- Overall (STATE)
- 87 Strongly Landlord-Friendly
- State Florida
- 87 Strongly Landlord-Friendly · R+3
- County
- — inherits STATE
- City
- — inherits STATE
ZIP-level market 34655
- Home prices YoY
- -22.9%
- Rents YoY
- -4.7%
- Active inventory
- 547
- Price-to-rent
- 10.2×
Monthly cashflow live
- Estimated rent
- $2,281 high interval (Pro) →
- Mortgage (P&I)
- −$1,460
- Tax est. 1.5%
- −$348 /mo · $4,177/yr
- Insurance
- −$116
- HOA
- −$0
- Vacancy / Maint / Mgmt
- −$479
- Net cashflow
- $-122
Break-even live
Sensitivity live
| Price | -10% $70 | -5% $-26 | +0% $-122 | +5% $-219 | +10% $-315 |
|---|---|---|---|---|---|
| Rent | -10% $-303 | -5% $-213 | +0% $-122 | +5% $-32 | +10% $58 |
| Rate | -1.0pp $18 | -0.5pp $-52 | base $-122 | +0.5pp $-195 | +1.0pp $-268 |
UW: 25.0% down · 7.5% · 30yr · 1.5% tax · 5.0% vac · 8.0% maint · 8.0% mgmt
Financing live
Cash to close
- Down payment
- $69,610
- Closing costs
- $8,353
- Reserves months
- —
- Total cash needed
- —
Loan-product check · same deal, 3 products live
Conventional
25% down · 7.5% · 30yr
- Down + closing
- —
- Monthly P&I
- —
- Monthly cashflow
- —
- DSCR
- —
- Eligible?
- —
Personal DTI + credit; lowest rate.
DSCR
20% down · 8.5% · 30yr
- Down + closing
- —
- Monthly P&I
- —
- Monthly cashflow
- —
- DSCR
- —
- Eligible?
- —
No personal income docs; deal must DSCR.
Hard money
10% down · 12.0% · 12mo
- Down + closing
- —
- Monthly P&I
- —
- Monthly cashflow
- —
- DSCR
- —
- Eligible?
- —
Short-term bridge; refi at stabilization.
Rent comps 14 comps
| Address | Beds | Baths | Sqft | Rent | $/sqft | DOM | Units | Dist |
|---|---|---|---|---|---|---|---|---|
| 10812 Ichetucknee Way New Port Richey, FL | 3.0 | 2.5 | 1510 | $2,550 | $1.69 | 0d | 1 | 0.03mi |
| 10822 Ichetucknee Way New Port Richey, FL | 2.0 | 2.5 | 1400 | $2,500 | $1.79 | 14d | 1 | 0.04mi |
| 3104 Town Ave Trinity, FL | 1.0 | 1.0 | 882 | $1,100 | $1.25 | 26d | 1 | 0.71mi |
| 11200 Callisia Dr Odessa, FL | 2.0 | 2.0 | 1689 | $2,900 | $1.72 | 26d | 1 | 0.74mi |
| 3944 Watson Dr New Port Richey, FL | 3.0 | 2.0 | 1614 | $2,600 | $1.61 | 12d | 1 | 0.84mi |
| 3554 Teeside Dr New Port Richey, FL | 2.0 | 2.0 | 1148 | $1,950 | $1.70 | 26d | 1 | 1.01mi |
| 3832 Teeside Dr Unit 1 New Port Richey, FL | 2.0 | 2.0 | 1034 | $1,495 | $1.45 | 6d | 1 | 1.01mi |
| 3832 Teeside Dr Unit 4 New Port Richey, FL | 2.0 | 2.0 | 956 | $1,495 | $1.56 | 11d | 1 | 1.01mi |
| 3516 Teeside Dr New Port Richey, FL | 2.0 | 2.0 | 1288 | $2,000 | $1.55 | 0d | 1 | 1.04mi |
| 9616 Midiron Ct New Port Richey, FL | 2.0 | 2.0 | 956 | $1,950 | $2.04 | 6d | 1 | 1.14mi |
| 3668 Trophy Blvd New Port Richey, FL | 2.0 | 2.0 | 923 | $2,000 | $2.17 | 26d | 1 | 1.18mi |
| 9635 Greenskeeper Dr New Port Richey, FL | 2.0 | 2.0 | 1148 | $1,900 | $1.66 | 26d | 1 | 1.19mi |
| 3683 Trophy Blvd New Port Richey, FL | 2.0 | 2.0 | 923 | $1,650 | $1.79 | 6d | 1 | 1.23mi |
| 9400 Alta Sol Way New Port Richey, FL | 2.0 | 2.0 | 1177 | $1,949 | $1.66 | 14d | 1 | 1.45mi |
Listing history 7 events
-
2026-06-18days on market $278,440 Active 10 DOM
-
2026-06-17days on market $278,440 Active 9 DOM
-
2026-06-16days on market $278,440 Active 8 DOM
-
2026-06-15days on market $278,440 Active 7 DOM
-
2026-06-13days on market $278,440 Active 5 DOM
-
2026-06-08remarks 362-char remark
-
2026-06-08$278,440 Active 1 DOM
ⓘ Source: listings_history table (triggers on properties + properties_extension) + one-shot
backfill from property_details.listing_events for pre-trigger history.
Nearby sold comps map
Loading sold comps map…
Walkable amenities ~0.75 mi
Loading nearby amenities…
Taxation est. · year 1
- Rental income
- $27,369
- − Mortgage interest
- −$15,597
- − Property taxes
- −$4,177
- − Insurance
- −$1,392
- − Repairs & maintenance
- −$2,190
- − Management
- −$2,190
- − Depreciation
- −$8,100
- Taxable loss
- −$6,276
- Est. tax savings @ 24.0%
- +$1,506
- After-tax cash flow
- $37/yr
For passive investors: Depreciation is non-cash, so a rental often shows a tax loss while cash-flowing — sheltering income. Rental losses are passive: they offset passive income freely, and up to $25,000/yr can offset ordinary (W-2) income if you actively participate and your MAGI is under $100k (phasing out to $0 by $150k); unused losses carry forward. On sale, claimed depreciation is recaptured at up to 25%, and gains may owe capital-gains tax (a 1031 exchange can defer both). Figures are a year-1 estimate at your 24.0% rate — not tax advice; consult a CPA.
Condition & rehab AI · 12 photos
This move-in-ready townhome features a modern open-concept layout and well-maintained interiors, making it an attractive option for both buyers and renters.
Value-add opportunities
- Both Painting the exterior and interior walls — Fresh paint can enhance curb appeal and interior aesthetics.
- Both Landscaping improvements — Enhanced landscaping can improve curb appeal and attract potential buyers/tenants.
- Both Upgrading the flooring in the living areas — Replacing carpet with hardwood or tile can increase the home's value and appeal to a wider range of buyers/tenants.
Renovation cost estimate screening
Value-add ROI direction
- Both Painting the exterior and interior walls — Fresh paint can enhance curb appeal and interior aesthetics. ↑
- Both Landscaping improvements — Enhanced landscaping can improve curb appeal and attract potential buyers/tenants. ↑
- Both Upgrading the flooring in the living areas — Replacing carpet with hardwood or tile can increase the home's value and appeal to a wider range of buyers/tenants. ↑
ⓘ Cost ranges are severity-bucket heuristics (US national rule-of-thumb). Get contractor quotes + a written scope before underwriting a rehab budget.
Schools (NCES district)
- District
- Pasco
- NCES district ID
- 1201530
- Math proficiency
- 50% ▼ -10.00%
- Reading proficiency
- 52% ▼ -5.00%
- Median HH income
- $45,039
- Composite
- 43.14/100
- National rank
- #3074
- State rank
- #32 of 73 in FL
Livability — Trinity
- Score
- 78/100
- State rank
- #156
- US rank
- #2369
Category grades
Schools grade is shown separately in the Schools card above.
Census & demographics
- County
- Pasco County · 524,098 people
- Metro
- Tampa-St. Petersburg-Clearwater, FL
- Population (ZIP)
- 49,964
- Household income
- $85,470
- Rent vs Own
- Severe rent burden
- 1372.0
Population outlook (Pasco County) Hauer SSP2
- Today (2025)
- 570,045 people
- By 2030
- 605,844 · +6.3%
- By 2040
- 674,806 · +18.4%
- By 2050
- 736,022 · +29.1%
- By 2075
- 862,900 · +51.4%
- By 2100
- 906,364 · +59.0%
Race, ethnicity, and origin ACS 2023
- Neighborhood character
- Predominantly White (83%)
- Race & ethnicity
- White 83% Hispanic / Latino 9% Two or more races 7% Asian 2% Black 2%
- Hispanic origin (detail)
- Mexican 1% Puerto Rican 2% Cuban 2%
- Common ancestry
- Romanian 4% Lithuanian 2% Slovak 2%
- Foreign-born
- 12% · Canada, Vietnam, Jamaica
- Languages at home
- 87% English-only · Spanish 6% Arabic 2% Other Indo-European 2%
Political lean MEDSL · Pasco
- 2024 margin
- Strong R (+25.2) · D 36.9% · R 62.1% · Other 1.0%
- 2008→2024 swing
- -21.6pp toward R · 2008: -3.6pp · 2024: -25.2pp
- All cycles
- 2024: R+25.2 2020: R+20.1 2016: R+21.6 2012: R+6.7 2008: R+3.6
Not yet ingested
- Civics
- —
Market trends
- HPI YoY
- ▼ -82.58%
- Current HPI
- 278.3649
- Rent YoY
- ▼ -4.70%
- Metro
- Tampa-St. Petersburg-Clearwater, FL
- State GDP YoY
- ▲ 3.28%
- F500 in state
- 36
Industry mix (Fortune 500 HQ in FL)
| Industry | F500 HQs | Revenue |
|---|---|---|
| Industrial Technology | 2 | $29B |
|
||
| Insurance | 2 | $17B |
|
||
| Retail | 1 | $60B |
|
||
| Technology Distribution | 1 | $58B |
|
||
| Homebuilding | 1 | $35B |
|
||
| Technology Manufacturing | 1 | $35B |
|
||
Cash-flow waterfall
monthlySold comps — $/sqft
last 12 mo · ≤1 miLoading sold comps…