5783 S Monroe St · Sidney, IN
Flood risk 1/10 · Minimal
- FEMA flood zone
- X (unshaded)
- Chance of flooding over 30 yrs
- 0.0%
- Est. flood insurance / yr
- $507 – $1,088
Fire risk 3/10 · Minor
- Est. fire insurance / yr
- $717 – $1,331
Heat risk 2/10 · Minimal
- Hot days now (above 99°F)
- 7 days/yr
- Hot days in 30 yrs
- 16 days/yr
Wind risk 2/10 · Minimal
- Chance of severe wind over 30 yrs
- —
Air-quality risk 3/10 · Minor
- Unhealthy air days now
- 1 days/yr
- Unhealthy air days in 30 yrs
- 3 days/yr
Risk factors via First Street. Map © Google.
Why this score? — see what drove the B- grade
The composite is a weighted blend of 9 inputs, each scored 0–100. Each bar is that input's sub-score; the figure is the points it added to the 100-point composite (weight × sub-score).
- Cash flow +30.0/30.0
- 1% rule +10.0/10.0
- DSCR +10.0/10.0
- ARV discount +7.5/15.0
- Livability +3.0/5.0
- Schools +2.9/10.0
- Rent growth +2.5/5.0
- Condition / age +2.5/5.0
- Appreciation +0.0/10.0
$77,000
🖨 Deal sheet (PDF) 📄 Offer letter ✓ Due diligence
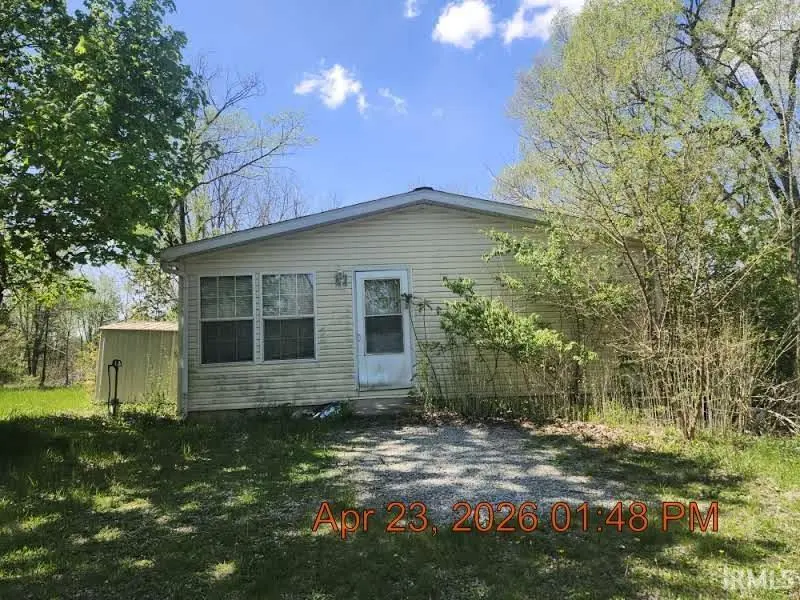
Listing remarks
Oversize lot, 3 bedroom, 2 bath home. 1560 sq ft. Lots of potential here. Cash only , SOLD AS IS WHERE IS
Key facts
- 0.34 acre lot
- Built 2001
- Listed 15 days
Property features AI
Finance
- Other: Lot dimensions approximately 150 x 100 (0.34 acre)
- Financial info: $364 annual tax amount
- HOA & community: No subdivision
Exterior
- Parking: Parking details not provided
- Security: Security details not provided
- Utilities: Private well water; Septic tank sewer
- Home design: Manufactured home (residential); Single-story
- Construction: Vinyl siding
- Exterior features: Corner lot
Interior
- Kitchen: Kitchen details not provided
- Bedrooms: Bedrooms not specified
- Flooring: Flooring details not provided
- Bathrooms: 2 full bathrooms (both on the main level)
- Heating & cooling: Central air conditioning; Forced air heating
- Interior features: 7 total rooms; Crawl space basement
- Laundry & utility: Laundry on the main level
Neighborhood map
What this means for you Summary
Snapshot
- This is a 3-bed/2.0-bath single-family listed at $77k.
Deal economics
- At list price, monthly cash flow is $642 ($8k/yr) — positive.
- The deal already cash-flows at list — no discount required.
- Meets the 1% rule at list price ($1k rent vs $77k).
- Recommended offer: $76k (1.5% below list) — sets the bar for market timing.
Location & tenants
- Location reads 60/100 on livability (#528 in IN) — a middle-class / working-renter tenant base. Strengths: cost of living A+, housing A+; Watch: health & safety C-, crime D+, amenities F.
- Whitko Community School Corporation (rural): math 27% / reading 39% proficiency, ranked #204 of 301 in IN (top 68%) — families likely to look elsewhere, expect single-tenant / working-renter base with shorter leases.
- Zoned schools: Pierceton Elementary School (math 32% / reading 27%, grade F, #697 of 994 statewide, top 73%, 386 students, 59% FRL); Whitko Jr/Sr High School (math 18% / reading 40%, grade F, #312 of 369 statewide, top 85%, 541 students, 43% FRL) — zoned schools average 51% FRL vs 35% district-wide (16 pts higher); higher-poverty schools than district average — tighter screening recommended.
- Market conditions: 102 active listings in the ZIP; 261 units permitted in Kosciusko County in 2024 (10 in 5+ unit buildings).
Forward outlook
- Local home prices are declining (-3.0%/yr); year-one equity from $532 of loan paydown is wiped out by about $2k of value loss. Plan a longer hold.
- Kosciusko County population projected at +3% by 2050 — modest demand growth; plan on rents tracking national, not racing it.
- At projected returns (-3.0% appreciation + 3.0% rent growth), your $22k cash investment doubles in ~4 years — after that, you're playing with house money.
Negotiation context
- It's been on market 15 days — a 2% lower offer ($76k) is reasonable based on typical stale-listing flexibility.
Questions for the listing agent
- Is there a deadline driving the sale (1031 exchange, divorce, estate, relocation)? That informs how much negotiation room exists.
- Schools are F-rated, which usually means shorter tenancies and higher turnover. Who's the typical renter profile here, and what's been the actual vacancy rate?
- Crime grade is D in this area — have there been break-ins, vandalism, or insurance claims at this property in the last 3 years? What carrier currently insures it and at what premium?
- What's the average days-on-market for RENTAL listings here right now (not sales)? A rising rental-DOM trend means longer vacancies and softer asking-rent achievability than the comps imply.
- What's the recent tenant-quality profile in this submarket — average credit score on applications, eviction rate, late-payment / NSF rate, and stable-employment percentage? A property-management company in the area should have these aggregated.
- How much new for-sale + rental construction is in the pipeline within 1–3 miles? Heavy new supply typically softens prices + rents 12–24 months out; constrained supply supports both.
Investment metrics
- 1% rule
- 1.82% ✓
- Cap rate
- 16.29%
- Cash-on-cash
- 35.71%
- DSCR
- 2.59
- GRM
- 4.6
CMA / ARV
No comps found within radius.
Projected returns pro-forma
-3.0% appreciation · 3.0% rent growth · sell at horizon
- IRR
- 31.4%
- Equity multiple
- 2.32×
- Total profit
- $28,366
- Equity at exit
- $11,481
- IRR
- 38.5%
- Equity multiple
- 4.58×
- Total profit
- $77,235
- Equity at exit
- $6,658
Cash invested: $21,560 (down + closing). Projections, not guarantees.
Landlord ↔ Tenant lean methodology
- Overall (STATE)
- 90 Strongly Landlord-Friendly
- State Indiana
- 90 Strongly Landlord-Friendly · R+11
- County
- — inherits STATE
- City
- — inherits STATE
ZIP-level market 46580
- Home prices YoY
- -19.2%
- Active inventory
- 102
- Price-to-rent
- 4.6×
Monthly cashflow live
- Estimated rent
- $1,399 medium interval (Pro) →
- Mortgage (P&I)
- −$404
- Tax from tax record
- −$28 /mo · $332/yr
- Insurance
- −$32
- HOA
- −$0
- Vacancy / Maint / Mgmt
- −$294
- Net cashflow
- $642
Break-even live
Sensitivity live
| Price | -10% $685 | -5% $663 | +0% $642 | +5% $620 | +10% $598 |
|---|---|---|---|---|---|
| Rent | -10% $531 | -5% $586 | +0% $642 | +5% $697 | +10% $752 |
| Rate | -1.0pp $680 | -0.5pp $661 | base $642 | +0.5pp $622 | +1.0pp $601 |
UW: 25.0% down · 7.5% · 30yr · 1.5% tax · 5.0% vac · 8.0% maint · 8.0% mgmt
Financing live
Cash to close
- Down payment
- $19,250
- Closing costs
- $2,310
- Reserves months
- —
- Total cash needed
- —
Loan-product check · same deal, 3 products live
Conventional
25% down · 7.5% · 30yr
- Down + closing
- —
- Monthly P&I
- —
- Monthly cashflow
- —
- DSCR
- —
- Eligible?
- —
Personal DTI + credit; lowest rate.
DSCR
20% down · 8.5% · 30yr
- Down + closing
- —
- Monthly P&I
- —
- Monthly cashflow
- —
- DSCR
- —
- Eligible?
- —
No personal income docs; deal must DSCR.
Hard money
10% down · 12.0% · 12mo
- Down + closing
- —
- Monthly P&I
- —
- Monthly cashflow
- —
- DSCR
- —
- Eligible?
- —
Short-term bridge; refi at stabilization.
Listing history 4 events
-
2026-06-01statusdays on market $77,000 Pending 15 DOM
-
2026-05-31days on market $77,000 Active 14 DOM
-
2026-05-30days on market $77,000 Active 13 DOM
-
2026-05-16$77,000 Active
ⓘ Source: listings_history table (triggers on properties + properties_extension) + one-shot
backfill from property_details.listing_events for pre-trigger history.
Tax reassessment forecast IN · Partial reset (capped growth)
- Current annual tax
- $332 · $28/mo
- Projected year-2 tax
- $493 · $41/mo
- Expected delta
- +$161/yr (+$13/mo · 48.5%)
ⓘ Screening estimate from a state-policy table — verify with the county assessor before closing.
Climate risk First Street
- Flood 1/10 Low FEMA zone X (unshaded) · 0% chance over 30 yrs
- Wildfire 3/10 Moderate
- Heat 2/10 Low 7 d/yr ≥99°F today · 16 d/yr by 30 yrs out
- Wind 2/10 Low
- Air quality 3/10 Moderate 1 unhealthy d/yr today · 3 by 30 yrs out
Nearby sold comps map
Loading sold comps map…
Walkable amenities ~0.75 mi
Loading nearby amenities…
Taxation est. · year 1
- Rental income
- $16,788
- − Mortgage interest
- −$4,313
- − Property taxes
- −$332
- − Insurance
- −$385
- − Repairs & maintenance
- −$1,343
- − Management
- −$1,343
- − Depreciation
- −$2,240
- Taxable income
- $6,831
- Est. tax owed @ 24.0%
- −$1,639
- After-tax cash flow
- $6,060/yr
For passive investors: Depreciation is non-cash, so a rental often shows a tax loss while cash-flowing — sheltering income. Rental losses are passive: they offset passive income freely, and up to $25,000/yr can offset ordinary (W-2) income if you actively participate and your MAGI is under $100k (phasing out to $0 by $150k); unused losses carry forward. On sale, claimed depreciation is recaptured at up to 25%, and gains may owe capital-gains tax (a 1031 exchange can defer both). Figures are a year-1 estimate at your 24.0% rate — not tax advice; consult a CPA.
Schools (NCES district)
- District
- Whitko Community School Corporation
- NCES district ID
- 1813230
- Math proficiency
- 27% ▼ -5.00%
- Reading proficiency
- 39% ▼ -3.00%
- Median HH income
- $52,047
- Composite
- 28.84/100
- National rank
- #6650
- State rank
- #204 of 301 in IN
Livability — Sidney
- Score
- 60/100
- State rank
- #528
- US rank
- #18999
Category grades
Schools grade is shown separately in the Schools card above.
Census & demographics
- County
- Kosciusko County · 36,398 people
- Metro
- Warsaw, IN
- Population (ZIP)
- 21,794
- Household income
- $71,687
- Rent vs Own
- Severe rent burden
- 374.0
Population outlook (Kosciusko County) Hauer SSP2
- Today (2025)
- 81,747 people
- By 2030
- 82,878 · +1.4%
- By 2040
- 84,270 · +3.1%
- By 2050
- 84,191 · +3.0%
- By 2075
- 82,918 · +1.4%
- By 2100
- 74,808 · -8.5%
Race, ethnicity, and origin ACS 2023
- Neighborhood character
- Predominantly White (83%)
- Race & ethnicity
- White 83% Hispanic / Latino 13% Two or more races 8%
- Hispanic origin (detail)
- Mexican 10% Puerto Rican 1%
- Common ancestry
- Italian 2% Iranian 1% Portuguese 1%
- Foreign-born
- 6% · Canada
- Languages at home
- 90% English-only · Spanish 9%
Political lean MEDSL · Kosciusko
- 2024 margin
- Solid R (+52.3) · D 22.9% · R 75.2% · Other 1.9%
- 2008→2024 swing
- -14.9pp toward R · 2008: -37.3pp · 2024: -52.3pp
- All cycles
- 2024: R+52.3 2020: R+50.7 2016: R+55.1 2012: R+52.2 2008: R+37.3
Not yet ingested
- Civics
- —
Market trends
- HPI YoY
- ▼ -67.41%
- Current HPI
- 283.1513
- Rent YoY
- —
- Metro
- Warsaw, IN
- State GDP YoY
- ▲ 2.90%
- F500 in state
- 18
Industry mix (Fortune 500 HQ in IN)
| Industry | F500 HQs | Revenue |
|---|---|---|
| Industrial Machinery | 2 | $37B |
|
||
| Healthcare | 1 | $177B |
|
||
| Pharmaceuticals | 1 | $45B |
|
||
| Metals / Steel | 1 | $18B |
|
||
| Agriculture | 1 | $17B |
|
||
| Packaging | 1 | $12B |
|
||
Price history
1 event — show timeline
- 2026-05-16 Listed $77,000 IRMLS
Property tax history
-11.4%/yrLatest (2024): $332 · -22.9% YoY. Source: county tax records.
Cash-flow waterfall
monthlySold comps — $/sqft
last 12 mo · ≤1 miLoading sold comps…