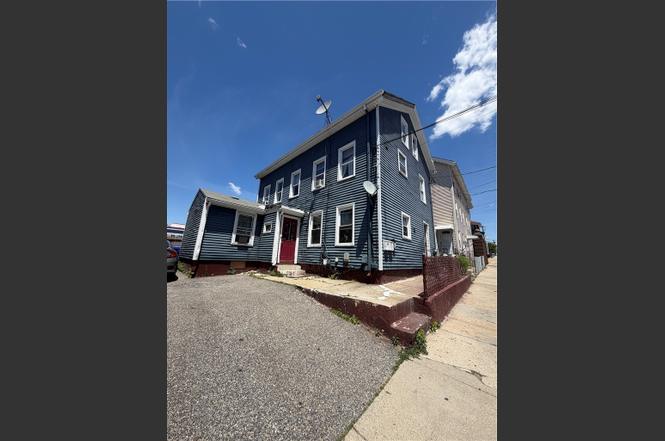
 Duplex
373 Cowden St · Central Falls, RI
Flood risk No data
- FEMA flood zone
- —
- Chance of flooding over 30 yrs
- —
- Est. flood insurance / yr
- —
Fire risk No data
- Est. fire insurance / yr
- —
Heat risk No data
- Hot days now (above threshold)
- —
- Hot days in 30 yrs
- —
Wind risk No data
- Chance of severe wind over 30 yrs
- —
Air-quality risk No data
- Unhealthy air days now
- —
- Unhealthy air days in 30 yrs
- —
Risk factors via First Street. Map © Google.
Why this score? — see what drove the D grade
The composite is a weighted blend of 9 inputs, each scored 0–100. Each bar is that input's sub-score; the figure is the points it added to the 100-point composite (weight × sub-score).
- Cash flow +13.2/30.0
- Appreciation +7.3/10.0
- DSCR +4.0/10.0
- ARV discount +4.0/15.0
- Livability +3.3/5.0
- 1% rule +3.1/10.0
- Rent growth +2.5/5.0
- Condition / age +2.5/5.0
- Schools +0.4/10.0
$520,000
🖨 Deal sheet (PDF) 📄 Offer letter ✓ Due diligence
Multi-family units
County records classify this as Multi-Family (2-4 Unit). Listing-text estimate: 2 units. confirmed
Listing remarks MLS
Great money maker in the middle of CF- close to all major highways- many upgrades- a must see!
Key facts
- Townhouse style unit
- 2 family home
- 2,178 sq ft lot
Tags
Property features AI
Finance
- Financial info: Operating expenses listed at $1,500; Current actual rents reported: approximately $2,300 for the ~920-area 4-bedroom unit and $1,300 for the ~892-area 3-bedroom unit
- HOA & community: Neighborhood access to highway, public transportation, restaurants, and shopping
Exterior
- Parking: No garage; Space for 4 vehicles
- Utilities: Public water; Public sewer; Electric service with 100 amp capacity
- Home design: Multi-family property with 2 units in 1 building; Three stories
- Construction: Vinyl siding and drywall exterior finish; Brick/stone foundation
- Exterior features: Public sewer connection; Public water connection
Interior
- Kitchen: No specific kitchen appliance list provided
- Bedrooms: Two units: one 4-bedroom unit and one 3-bedroom unit
- Flooring: Hardwood floors; Ceramic tile
- Bathrooms: Three full bathrooms total in the building (unit breakdown: 4-bed unit has 2 full baths; 3-bed unit has 1 full bath)
- Heating & cooling: Gas baseboard heating
- Interior features: Full unfinished basement with interior entry; Bathtub and tub/shower
- Laundry & utility: Gas water heater
Neighborhood map
What this means for you Summary
Snapshot
- This is a 2 × 4-bed/1.5-bath units multifamily listed at $520k.
Deal economics
- At list price, monthly cash flow is $-7 ($-81/yr) — negative. Per door: $-3/mo.
- To cash-flow at today's rent, offer at most $519k (0.2% below list).
- To meet the 1% rule (rent ≥ 1% of price), the offer needs to be $419k (19.4% below list).
- Recommended offer: $419k (19.4% below list) — sets the bar for 1% rule.
- Cap rate 6.3% vs local median 5.1% in Central Falls — meaningfully above typical; check what's discounted (condition, days-on-market, listing class) to confirm the premium yield is real.
Location & tenants
- Location reads 66/100 on livability (#21 in RI) — a middle-class / working-renter tenant base. Strengths: health & safety A+, cost of living A, housing B; Watch: amenities F, commute F, employment F.
- Central Falls (suburban): math 2% / reading 8% proficiency, ranked #38 of 39 in RI (top 97%) — low school quality limits family demand, transient renter base, plan for 1-2y turnover; 78% free/reduced lunch — lower-income household profile, screen leases tightly.
- Zoned schools: Ella Risk School (math 2% / reading 12%, grade F, #158 of 167 statewide, top 97%, 430 students, 94% FRL); Calcutt Middle School (math 0% / reading 6%, grade F, #56 of 57 statewide, top 98%, 511 students, 97% FRL); Central Falls Sr High (math 2% / reading 12%, grade F, #53 of 58 statewide, top 96%, 811 students, 97% FRL) — zoned schools average 96% FRL vs 78% district-wide (18 pts higher); higher-poverty schools than district average — tighter screening recommended.
- Market conditions: 32 active listings in the ZIP; 7 comparable units currently listed for rent nearby; rentals leasing fast (median 12d on market — plan ~1-2 weeks tenant-placement turnaround); 776 units permitted in Providence County in 2024 (229 in 5+ unit buildings).
Forward outlook
- In year one you build about $27k of equity ($4k loan paydown + $24k appreciation (4.6% local appreciation)).
- Providence County population projected at +5% by 2050 — modest demand growth; plan on rents tracking national, not racing it.
- At projected returns (4.6% appreciation + 3.0% rent growth), your $146k cash investment doubles in ~5 years — after that, you're playing with house money.
- By year 2, paydown + projected appreciation supports a ~$44k cash-out refi (75% LTV) — recoverable capital for the next deal without selling this one.
Negotiation context
- Only 10 days on market — expect competitive offers; lowballing is unlikely to land.
- 7 sale attempts since 23y ago with the ask held roughly flat each time — persistent listings suggest the price (not the market) is what's stuck; bring a comps-based counter.
- Current owner paid $60k; list at $520k implies a 760% gain — meaningful room to come down on a strong offer.
Risks & watch-outs
- Watch-outs: built in 1900 — expect roof / HVAC / electrical / plumbing capex.
Questions for the listing agent
- What do current leases actually rent for vs. the listed asking? Can we see a recent rent roll and the last 12 months of T-12 income?
- Can we see the unit-by-unit rent roll, current vacancy, and any below-market leases? What's the average tenancy length?
- What capital expenditures (roof, boiler, parking lot, exteriors) have been made in the last 5 years, and what's planned in the next 2?
- Built in 1900 — when were the roof, HVAC, electrical panel, plumbing, and water heater last replaced?
- Is there a deadline driving the sale (1031 exchange, divorce, estate, relocation)? That informs how much negotiation room exists.
- Schools are F-rated, which usually means shorter tenancies and higher turnover. Who's the typical renter profile here, and what's been the actual vacancy rate?
- The area grade is low — what's the realistic commute time and amenity access for the typical tenant pool here? Any planned neighborhood developments (good or bad) we should know about?
- What's the average days-on-market for RENTAL listings here right now (not sales)? A rising rental-DOM trend means longer vacancies and softer asking-rent achievability than the comps imply.
- What's the recent tenant-quality profile in this submarket — average credit score on applications, eviction rate, late-payment / NSF rate, and stable-employment percentage? A property-management company in the area should have these aggregated.
- How much new apartment / multifamily construction is in the pipeline within 1–3 miles? Heavy new supply (>2% of stock underway) typically softens rents 12–24 months out; light construction supports rent growth.
Investment metrics
- 1% rule
- 0.81% ✗
- Cap rate
- 6.28%
- Cash-on-cash
- -0.06%
- DSCR
- 1.00
- GRM
- 10.3
CMA / ARV
- ARV (on-the-fly)
- $481,992
- Comps found
- 8
Show comp detail 8 sales within ~0.75 mi
| Address | Dist | Beds/Ba | Sqft | Sold | Price | $/sf | Match |
|---|---|---|---|---|---|---|---|
| 36 Tiffany St | 0.19mi | 5/2.0 (+1) | 1,920 (+6%) | 6mo | $510,000 | $266 | 71 |
| 603 605 Pine St | 0.14mi | 5/2.0 (+1) | 1,662 (-8%) | 10mo | $465,000 | $280 | 67 |
| 264 Cowden St | 0.18mi | 4/2.0 | 1,632 (-10%) | 15mo | $465,000 | $285 | 63 |
| 34 Lewis St | 0.62mi | 4/2.0 | 1,800 (-1%) | 10mo | $465,000 | $258 | 61 |
| 41 Hedley Ave | 0.28mi | 4/2.0 | 1,657 (-9%) | 14mo | $515,000 | $311 | 61 |
| 10 Foundry St | 0.67mi | 4/2.0 | 1,740 (-4%) | 9mo | $460,000 | $264 | 55 |
| 1 Knight St | 0.33mi | 4/2.0 | 1,551 (-14%) | 19mo | $362,000 | $233 | 45 |
| 40 Barber Ave | 0.39mi | 4/2.0 | 1,550 (-14%) | 15mo | $275,000 | $177 | 45 |
Match score weights: distance 35% · size 25% · config 20% · recency 20%. Top-matched comps best support the ARV.
Projected returns pro-forma
4.58% appreciation · 3.0% rent growth · sell at horizon
- IRR
- 11.7%
- Equity multiple
- 1.73×
- Total profit
- $106,779
- Equity at exit
- $281,338
- IRR
- 13.0%
- Equity multiple
- 3.26×
- Total profit
- $329,285
- Equity at exit
- $474,866
Cash invested: $145,600 (down + closing). Projections, not guarantees.
Landlord ↔ Tenant lean methodology
- Overall (STATE)
- 31 Tenant-Leaning
- State Rhode Island
- 31 Tenant-Leaning · D+8
- County
- — inherits STATE
- City
- — inherits STATE
ZIP-level market 02863
- Home prices YoY
- 1.2%
- Active inventory
- 32
- Price-to-rent
- 20.7×
Monthly cashflow live
- Estimated rent
- $4,189 high interval (Pro) →
- Mortgage (P&I)
- −$2,727
- Tax from tax record
- −$372 /mo · $4,469/yr
- Insurance
- −$217
- HOA
- −$0
- Vacancy / Maint / Mgmt
- −$880
- Net cashflow
- $-7
Break-even live
Sensitivity live
| Price | -10% $288 | -5% $140 | +0% $-7 | +5% $-154 | +10% $-301 |
|---|---|---|---|---|---|
| Rent | -10% $-338 | -5% $-172 | +0% $-7 | +5% $159 | +10% $324 |
| Rate | -1.0pp $255 | -0.5pp $126 | base $-7 | +0.5pp $-141 | +1.0pp $-279 |
2-unit breakdown (identical units grouped — click to expand)
| Units | Beds | Baths | Est. rent |
|---|---|---|---|
| 2× units | 4 | 1.5 | $4,188 |
| #1 | 4 | 1.5 | $2,094 |
| #2 | 4 | 1.5 | $2,094 |
| Total (2 units) | $4,189 | ||
UW: 25.0% down · 7.5% · 30yr · 1.5% tax · 5.0% vac · 8.0% maint · 8.0% mgmt
Financing live
Cash to close
- Down payment
- $130,000
- Closing costs
- $15,600
- Reserves months
- —
- Total cash needed
- —
Loan-product check · same deal, 3 products live
Conventional
25% down · 7.5% · 30yr
- Down + closing
- —
- Monthly P&I
- —
- Monthly cashflow
- —
- DSCR
- —
- Eligible?
- —
Personal DTI + credit; lowest rate.
DSCR
20% down · 8.5% · 30yr
- Down + closing
- —
- Monthly P&I
- —
- Monthly cashflow
- —
- DSCR
- —
- Eligible?
- —
No personal income docs; deal must DSCR.
Hard money
10% down · 12.0% · 12mo
- Down + closing
- —
- Monthly P&I
- —
- Monthly cashflow
- —
- DSCR
- —
- Eligible?
- —
Short-term bridge; refi at stabilization.
Rent comps 7 comps
| Address | Beds | Baths | Sqft | Rent | $/sqft | DOM | Units | Dist |
|---|---|---|---|---|---|---|---|---|
| 96 Shawmut Ave Unit 98 Central Falls, RI | 4.0 | 1.5 | 1398 | $2,700 | $1.93 | 21d | 1 | 0.43mi |
| 14 Courtland St Unit 3 Central Falls, RI | 4.0 | 1.0 | 1240 | $1,950 | $1.57 | 12d | 1 | 0.90mi |
| 14 Courtland St Unit 2 Central Falls, RI | 3.0 | 1.0 | 1240 | $1,850 | $1.49 | 12d | 1 | 0.90mi |
| 14 Carpenter St Unit 1 Cumberland, RI | 4.0 | 1.0 | 1467 | $2,850 | $1.94 | 3d | 1 | 1.06mi |
| 46 Mary St Pawtucket, RI | 3.0 | 2.0 | 1600 | $2,250 | $1.41 | 45d | 1 | 1.27mi |
| 171 N Bend St Unit 1 Pawtucket, RI | 3.0 | 2.0 | 1352 | $2,450 | $1.81 | 3d | 1 | 1.35mi |
| 40 Olney Ave Lincoln, RI | 4.0 | 3.0 | 2443 | $3,600 | $1.47 | 3d | 1 | 1.48mi |
Listing history 8 events
-
2026-06-21days on market $520,000 Active 10 DOM
-
2026-06-18days on market $520,000 Active 7 DOM
-
2026-06-17days on market $520,000 Active 6 DOM
-
2026-06-16days on market $520,000 Active 5 DOM
-
2026-06-15days on market $520,000 Active 4 DOM
-
2026-06-13days on market $520,000 Active 2 DOM
-
2026-06-13remarks 395-char remark
-
2026-06-13$520,000 Active 1 DOM
ⓘ Source: listings_history table (triggers on properties + properties_extension) + one-shot
backfill from property_details.listing_events for pre-trigger history.
Tax reassessment forecast RI · Partial reset (capped growth)
- Current annual tax
- $4,469 · $372/mo
- Projected year-2 tax
- $6,472 · $539/mo
- Expected delta
- +$2,004/yr (+$167/mo · 44.8%)
ⓘ Screening estimate from a state-policy table — verify with the county assessor before closing.
Nearby sold comps map
Loading sold comps map…
Walkable amenities ~0.75 mi
Loading nearby amenities…
Taxation est. · year 1
- Rental income
- $50,268
- − Mortgage interest
- −$29,128
- − Property taxes
- −$4,469
- − Insurance
- −$2,600
- − Repairs & maintenance
- −$4,021
- − Management
- −$4,021
- − Depreciation
- −$15,127
- Taxable loss
- −$9,099
- Est. tax savings @ 24.0%
- +$2,184
- After-tax cash flow
- $2,103/yr
For passive investors: Depreciation is non-cash, so a rental often shows a tax loss while cash-flowing — sheltering income. Rental losses are passive: they offset passive income freely, and up to $25,000/yr can offset ordinary (W-2) income if you actively participate and your MAGI is under $100k (phasing out to $0 by $150k); unused losses carry forward. On sale, claimed depreciation is recaptured at up to 25%, and gains may owe capital-gains tax (a 1031 exchange can defer both). Figures are a year-1 estimate at your 24.0% rate — not tax advice; consult a CPA.
Schools (NCES district)
- District
- Central Falls
- NCES district ID
- 4400120
- Math proficiency
- 2% ▼ -6.00%
- Reading proficiency
- 8% ▼ -5.00%
- Median HH income
- $30,478
- Composite
- 3.59/100
- National rank
- #10071
- State rank
- #38 of 39 in RI
Livability — Central Falls
- Score
- 66/100
- State rank
- #21
- US rank
- #11321
Category grades
Schools grade is shown separately in the Schools card above.
Census & demographics
- Census place
- Central Falls, RI
- County
- Providence County · 548,917 people
- City population
- 22,701
- Metro
- Providence-Warwick, RI-MA
- Population (ZIP)
- 22,701
- Household income
- $49,285
- Rent vs Own
- Severe rent burden
- 1380.0
Population outlook (Providence County) Hauer SSP2
- Today (2025)
- 653,469 people
- By 2030
- 660,819 · +1.1%
- By 2040
- 672,747 · +3.0%
- By 2050
- 683,741 · +4.6%
- By 2075
- 720,435 · +10.2%
- By 2100
- 741,582 · +13.5%
Race, ethnicity, and origin ACS 2023
- Neighborhood character
- Predominantly Hispanic (69%)
- Race & ethnicity
- Hispanic / Latino 69% Two or more races 29% White 16% Black 8%
- Hispanic origin (detail)
- Mexican 6% Puerto Rican 15% Dominican 7%
- Common ancestry
- Lithuanian 4% Russian 4% Romanian 1%
- Foreign-born
- 40% · Canada, Jamaica
- Languages at home
- 29% English-only · Spanish 62% Other Indo-European 5% French/Haitian/Cajun 3%
Political lean MEDSL · Providence
- 2024 margin
- D (+14.4) · D 56.1% · R 41.7% · Other 2.2%
- 2008→2024 swing
- -20.0pp toward R · 2008: 34.4pp · 2024: 14.4pp
- All cycles
- 2024: D+14.4 2020: D+22.9 2016: D+21.2 2012: D+34.9 2008: D+34.4
Not yet ingested
- Civics
- —
Market trends
- HPI YoY
- ▲ 4.58%
- Current HPI
- 373.2598
- Rent YoY
- —
- Metro
- Providence-Warwick, RI-MA
- State GDP YoY
- ▲ 2.25%
- F500 in state
- 10
Industry mix (Fortune 500 HQ in RI)
| Industry | F500 HQs | Revenue |
|---|---|---|
| Healthcare | 1 | $373B |
|
||
| Food Distribution | 1 | $31B |
|
||
| Aerospace / Defense | 1 | $14B |
|
||
| Financial Services | 1 | $8B |
|
||
| Consumer Goods | 1 | $4B |
|
||
Price history
+700.0% since first listed26 events — show timeline
- 2026-06-11 Listed $520,000 RIS
- 2016-02-22 Sold (MLS) $60,500 RIS
- 2016-02-19 Sold (Public Records) $60,500 Public Records
- 2016-02-18 Contingent — RIS
- 2016-01-12 Price Changed $91,000 RIS
- 2015-12-09 Price Changed $93,000 RIS
- 2015-11-16 Price Changed $95,000 RIS
- 2015-11-13 Price Changed $96,000 RIS
- 2015-11-03 Price Changed $99,000 RIS
- 2015-10-09 Listed $101,000 RIS
- 2015-10-08 Listing Removed — RIS
- 2015-09-11 Price Changed $115,500 RIS
- 2015-07-10 Price Changed $119,500 RIS
- 2015-04-16 Listed $119,999 RIS
- 2015-04-16 Listing Removed — RIS
- 2015-04-16 Listed $119,000 RIS
- 2008-10-03 Sold (Public Records) $240,000 Public Records
- 2008-08-12 Listing Removed — RIS
- 2008-04-18 Listed $190,000 RIS
- 2004-09-02 Sold (Public Records) $203,000 Public Records
- 2004-09-02 Sold (MLS) $203,000 RIS
- 2004-07-07 Listing Removed — RIS
- 2004-05-06 Listed $204,900 RIS
- 2003-10-28 Listing Removed — RIS
- 2003-09-11 Listed $135,000 RIS
- 1999-11-01 Sold (Public Records) $65,000 Public Records
Property tax history
+5.5%/yrLatest (2025): $4,469 · +5.7% YoY. Source: county tax records.
Cash-flow waterfall
monthlySold comps — $/sqft
last 12 mo · ≤1 miLoading sold comps…