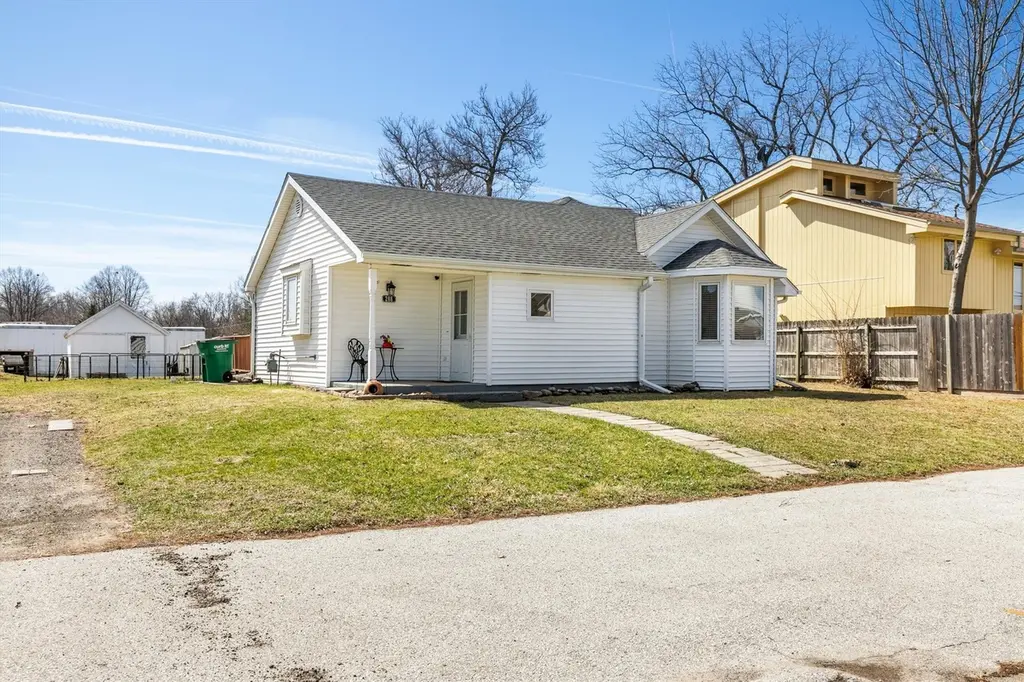
208 SE 3rd St · Grimes, IA
Flood risk 1/10 · Minimal
- FEMA flood zone
- X (unshaded)
- Chance of flooding over 30 yrs
- 0.0%
- Est. flood insurance / yr
- $473 – $860
Fire risk 1/10 · Minimal
- Est. fire insurance / yr
- $902 – $1,676
Heat risk 3/10 · Minor
- Hot days now (above 103°F)
- 7 days/yr
- Hot days in 30 yrs
- 15 days/yr
Wind risk 2/10 · Minimal
- Chance of severe wind over 30 yrs
- —
Air-quality risk 1/10 · Minimal
- Unhealthy air days now
- 0 days/yr
- Unhealthy air days in 30 yrs
- 0 days/yr
Risk factors via First Street. Map © Google.
Why this score? — see what drove the D+ grade
The composite is a weighted blend of 9 inputs, each scored 0–100. Each bar is that input's sub-score; the figure is the points it added to the 100-point composite (weight × sub-score).
- ARV discount +15.0/15.0
- Cash flow +11.9/30.0
- Schools +7.0/10.0
- Livability +4.0/5.0
- DSCR +3.5/10.0
- 1% rule +3.3/10.0
- Rent growth +2.7/5.0
- Condition / age +2.5/5.0
- Appreciation +0.0/10.0
$244,900
🖨 Deal sheet 📄 Offer letter ✓ Due diligence
Listing remarks
Welcome to this well-maintained, cozy 3-bedroom, 2-bath home offering nearly 1,600 sq ft in the heart of Grimes! Ideally located near parks, schools, and everyday amenities, many updates throughout. A cozy bump out in the living room with a window that lets in a ton of natural light! The functional layout features spacious living areas and a kitchen with a ton of counter space and cabinetry This extra cozy home has an open floor plan and a large family room. Enjoy the convenience of main floor laundry, along with wheelchair accessibility-friendly features in the primary bedroom and bath, including wider doorways and grab bars. Step outside to a nice, large deck - perfect for relaxing or
Key facts
- Large deck
- Open floor plan
- Natural light
Tags
Neighborhood map
What this means for you Summary
Snapshot
- This is a 3-bed/1.5-bath single-family listed at $245k.
Deal economics
- At list price, monthly cash flow is $-64 ($-774/yr) — negative.
- To cash-flow at today's rent, offer at most $234k (4.7% below list).
- To meet the 1% rule (rent ≥ 1% of price), the offer needs to be $203k (17.2% below list).
- Recommended offer: $203k (17.2% below list) — sets the bar for 1% rule.
- Cap rate 6.0% vs local median 2.3% in Grimes — top-decile yield for the area; either an underpriced asset or a hidden risk that comps aren't pricing in. Stress-test before assuming the spread holds.
Location & tenants
- Location reads 79/100 on livability (#106 in IA, #2,080 nationally) — a middle-class / working-renter tenant base. Strengths: schools A+, crime A+, employment A+; Watch: amenities F, commute F.
- Dallas Center-Grimes Community School District (rural): math 78% / reading 82% proficiency, ranked #19 of 289 in IA (top 7%) — strong family-tenant draw, lease renewals of 3-5y typical; only 12% free/reduced lunch — higher-income household profile.
- Market conditions: Rents flat; 327 active listings in the ZIP; 11 comparable units currently listed for rent nearby; rentals at typical pace (median 15d on market — plan ~3-4 weeks tenant-placement turnaround); high-income renter base; 2,953 units permitted in Polk County in 2024 (540 in 5+ unit buildings).
Forward outlook
- Local home prices are declining (-3.0%/yr); year-one equity from $2k of loan paydown is wiped out by about $7k of value loss. Plan a longer hold.
- Polk County population projected at +37% by 2050 — long-run rental-demand tailwind backs the buy-and-hold thesis.
Negotiation context
- It's been on market 23 days — a 2% lower offer ($241k) is reasonable based on typical stale-listing flexibility.
Risks & watch-outs
- Watch-outs: built in 1900 — expect roof / HVAC / electrical / plumbing capex.
Questions for the listing agent
- What do current leases actually rent for vs. the listed asking? Can we see a recent rent roll and the last 12 months of T-12 income?
- Built in 1900 — when were the roof, HVAC, electrical panel, plumbing, and water heater last replaced?
- Is there a deadline driving the sale (1031 exchange, divorce, estate, relocation)? That informs how much negotiation room exists.
- Schools are A-rated — typically a magnet for longer-tenancy family renters. What's the average tenant stay here, and is there a school-zone premium baked into asking?
- The area grade is low — what's the realistic commute time and amenity access for the typical tenant pool here? Any planned neighborhood developments (good or bad) we should know about?
- What's the average days-on-market for RENTAL listings here right now (not sales)? A rising rental-DOM trend means longer vacancies and softer asking-rent achievability than the comps imply.
- What's the recent tenant-quality profile in this submarket — average credit score on applications, eviction rate, late-payment / NSF rate, and stable-employment percentage? A property-management company in the area should have these aggregated.
- How much new for-sale + rental construction is in the pipeline within 1–3 miles? Heavy new supply typically softens prices + rents 12–24 months out; constrained supply supports both.
Investment metrics
- 1% rule
- 0.83% ✗
- Cap rate
- 5.98%
- Cash-on-cash
- -1.13%
- DSCR
- 0.95
- GRM
- 10.1
CMA / ARV
- ARV (on-the-fly)
- $328,339
- Comps found
- 12
Show comp detail 12 sales within ~0.75 mi
| Address | Dist | Beds/Ba | Sqft | Sold | Price | $/sf | Match |
|---|---|---|---|---|---|---|---|
| 208 SE 3rd St | 0.00mi | 3/2.0 | 1,571 (0%) | 0mo | $248,900 | $158 | 98 |
| 280 NW Prairie Creek Dr | 0.52mi | 4/2.5 (+1) | 1,568 (-0%) | 2mo | $325,000 | $207 | 65 |
| 401 NW Valley View Dr | 0.47mi | 3/1.5 | 1,440 (-8%) | 1mo | $272,000 | $189 | 63 |
| 712 SE 13th St | 0.64mi | 3/2.5 | 1,456 (-7%) | 1mo | $306,000 | $210 | 53 |
| 617 SE Meadowlark Dr | 0.37mi | 4/2.5 (+1) | 1,772 (+13%) | 0mo | $369,990 | $209 | 52 |
| 500 SE 13th St | 0.64mi | 4/3.0 (+1) | 1,498 (-5%) | 0mo | $354,500 | $237 | 51 |
| 1208 SW 4th St | 0.74mi | 3/3.0 | 1,478 (-6%) | 0mo | $305,000 | $206 | 50 |
| 108 NW 10th Cir | 0.67mi | 3/3.5 | 1,668 (+6%) | 3mo | $355,000 | $213 | 48 |
| 405 SE 13th St | 0.62mi | 4/2.5 (+1) | 1,736 (+10%) | 0mo | $335,000 | $193 | 45 |
| 500 SE 14th St | 0.71mi | 4/3.0 (+1) | 1,703 (+8%) | 0mo | $461,500 | $271 | 42 |
| 1105 SW 6th St | 0.72mi | 4/3.0 (+1) | 1,386 (-12%) | 1mo | $395,000 | $285 | 35 |
| 901 SE Woodbine Dr | 0.73mi | 4/2.5 (+1) | 1,780 (+13%) | 3mo | $350,000 | $197 | 32 |
Match score weights: distance 35% · size 25% · config 20% · recency 20%. Top-matched comps best support the ARV.
Projected returns pro-forma
-3.0% appreciation · 0.71% rent growth · sell at horizon
- IRR
- -20.7%
- Equity multiple
- 0.29×
- Total profit
- $-48,343
- Equity at exit
- $36,515
- IRR
- -20.0%
- Equity multiple
- 0.05×
- Total profit
- $-65,225
- Equity at exit
- $21,174
Cash invested: $68,572 (down + closing). Projections, not guarantees.
Landlord ↔ Tenant lean methodology
- Overall (STATE)
- 83 Strongly Landlord-Friendly
- State Iowa
- 83 Strongly Landlord-Friendly · R+6
- County
- — inherits STATE
- City
- — inherits STATE
ZIP-level market 50111
- Home prices YoY
- -11.1%
- Rents YoY
- 0.7%
- Active inventory
- 327
- Price-to-rent
- 10.1×
Monthly cashflow live
- Estimated rent
- $2,027 high interval (Pro) →
- Mortgage (P&I)
- −$1,284
- Tax from tax record
- −$280 /mo · $3,356/yr
- Insurance
- −$102
- HOA
- −$0
- Vacancy / Maint / Mgmt
- −$426
- Net cashflow
- $-64
Break-even live
UW: 25.0% down · 7.5% · 30yr · 1.5% tax · 5.0% vac · 8.0% maint · 8.0% mgmt
Financing live
Cash to close
- Down payment
- $61,225
- Closing costs
- $7,347
- Reserves months
- —
- Total cash needed
- —
Loan-product check · same deal, 3 products live
Conventional
25% down · 7.5% · 30yr
- Down + closing
- —
- Monthly P&I
- —
- Monthly cashflow
- —
- DSCR
- —
- Eligible?
- —
Personal DTI + credit; lowest rate.
DSCR
20% down · 8.5% · 30yr
- Down + closing
- —
- Monthly P&I
- —
- Monthly cashflow
- —
- DSCR
- —
- Eligible?
- —
No personal income docs; deal must DSCR.
Hard money
10% down · 12.0% · 12mo
- Down + closing
- —
- Monthly P&I
- —
- Monthly cashflow
- —
- DSCR
- —
- Eligible?
- —
Short-term bridge; refi at stabilization.
Rent comps 11 comps
| Address | Beds | Baths | Sqft | Rent | $/sqft | DOM | Units | Dist |
|---|---|---|---|---|---|---|---|---|
| 301 SE 4th St Grimes, IA | 3.0 | 2.5 | 1619 | $2,195 | $1.36 | 44d | 1 | 0.05mi |
| 305 SE 4th St Grimes, IA | 3.0 | 2.5 | 1651 | $2,090 | $1.27 | 14d | 1 | 0.05mi |
| 317 SE 4th St Grimes, IA | 3.0 | 2.5 | 1619 | $2,195 | $1.36 | 14d | 1 | 0.07mi |
| 301 SE 11th St #706 Grimes, IA | 2.0 | 2.5 | 1144 | $1,750 | $1.53 | 14d | 1 | 0.46mi |
| 301 SE 11th St #703 Grimes, IA | 3.0 | 2.5 | 1568 | $1,895 | $1.21 | 14d | 1 | 0.46mi |
| 1250 SE 11th St Grimes, IA | 1.0–3.0 | 1.0–2.0 | 921 | $1,487 | $1.61 | 14d | 15 | 0.79mi |
| 1951 N James St Unit 107 Grimes, IA | 3.0 | 2.0 | 1150 | $1,295 | $1.13 | 14d | 1 | 1.24mi |
| 935 SE Silkwood Ln Grimes, IA | 1.0–2.0 | 1.0–2.0 | 914 | $1,436 | $1.57 | 14d | 27 | 1.27mi |
| 1704 NE Gateway Ct Grimes, IA | 3.0 | 1.0–2.0 | 945 | $1,899 | $2.01 | 14d | 50 | 1.31mi |
| 1851 NE Little Beaver Dr Grimes, IA | 4.0 | 3.0 | 2165 | $2,595 | $1.20 | 14d | 1 | 1.33mi |
| 1360 NE Primrose Ln Grimes, IA | 3.0 | 1.0–2.5 | 893 | $1,700 | $1.90 | 14d | 37 | 1.41mi |
Listing history 2 events
-
2026-04-17status Pending
-
2026-03-25$244,900 Active
ⓘ Source: listings_history table (triggers on properties + properties_extension) + one-shot
backfill from property_details.listing_events for pre-trigger history.
Tax reassessment forecast IA · Partial reset (capped growth)
- Current annual tax
- $3,356 · $280/mo
- Projected year-2 tax
- $3,600 · $300/mo
- Expected delta
- +$244/yr (+$20/mo · 7.3%)
ⓘ Screening estimate from a state-policy table — verify with the county assessor before closing.
Climate risk First Street
- Flood 1/10 Low FEMA zone X (unshaded) · 0% chance over 30 yrs
- Wildfire 1/10 Low
- Heat 3/10 Moderate 7 d/yr ≥103°F today · 15 d/yr by 30 yrs out
- Wind 2/10 Low
- Air quality 1/10 Low 0 unhealthy d/yr today · 0 by 30 yrs out
Nearby sold comps map
Loading sold comps map…
Walkable amenities ~0.75 mi
Loading nearby amenities…
Taxation est. · year 1
- Rental income
- $24,327
- − Mortgage interest
- −$13,718
- − Property taxes
- −$3,356
- − Insurance
- −$1,224
- − Repairs & maintenance
- −$1,946
- − Management
- −$1,946
- − Depreciation
- −$7,124
- Taxable loss
- −$4,989
- Est. tax savings @ 24.0%
- +$1,197
- After-tax cash flow
- $424/yr
For passive investors: Depreciation is non-cash, so a rental often shows a tax loss while cash-flowing — sheltering income. Rental losses are passive: they offset passive income freely, and up to $25,000/yr can offset ordinary (W-2) income if you actively participate and your MAGI is under $100k (phasing out to $0 by $150k); unused losses carry forward. On sale, claimed depreciation is recaptured at up to 25%, and gains may owe capital-gains tax (a 1031 exchange can defer both). Figures are a year-1 estimate at your 24.0% rate — not tax advice; consult a CPA.
Schools (NCES district)
- District
- Dallas Center-Grimes Community School District
- NCES district ID
- 1908520
- Math proficiency
- 78% ▼ -7.00%
- Reading proficiency
- 82% ▼ -1.00%
- Median HH income
- $73,781
- Composite
- 69.92/100
- National rank
- #285
- State rank
- #19 of 289 in IA
Livability — Grimes
- Score
- 79/100
- State rank
- #106
- US rank
- #2080
Category grades
Schools grade is shown separately in the Schools card above.
Census & demographics
- Census place
- Grimes, IA
- County
- Polk County · 453,298 people
- City population
- 16,865
- Metro
- Des Moines-West Des Moines, IA
- Population (ZIP)
- 16,865
- Household income
- $120,769
- Rent vs Own
- Severe rent burden
- 249.0
Population outlook (Polk County) Hauer SSP2
- Today (2025)
- 548,042 people
- By 2030
- 588,557 · +7.4%
- By 2040
- 670,629 · +22.4%
- By 2050
- 752,830 · +37.4%
- By 2075
- 955,069 · +74.3%
- By 2100
- 1,115,436 · +103.5%
Race, ethnicity, and origin ACS 2023
- Neighborhood character
- Predominantly White (85%)
- Race & ethnicity
- White 85% Hispanic / Latino 6% Two or more races 5% Asian 3% Black 2%
- Hispanic origin (detail)
- Mexican 4%
- Common ancestry
- Portuguese 3% Italian 3% Iranian 2%
- Foreign-born
- 6% · China, Canada
- Languages at home
- 92% English-only · Other Asian/Pacific 3% Spanish 2% Other Indo-European 1%
Political lean MEDSL · Polk
- 2024 margin
- D (+10.9) · D 54.8% · R 43.9% · Other 1.3%
- 2008→2024 swing
- -3.7pp toward R · 2008: 14.6pp · 2024: 10.9pp
- All cycles
- 2024: D+10.9 2020: D+15.2 2016: D+11.5 2012: D+14.2 2008: D+14.6
Not yet ingested
- Civics
- —
Market trends
- HPI YoY
- ▼ -30.93%
- Current HPI
- 249.0614
- Rent YoY
- ▲ 0.71%
- Metro
- Des Moines-West Des Moines, IA
- State GDP YoY
- ▲ 2.48%
- F500 in state
- 4
Industry mix (Fortune 500 HQ in IA)
| Industry | F500 HQs | Revenue |
|---|---|---|
| Financial Services | 1 | $16B |
|
||
| Retail / Convenience | 1 | $15B |
|
||
Price history
2 events — show timeline
- 2026-04-17 Pending — DMMLS
- 2026-03-25 Listed $244,900 DMMLS
Property tax history
+4.0%/yrLatest (2025): $3,356 · -1.1% YoY. Source: county tax records.
Cash-flow waterfall
monthlySold comps — $/sqft
last 12 mo · ≤1 miLoading sold comps…