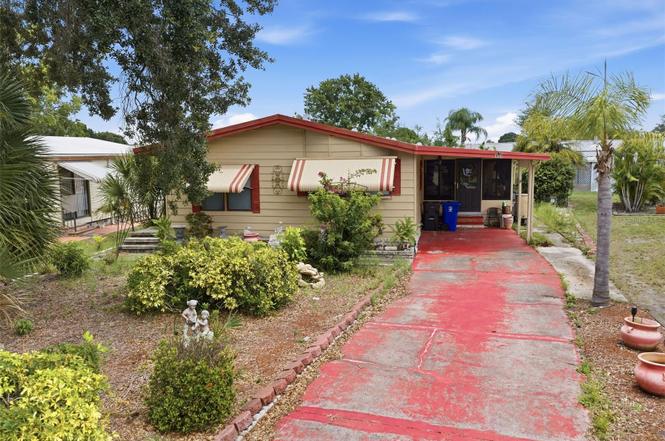
410 Dolphin Dr S · Oldsmar, FL
Flood risk 9/10 · Severe
- FEMA flood zone
- AE
- Chance of flooding over 30 yrs
- 0.99%
- Est. flood insurance / yr
- $1,737 – $8,500
Fire risk 3/10 · Minor
- Est. fire insurance / yr
- $947 – $1,759
Heat risk 10/10 · Severe
- Hot days now (above 107°F)
- 7 days/yr
- Hot days in 30 yrs
- 25 days/yr
Wind risk 10/10 · Severe
- Chance of severe wind over 30 yrs
- 99.0%
Air-quality risk 3/10 · Minor
- Unhealthy air days now
- 3 days/yr
- Unhealthy air days in 30 yrs
- 3 days/yr
Risk factors via First Street. Map © Google.
Why this score? — see what drove the B- grade
The composite is a weighted blend of 9 inputs, each scored 0–100. Each bar is that input's sub-score; the figure is the points it added to the 100-point composite (weight × sub-score).
- Cash flow +26.6/30.0
- ARV discount +9.9/15.0
- DSCR +9.1/10.0
- 1% rule +6.7/10.0
- Schools +4.3/10.0
- Livability +4.2/5.0
- Condition / age +2.5/5.0
- Rent growth +1.9/5.0
- Appreciation +0.0/10.0
$175,000
🖨 Deal sheet 📄 Offer letter ✓ Due diligence
Listing remarks MLS
Bankowned. Wonderful retirement community with land ownership. Features clubhouse, heated pool and spa, pool table, card games, library and more. Open floor plan. This 2 bedroom / 2 Bathroom home has lots of potential. Close to shopping anddining and much more. Don't delay come see you're new home today. Lowest price in Gull Aire Village! Price to sell!
Key facts
- Minutes from beaches
- Own the land
- Affordable hoa fee
Tags
Property features AI
Finance
- Other: Property listed as a fixer (needs repairs)
- Financial info: Lease restrictions apply
- HOA & community: Gull Aire Village Association (monthly fee $70); HOA fee includes pool; Association approval required; Senior community; Pets allowed
Exterior
- Parking: Carport with 1 space
- Utilities: Public water; Public sewer; Public utilities
- Home design: Manufactured double-wide home; Attached property; One story; Faces southeast
- Construction: Vinyl siding; Shingle roof; Built on crawlspace
- Exterior features: Private mailbox; In-ground pool; Paved road access; Lot dimensions approximately 46 x 123
Interior
- Kitchen: Cooktop; Range; Dishwasher; Refrigerator
- Bedrooms: 2 bedrooms
- Flooring: Carpet; Vinyl
- Bathrooms: 2 full bathrooms
- Heating & cooling: Central heating; Central air conditioning
- Interior features: Living room and dining room combo
- Laundry & utility: Inside laundry; Washer; Dryer; Crawlspace foundation (utility access)
Neighborhood map
What this means for you Summary
Snapshot
- This is a 2-bed/2.0-bath manufactured listed at $175k.
Deal economics
- At list price, monthly cash flow is $42 ($505/yr) — positive.
- The deal already cash-flows at list — no discount required.
- Meets the 1% rule at list price ($2k rent vs $175k).
- Cap rate 9.5% vs local median 2.8% in Oldsmar — top-decile yield for the area; either an underpriced asset or a hidden risk that comps aren't pricing in. Stress-test before assuming the spread holds.
Location & tenants
- Location reads 83/100 on livability (#49 in FL, #908 nationally) — a professional / high-income tenant draw. Strengths: housing A+, health & safety A+, commute A; Watch: amenities D-.
- Pinellas (suburban): math 51% / reading 51% proficiency, ranked #31 of 73 in FL (top 42%) — acceptable for families but not a draw, mixed tenant base, ~2y average lease.
- Market conditions: Rents soft (-2.6%/yr); 283 active listings in the ZIP; 40 comparable units currently listed for rent nearby; rentals at typical pace (median 20d on market — plan ~3-4 weeks tenant-placement turnaround); solid renter incomes; 2,676 units permitted in Pinellas County in 2024 (1,422 in 5+ unit buildings).
Forward outlook
- Local home prices are declining (-3.0%/yr); year-one equity from $1k of loan paydown is wiped out by about $5k of value loss. Plan a longer hold.
- Pinellas County population projected at +14% by 2050 — modest demand growth; plan on rents tracking national, not racing it.
Negotiation context
- Only 2 days on market — expect competitive offers; lowballing is unlikely to land.
- 3 sale attempts since 20y ago with the ask held roughly flat each time — persistent listings suggest the price (not the market) is what's stuck; bring a comps-based counter.
- Current owner paid $38k; list at $175k implies a 355% gain — meaningful room to come down on a strong offer.
Risks & watch-outs
- Watch-outs: flood insurance adds $427/mo.
- Climate carrying-cost: in FEMA flood zone AE (mandatory federal flood insurance); severe wind risk, 99% chance of damaging wind over 30y; extreme-heat days projected 7→25/yr by 2055 (HVAC capex compounding) — expect insurance premiums to compound above CPI over the hold.
Questions for the listing agent
- What's the actual annual flood-insurance premium (NFIP or private), and is the property in a SFHA with mandatory coverage?
- What does the HOA fee cover, when was the last increase, and are there any pending special assessments or reserve-fund shortfalls?
- Is there a deadline driving the sale (1031 exchange, divorce, estate, relocation)? That informs how much negotiation room exists.
- Schools are B-rated — typically a magnet for longer-tenancy family renters. What's the average tenant stay here, and is there a school-zone premium baked into asking?
- What's the average days-on-market for RENTAL listings here right now (not sales)? A rising rental-DOM trend means longer vacancies and softer asking-rent achievability than the comps imply.
- What's the recent tenant-quality profile in this submarket — average credit score on applications, eviction rate, late-payment / NSF rate, and stable-employment percentage? A property-management company in the area should have these aggregated.
- How much new for-sale + rental construction is in the pipeline within 1–3 miles? Heavy new supply typically softens prices + rents 12–24 months out; constrained supply supports both.
Investment metrics
- 1% rule
- 1.17% ✓
- Cap rate
- 9.51%
- Cash-on-cash
- 11.48%
- DSCR
- 1.51
- GRM
- 7.1
CMA / ARV
- ARV (on-the-fly)
- $184,836
- Comps found
- 12
Show comp detail 12 sales within ~0.75 mi
| Address | Dist | Beds/Ba | Sqft | Sold | Price | $/sf | Match |
|---|---|---|---|---|---|---|---|
| 223 Dolphin Dr N | 0.11mi | 2/2.0 | 1,150 (-9%) | 2mo | $235,000 | $204 | 78 |
| 8 Pelican Dr N | 0.23mi | 2/2.0 | 1,336 (+6%) | 5mo | $195,000 | $146 | 76 |
| 306 Snook Ct | 0.20mi | 2/2.0 | 1,384 (+9%) | 2mo | $170,000 | $123 | 74 |
| 369 Cobia Way | 0.07mi | 2/2.0 | 1,382 (+9%) | 11mo | $160,000 | $116 | 72 |
| 119 Dolphin Dr S | 0.16mi | 2/2.0 | 1,412 (+12%) | 12mo | $250,000 | $177 | 63 |
| 245 Pelican Dr N | 0.16mi | 2/2.0 | 1,104 (-13%) | 10mo | $169,900 | $154 | 63 |
| 84 Jacaranda Dr #15 | 0.69mi | 2/2.0 | 1,180 (-7%) | 1mo | $185,000 | $157 | 56 |
| 48 Sugar Bear Dr #17 | 0.61mi | 3/2.0 (+1) | 1,300 (+3%) | 14mo | $165,000 | $127 | 50 |
| 38 Willow Creek Ct #5 | 0.63mi | 2/2.0 | 1,120 (-12%) | 1mo | $142,500 | $127 | 50 |
| 43 New Fawn Ct #28 | 0.54mi | 2/2.0 | 1,104 (-13%) | 17mo | $179,000 | $162 | 40 |
| 70 Live Oak Ct #21 | 0.73mi | 2/2.0 | 1,100 (-13%) | 8mo | $115,000 | $105 | 38 |
| 133 Clubview Dr #137 | 0.58mi | 3/2.0 (+1) | 1,450 (+14%) | 14mo | $180,000 | $124 | 32 |
Match score weights: distance 35% · size 25% · config 20% · recency 20%. Top-matched comps best support the ARV.
Projected returns pro-forma
-3.0% appreciation · 0.0% rent growth · sell at horizon
- IRR
- -18.9%
- Equity multiple
- 0.36×
- Total profit
- $-31,409
- Equity at exit
- $26,093
- IRR
- -22.4%
- Equity multiple
- 0.06×
- Total profit
- $-46,004
- Equity at exit
- $15,131
Cash invested: $49,000 (down + closing). Projections, not guarantees.
Landlord ↔ Tenant lean methodology
- Overall (STATE)
- 87 Strongly Landlord-Friendly
- State Florida
- 87 Strongly Landlord-Friendly · R+3
- County
- — inherits STATE
- City
- — inherits STATE
ZIP-level market 34677
- Rents YoY
- -2.6%
- Active inventory
- 283
- Price-to-rent
- 7.1×
Monthly cashflow live
- Estimated rent
- $2,043 high interval (Pro) →
- Mortgage (P&I)
- −$918
- Tax from tax record
- −$85 /mo · $1,015/yr
- Insurance
- −$73
- Flood insurance flood zone
- −$427 /mo · $5,118/yr
- HOA
- −$70
- Vacancy / Maint / Mgmt
- −$429
- Net cashflow
- $42
Break-even live
UW: 25.0% down · 7.5% · 30yr · 1.5% tax · 5.0% vac · 8.0% maint · 8.0% mgmt
Financing live
Cash to close
- Down payment
- $43,750
- Closing costs
- $5,250
- Reserves months
- —
- Total cash needed
- —
Loan-product check · same deal, 3 products live
Conventional
25% down · 7.5% · 30yr
- Down + closing
- —
- Monthly P&I
- —
- Monthly cashflow
- —
- DSCR
- —
- Eligible?
- —
Personal DTI + credit; lowest rate.
DSCR
20% down · 8.5% · 30yr
- Down + closing
- —
- Monthly P&I
- —
- Monthly cashflow
- —
- DSCR
- —
- Eligible?
- —
No personal income docs; deal must DSCR.
Hard money
10% down · 12.0% · 12mo
- Down + closing
- —
- Monthly P&I
- —
- Monthly cashflow
- —
- DSCR
- —
- Eligible?
- —
Short-term bridge; refi at stabilization.
Rent comps 40 comps
| Address | Beds | Baths | Sqft | Rent | $/sqft | DOM | Units | Dist |
|---|---|---|---|---|---|---|---|---|
| 225 Tarpon Ln Oldsmar, FL | 2.0 | 2.0 | 1120 | $2,400 | $2.14 | 4d | 1 | 0.11mi |
| 116 Dolphin Dr S Oldsmar, FL | 2.0 | 2.0 | 1090 | $2,550 | $2.34 | 12d | 1 | 0.21mi |
| 1 Pelican Dr N Oldsmar, FL | 2.0 | 2.0 | 960 | $2,000 | $2.08 | 10d | 1 | 0.22mi |
| 211 Countryside Key Blvd Oldsmar, FL | 2.0 | 2.5 | 1280 | $1,899 | $1.48 | 24d | 1 | 0.29mi |
| 2012 Dover Ct Oldsmar, FL | 2.0 | 2.0 | 1143 | $2,200 | $1.92 | 24d | 1 | 0.34mi |
| 1924 Dover Ct Oldsmar, FL | 3.0 | 2.0 | 1269 | $2,315 | $1.82 | 7d | 1 | 0.42mi |
| 1810 Driftwood Cir S Oldsmar, FL | 2.0 | 2.0 | 1456 | $2,700 | $1.85 | 4d | 1 | 0.69mi |
| 108 Nina Way #3 Oldsmar, FL | 2.0 | 2.0 | 1094 | $1,695 | $1.55 | 24d | 1 | 0.71mi |
| 161 Lakeside Dr Oldsmar, FL | 2.0 | 2.0 | 1094 | $2,000 | $1.83 | 17d | 1 | 0.72mi |
| 3001 Landmark Blvd #101 Palm Harbor, FL | 2.0 | 2.0 | 1353 | $1,950 | $1.44 | 24d | 1 | 0.72mi |
| 107 Windward Pl Unit 107 Oldsmar, FL | 2.0 | 2.0 | 879 | $2,000 | $2.28 | 17d | 1 | 0.78mi |
| 114 Meadow Ln #114 Oldsmar, FL | 2.0 | 2.0 | 879 | $1,700 | $1.93 | 24d | 1 | 0.85mi |
| 112 Woodlands Ct Unit 1 Oldsmar, FL | 2.0 | 2.0 | 1196 | $1,800 | $1.51 | 24d | 1 | 0.86mi |
| 122 Caryl Way Bldg 1 Oldsmar, FL | 2.0 | 2.0 | 1094 | $1,850 | $1.69 | 24d | 1 | 0.88mi |
| 218 Caryl Way Oldsmar, FL | 2.0 | 2.0 | 1094 | $1,740 | $1.59 | 12d | 1 | 0.88mi |
| 109 Nancy Dr Oldsmar, FL | 2.0 | 2.0 | 1094 | $1,750 | $1.60 | 16d | 1 | 0.89mi |
| 109 Nancy Dr Oldsmar, FL | 2.0 | 2.0 | 1094 | $1,750 | $1.60 | 3d | 1 | 0.89mi |
| 3455 Countryside Blvd #4 Clearwater, FL | 3.0 | 2.0 | 995 | $2,050 | $2.06 | 4d | 1 | 0.95mi |
| 284 Woodlake Wynde Oldsmar, FL | 2.0 | 2.0 | 924 | $2,000 | $2.16 | 24d | 1 | 1.03mi |
| 336 Woodlake Wynde Oldsmar, FL | 2.0 | 2.0 | 924 | $2,000 | $2.16 | 17d | 1 | 1.03mi |
| 103 Palmetto Ct #103 Oldsmar, FL | 2.0 | 2.0 | 1054 | $1,800 | $1.71 | 24d | 1 | 1.05mi |
| 207 Palmetto Ct Oldsmar, FL | 2.0 | 2.0 | 1054 | $1,700 | $1.61 | 24d | 1 | 1.05mi |
| 109 Pine Ct Oldsmar, FL | 2.0 | 2.0 | 1054 | $2,300 | $2.18 | 24d | 1 | 1.05mi |
| 3460 Countryside Blvd #60 Clearwater, FL | 2.0 | 2.5 | 1349 | $2,500 | $1.85 | 7d | 1 | 1.07mi |
| 3590 Magnolia Ridge Cir Unit G Palm Harbor, FL | 2.0 | 2.0 | 1090 | $1,695 | $1.56 | 24d | 1 | 1.08mi |
| 207 Woodlake Wynde Unit 207 Oldsmar, FL | 2.0 | 2.0 | 924 | $2,100 | $2.27 | 24d | 1 | 1.09mi |
| 132 E Cypress Ct Oldsmar, FL | 2.0 | 2.0 | 1054 | $1,800 | $1.71 | 20d | 1 | 1.10mi |
| 274 Cypress Ln Oldsmar, FL | 2.0 | 2.0 | 1054 | $1,600 | $1.52 | 24d | 1 | 1.11mi |
| 135 W Cypress Ct Oldsmar, FL | 2.0 | 2.0 | 1054 | $2,100 | $1.99 | 24d | 1 | 1.11mi |
| 3640 Meriden Ave Unit 3 Oldsmar, FL | 2.0 | 1.0 | 980 | $1,575 | $1.61 | 12d | 1 | 1.12mi |
| 3583 Whispering Oaks Ln Palm Harbor, FL | 2.0 | 2.5 | 1124 | $1,800 | $1.60 | 24d | 1 | 1.13mi |
| 244 Cypress Ln Unit 244 Oldsmar, FL | 2.0 | 2.0 | 1053 | $2,000 | $1.90 | 24d | 1 | 1.13mi |
| 212 Cypress Ln Oldsmar, FL | 2.0 | 2.0 | 1053 | $1,600 | $1.52 | 7d | 1 | 1.13mi |
| 2998 Bonaventure Cir #104 Palm Harbor, FL | 2.0 | 2.0 | 900 | $1,828 | $2.03 | 4d | 1 | 1.14mi |
| 3664 Meriden Ave Unit A Oldsmar, FL | 2.0 | 2.0 | 970 | $1,795 | $1.85 | 24d | 1 | 1.16mi |
| 3028 Bonaventure Cir #103 Palm Harbor, FL | 2.0 | 2.0 | 900 | $1,500 | $1.67 | 24d | 1 | 1.16mi |
| 2897 Thaxton Dr #65 Palm Harbor, FL | 2.0 | 2.5 | 1390 | $2,280 | $1.64 | 4d | 1 | 1.20mi |
| 2879 Thaxton Dr #55 Palm Harbor, FL | 2.0 | 2.5 | 1396 | $2,200 | $1.58 | 4d | 1 | 1.21mi |
| 3149 Huron Ave Oldsmar, FL | 2.0 | 2.0 | 1150 | $1,595 | $1.39 | 17d | 1 | 1.23mi |
| 2843 Thaxton Dr #38 Palm Harbor, FL | 2.0 | 2.5 | 1406 | $2,000 | $1.42 | 4d | 1 | 1.23mi |
HOA detail
- Monthly dues
- $70 · $840/yr
- Likely covers
- pool
Listing history 3 events
-
2026-06-18days on market $175,000 Active 2 DOM
-
2026-06-17remarks 699-char remark
-
2026-06-17$175,000 Active 1 DOM
ⓘ Source: listings_history table (triggers on properties + properties_extension) + one-shot
backfill from property_details.listing_events for pre-trigger history.
Tax reassessment forecast FL · Resets to sale price
- Current annual tax
- $1,015 · $85/mo
- Projected year-2 tax
- $1,452 · $121/mo
- Expected delta
- +$438/yr (+$36/mo · 43.2%)
ⓘ Screening estimate from a state-policy table — verify with the county assessor before closing.
Climate risk First Street
- Flood 9/10 Extreme FEMA zone AE · 99% chance over 30 yrs
- Wildfire 3/10 Moderate
- Heat 10/10 Extreme 7 d/yr ≥107°F today · 25 d/yr by 30 yrs out
- Wind 10/10 Extreme 99% chance of damaging wind over 30 yrs
- Air quality 3/10 Moderate 3 unhealthy d/yr today · 3 by 30 yrs out
Nearby sold comps map
Loading sold comps map…
Walkable amenities ~0.75 mi
Loading nearby amenities…
Taxation est. · year 1
- Rental income
- $24,514
- − Mortgage interest
- −$9,803
- − Property taxes
- −$1,015
- − Insurance
- −$5,994
- − Repairs & maintenance
- −$1,961
- − Management
- −$1,961
- − HOA
- −$840
- − Depreciation
- −$5,091
- Taxable loss
- −$2,150
- Est. tax savings @ 24.0%
- +$516
- After-tax cash flow
- $1,021/yr
For passive investors: Depreciation is non-cash, so a rental often shows a tax loss while cash-flowing — sheltering income. Rental losses are passive: they offset passive income freely, and up to $25,000/yr can offset ordinary (W-2) income if you actively participate and your MAGI is under $100k (phasing out to $0 by $150k); unused losses carry forward. On sale, claimed depreciation is recaptured at up to 25%, and gains may owe capital-gains tax (a 1031 exchange can defer both). Figures are a year-1 estimate at your 24.0% rate — not tax advice; consult a CPA.
Schools (NCES district)
- District
- Pinellas
- NCES district ID
- 1201560
- Math proficiency
- 51% ▼ -5.00%
- Reading proficiency
- 51% ▼ -3.00%
- Median HH income
- $46,270
- Composite
- 43.27/100
- National rank
- #3046
- State rank
- #31 of 73 in FL
Livability — Oldsmar
- Score
- 83/100
- State rank
- #49
- US rank
- #908
Category grades
Schools grade is shown separately in the Schools card above.
Census & demographics
- Census place
- Oldsmar, FL
- County
- Pinellas County · 939,478 people
- City population
- 22,762
- Metro
- Tampa-St. Petersburg-Clearwater, FL
- Population (ZIP)
- 22,762
- Household income
- $93,474
- Rent vs Own
- Severe rent burden
- 548.0
Population outlook (Pinellas County) Hauer SSP2
- Today (2025)
- 1,027,532 people
- By 2030
- 1,063,586 · +3.5%
- By 2040
- 1,125,020 · +9.5%
- By 2050
- 1,168,637 · +13.7%
- By 2075
- 1,265,188 · +23.1%
- By 2100
- 1,260,357 · +22.7%
Race, ethnicity, and origin ACS 2023
- Neighborhood character
- Predominantly White (72%)
- Race & ethnicity
- White 72% Hispanic / Latino 15% Two or more races 11% Black 4% Asian 4%
- Hispanic origin (detail)
- Mexican 3% Puerto Rican 4% Cuban 2%
- Common ancestry
- Romanian 5% Slovak 3% Lithuanian 2%
- Foreign-born
- 12% · Canada, Jamaica, China
- Languages at home
- 85% English-only · Spanish 8% Other Indo-European 3% Russian/Polish/Slavic 1%
Political lean MEDSL · Pinellas
- 2024 margin
- Lean R (+5.2) · D 46.9% · R 52.1%
- 2008→2024 swing
- -13.5pp toward R · 2008: 8.3pp · 2024: -5.2pp
- All cycles
- 2024: R+5.2 2020: D+0.2 2016: R+1.1 2012: D+5.6 2008: D+8.3
Not yet ingested
- Civics
- —
Market trends
- HPI YoY
- ▼ -215.17%
- Current HPI
- 296.7786
- Rent YoY
- ▼ -2.58%
- Metro
- Tampa-St. Petersburg-Clearwater, FL
- State GDP YoY
- ▲ 3.28%
- F500 in state
- 36
Industry mix (Fortune 500 HQ in FL)
| Industry | F500 HQs | Revenue |
|---|---|---|
| Industrial Technology | 2 | $29B |
|
||
| Insurance | 2 | $17B |
|
||
| Retail | 1 | $60B |
|
||
| Technology Distribution | 1 | $58B |
|
||
| Homebuilding | 1 | $35B |
|
||
| Technology Manufacturing | 1 | $35B |
|
||
Price history
+1844.4% since first listed7 events — show timeline
- 2026-06-16 Listed $175,000 Stellar MLS as Distributed by MLS Grid
- 2010-12-31 Sold (MLS) $38,500 Stellar MLS as Distributed by MLS Grid
- 2010-08-05 Listed $34,500 Stellar MLS as Distributed by MLS Grid
- 2006-05-16 Listed $110,000 Stellar MLS as Distributed by MLS Grid
- 1994-12-28 Sold (Public Records) $51,000 Public Records
- 1991-12-05 Sold (Public Records) $41,500 Public Records
- 1984-11-01 Sold (Public Records) $9,000 Public Records
Property tax history
+0.3%/yrLatest (2025): $1,015 · +2.6% YoY. Source: county tax records.
Cash-flow waterfall
monthlySold comps — $/sqft
last 12 mo · ≤1 miLoading sold comps…