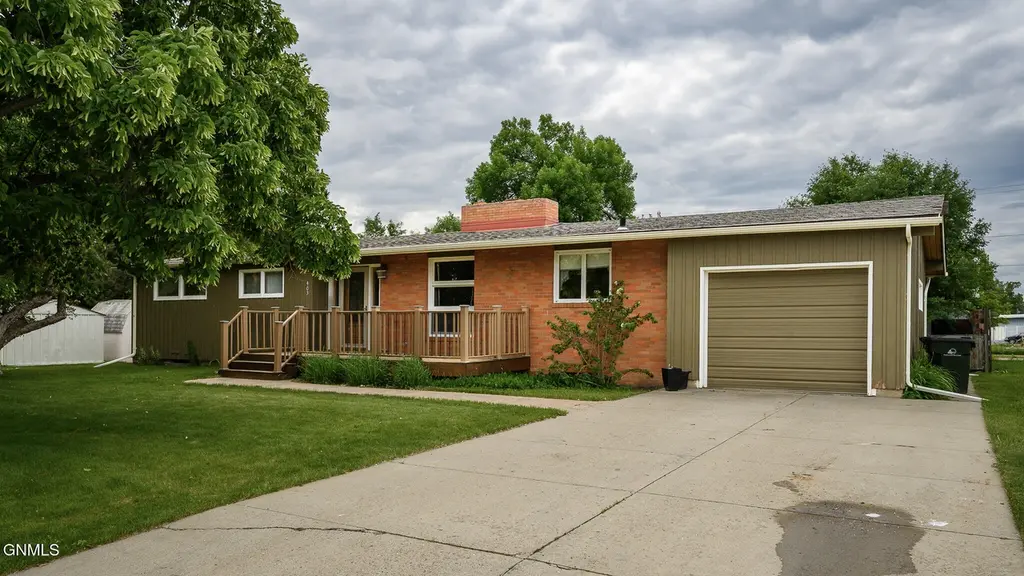
403 3rd St NW · Hazen, ND
Flood risk No data
- FEMA flood zone
- —
- Chance of flooding over 30 yrs
- —
- Est. flood insurance / yr
- —
Fire risk No data
- Est. fire insurance / yr
- —
Heat risk No data
- Hot days now (above threshold)
- —
- Hot days in 30 yrs
- —
Wind risk No data
- Chance of severe wind over 30 yrs
- —
Air-quality risk No data
- Unhealthy air days now
- —
- Unhealthy air days in 30 yrs
- —
Risk factors via First Street. Map © Google.
Why this score? — see what drove the D grade
The composite is a weighted blend of 9 inputs, each scored 0–100. Each bar is that input's sub-score; the figure is the points it added to the 100-point composite (weight × sub-score).
- Appreciation +10.0/10.0
- Cash flow +8.5/30.0
- ARV discount +7.5/15.0
- Schools +3.9/10.0
- Livability +3.8/5.0
- Rent growth +2.5/5.0
- Condition / age +2.5/5.0
- DSCR +2.3/10.0
- 1% rule +1.7/10.0
$211,999
🖨 Deal sheet (PDF) 📄 Offer letter ✓ Due diligence
Key facts
- 7,500 sq ft lot
- Garage
- Built 1960
Property features AI
Exterior
- Parking: One-car garage; Driveway parking; On-street parking
- Utilities: Public water; Public sewer
- Home design: Single family residence; Residential property
- Construction: Wood siding; Shingle roof
- Exterior features: Rain gutters; Partial fencing; Rear and front sprinklers; Rectangular lot
Interior
- Kitchen: Dishwasher; Gas range; Microwave; Refrigerator
- Flooring: Ceramic tile; Linoleum
- Bathrooms: One full bathroom; One three-quarter bathroom
- Heating & cooling: Baseboard heating; Ceiling fan(s); Wall/window cooling units
- Interior features: Ceiling fans; Two fireplaces located in the basement, dining room and living room; Partially finished basement
Neighborhood map
What this means for you Summary
Snapshot
- This is a 4-bed/2.0-bath other listed at $212k.
Deal economics
- At list price, monthly cash flow is $-185 ($-2k/yr) — negative.
- To cash-flow at today's rent, offer at most $179k (15.4% below list).
- To meet the 1% rule (rent ≥ 1% of price), the offer needs to be $141k (33.5% below list).
- Recommended offer: $141k (33.5% below list) — sets the bar for 1% rule.
Location & tenants
- Location reads 75/100 on livability (#25 in ND, #4,265 nationally) — a middle-class / working-renter tenant base. Strengths: crime A+, employment A+, cost of living A+; Watch: amenities F, commute F, health & safety D-.
- Hazen 3 (rural): math 41% / reading 45% proficiency, ranked #22 of 53 in ND (top 42%) — families likely to look elsewhere, expect single-tenant / working-renter base with shorter leases; only 14% free/reduced lunch — higher-income household profile.
- Zoned schools: Hazen Elementary School (math 52% / reading 47%, grade D, #65 of 236 statewide, top 37%, 274 students, 19% FRL); Hazen Middle School (math 27% / reading 37%, grade F, #30 of 35 statewide, top 85%, 131 students, 17% FRL); Hazen High School (math 44% / reading 54%, grade D, #19 of 144 statewide, top 19%, 163 students, 12% FRL) — zoned schools at 16% FRL track the district average.
- Market conditions: 38 active listings in the ZIP; 15 units permitted in Mercer County in 2024 (0 in 5+ unit buildings).
Forward outlook
- In year one you build about $23k of equity ($1k loan paydown + $21k appreciation (10.0% local appreciation)).
- Mercer County population projected at +38% by 2050 — long-run rental-demand tailwind backs the buy-and-hold thesis.
- By year 2, paydown + projected appreciation supports a ~$36k cash-out refi (75% LTV) — recoverable capital for the next deal without selling this one.
Negotiation context
- Only 9 days on market — expect competitive offers; lowballing is unlikely to land.
Questions for the listing agent
- What do current leases actually rent for vs. the listed asking? Can we see a recent rent roll and the last 12 months of T-12 income?
- Built in 1960 — when were the roof, HVAC, electrical panel, plumbing, and water heater last replaced?
- Is there a deadline driving the sale (1031 exchange, divorce, estate, relocation)? That informs how much negotiation room exists.
- Schools are B-rated — typically a magnet for longer-tenancy family renters. What's the average tenant stay here, and is there a school-zone premium baked into asking?
- The area grade is low — what's the realistic commute time and amenity access for the typical tenant pool here? Any planned neighborhood developments (good or bad) we should know about?
- What's the average days-on-market for RENTAL listings here right now (not sales)? A rising rental-DOM trend means longer vacancies and softer asking-rent achievability than the comps imply.
- What's the recent tenant-quality profile in this submarket — average credit score on applications, eviction rate, late-payment / NSF rate, and stable-employment percentage? A property-management company in the area should have these aggregated.
- How much new for-sale + rental construction is in the pipeline within 1–3 miles? Heavy new supply typically softens prices + rents 12–24 months out; constrained supply supports both.
Investment metrics
- 1% rule
- 0.67% ✗
- Cap rate
- 5.25%
- Cash-on-cash
- -3.74%
- DSCR
- 0.83
- GRM
- 12.5
CMA / ARV
No comps found within radius.
Projected returns pro-forma
10.0% appreciation · 3.0% rent growth · sell at horizon
- IRR
- 21.6%
- Equity multiple
- 2.75×
- Total profit
- $103,606
- Equity at exit
- $190,985
- IRR
- 19.5%
- Equity multiple
- 6.29×
- Total profit
- $314,199
- Equity at exit
- $411,867
Cash invested: $59,360 (down + closing). Projections, not guarantees.
Landlord ↔ Tenant lean methodology
- Overall (STATE)
- 82 Strongly Landlord-Friendly
- State North Dakota
- 82 Strongly Landlord-Friendly · R+20
- County
- — inherits STATE
- City
- — inherits STATE
ZIP-level market 58545
- Home prices YoY
- 8.1%
- Active inventory
- 38
- Price-to-rent
- 12.5×
Monthly cashflow live
- Estimated rent
- $1,410 medium interval (Pro) →
- Mortgage (P&I)
- −$1,112
- Tax from tax record
- −$99 /mo · $1,183/yr
- Insurance
- −$88
- HOA
- −$0
- Vacancy / Maint / Mgmt
- −$296
- Net cashflow
- $-185
Break-even live
Sensitivity live
| Price | -10% $-65 | -5% $-125 | +0% $-185 | +5% $-245 | +10% $-305 |
|---|---|---|---|---|---|
| Rent | -10% $-296 | -5% $-241 | +0% $-185 | +5% $-129 | +10% $-73 |
| Rate | -1.0pp $-78 | -0.5pp $-131 | base $-185 | +0.5pp $-240 | +1.0pp $-296 |
UW: 25.0% down · 7.5% · 30yr · 1.5% tax · 5.0% vac · 8.0% maint · 8.0% mgmt
Financing live
Cash to close
- Down payment
- $53,000
- Closing costs
- $6,360
- Reserves months
- —
- Total cash needed
- —
Loan-product check · same deal, 3 products live
Conventional
25% down · 7.5% · 30yr
- Down + closing
- —
- Monthly P&I
- —
- Monthly cashflow
- —
- DSCR
- —
- Eligible?
- —
Personal DTI + credit; lowest rate.
DSCR
20% down · 8.5% · 30yr
- Down + closing
- —
- Monthly P&I
- —
- Monthly cashflow
- —
- DSCR
- —
- Eligible?
- —
No personal income docs; deal must DSCR.
Hard money
10% down · 12.0% · 12mo
- Down + closing
- —
- Monthly P&I
- —
- Monthly cashflow
- —
- DSCR
- —
- Eligible?
- —
Short-term bridge; refi at stabilization.
Listing history 8 events
-
2026-06-22days on market $211,999 Active 9 DOM
-
2026-06-21days on market $211,999 Active 8 DOM
-
2026-06-21days on market $211,999 Active 7 DOM
-
2026-06-18days on market $211,999 Active 5 DOM
-
2026-06-17days on market $211,999 Active 4 DOM
-
2026-06-16days on market $211,999 Active 3 DOM
-
2026-06-15days on market $211,999 Active 2 DOM
-
2026-06-13$211,999 Active 1 DOM
ⓘ Source: listings_history table (triggers on properties + properties_extension) + one-shot
backfill from property_details.listing_events for pre-trigger history.
Tax reassessment forecast ND · Resets to sale price
- Current annual tax
- $1,183 · $99/mo
- Projected year-2 tax
- $2,078 · $173/mo
- Expected delta
- +$894/yr (+$75/mo · 75.6%)
ⓘ Screening estimate from a state-policy table — verify with the county assessor before closing.
Nearby sold comps map
Loading sold comps map…
Walkable amenities ~0.75 mi
Loading nearby amenities…
Taxation est. · year 1
- Rental income
- $16,919
- − Mortgage interest
- −$11,875
- − Property taxes
- −$1,183
- − Insurance
- −$1,060
- − Repairs & maintenance
- −$1,354
- − Management
- −$1,354
- − Depreciation
- −$6,167
- Taxable loss
- −$6,074
- Est. tax savings @ 24.0%
- +$1,458
- After-tax cash flow
- $-761/yr
For passive investors: Depreciation is non-cash, so a rental often shows a tax loss while cash-flowing — sheltering income. Rental losses are passive: they offset passive income freely, and up to $25,000/yr can offset ordinary (W-2) income if you actively participate and your MAGI is under $100k (phasing out to $0 by $150k); unused losses carry forward. On sale, claimed depreciation is recaptured at up to 25%, and gains may owe capital-gains tax (a 1031 exchange can defer both). Figures are a year-1 estimate at your 24.0% rate — not tax advice; consult a CPA.
Schools (NCES district)
- District
- Hazen 3
- NCES district ID
- 3800031
- Math proficiency
- 41% ▼ -9.00%
- Reading proficiency
- 45% ▼ -4.00%
- Median HH income
- $71,408
- Composite
- 39.02/100
- National rank
- #4066
- State rank
- #22 of 53 in ND
Livability — Hazen
- Score
- 75/100
- State rank
- #25
- US rank
- #4265
Category grades
Schools grade is shown separately in the Schools card above.
Census & demographics
- Census place
- Hazen, ND
- Population (ZIP)
- 3,278
Population outlook (Mercer County) Hauer SSP2
- Today (2025)
- 9,891 people
- By 2030
- 10,506 · +6.2%
- By 2040
- 11,872 · +20.0%
- By 2050
- 13,612 · +37.6%
- By 2075
- 19,871 · +100.9%
- By 2100
- 25,938 · +162.2%
Race, ethnicity, and origin ACS 2023
- Neighborhood character
- Predominantly White (90%)
- Race & ethnicity
- White 90% Two or more races 2% Hispanic / Latino 2% Black 1% Native American 1%
- Common ancestry
- Portuguese 15% Scotch-Irish 5% Iranian 3%
- Foreign-born
- 1% · Canada
- Languages at home
- 96% English-only · German/W. Germanic 2% Spanish 1% French/Haitian/Cajun 1%
Political lean MEDSL · Mercer
- 2024 margin
- Solid R (+69.0) · D 14.8% · R 83.8% · Other 1.3%
- 2008→2024 swing
- -39.2pp toward R · 2008: -29.9pp · 2024: -69.0pp
- All cycles
- 2024: R+69.0 2020: R+67.4 2016: R+67.9 2012: R+44.9 2008: R+29.9
Not yet ingested
- Civics
- —
Market trends
- HPI YoY
- ▲ 23.62%
- Current HPI
- 315.26
- Rent YoY
- —
- Metro
- —
- State GDP YoY
- ▲ 2.09%
- F500 in state
- 2
Industry mix (Fortune 500 HQ in ND)
| Industry | F500 HQs | Revenue |
|---|---|---|
| Utilities / Construction | 1 | $6B |
|
||
Price history
1 event — show timeline
- 2026-06-13 Listed $211,999 GNMLS
Cash-flow waterfall
monthlySold comps — $/sqft
last 12 mo · ≤1 miLoading sold comps…