173 E Michigan Ave Unit 203B · Three Rivers, MI
Flood risk 10/10 · Severe
- FEMA flood zone
- AE
- Chance of flooding over 30 yrs
- 0.99%
- Est. flood insurance / yr
- $1,737 – $8,500
Fire risk 1/10 · Minimal
- Est. fire insurance / yr
- $784 – $1,456
Heat risk 2/10 · Minimal
- Hot days now (above 100°F)
- 7 days/yr
- Hot days in 30 yrs
- 16 days/yr
Wind risk 2/10 · Minimal
- Chance of severe wind over 30 yrs
- —
Air-quality risk 2/10 · Minimal
- Unhealthy air days now
- 1 days/yr
- Unhealthy air days in 30 yrs
- 2 days/yr
Risk factors via First Street. Map © Google.
Why this score? — see what drove the C- grade
The composite is a weighted blend of 9 inputs, each scored 0–100. Each bar is that input's sub-score; the figure is the points it added to the 100-point composite (weight × sub-score).
- Cash flow +19.0/30.0
- 1% rule +9.8/10.0
- ARV discount +7.5/15.0
- DSCR +6.0/10.0
- Schools +3.5/10.0
- Livability +3.5/5.0
- Rent growth +2.5/5.0
- Condition / age +2.5/5.0
- Appreciation +0.0/10.0
$84,000
🖨 Deal sheet 📄 Offer letter ✓ Due diligence
Listing remarks MLS
Add plenty of free time to your schedule with ownership of this amazing 2 bed, 1.5 bath condo. This nearly carefree condo is located near shopping and entertainment and is located on the banks of the beautiful Saint Joseph River. The condo is updated with trendy flooring in the main rooms and new fixtures in the main bathroom. It offers up a light and airy decor. The association pool is amazing and offers a place to relax and entertain. There is also a large recreation room with bar and pool table. The laundry area is nearby along with secure storage space for each owner. The association monthly dues cover: pool, common area and elevator maint along with mowing of common areas and snow removal. Additionally included: water/sewer, cable, insurance, trash pick up, basement storage. * * Currently assoc. dues are $340.00/mo. * * Buy-in fee is currently $0.00 but a fee may be implemented soon. All info should be verified by buyer. Sale is as-is, where is.
Key facts
- Association pool
- Updated flooring
- New fixtures
Tags
Property features AI
Finance
- Other: Living area approximately 850; Road directions: Main St to East Michigan
- HOA & community: Association amenities include meeting room, pool, and storage; Association fee (monthly) of 340.00; Association fee includes water, trash, sewer, snow removal, lawn/yard care, and cable/satellite
Exterior
- Parking: Detached garage (1 car)
- Utilities: Public water
- Home design: Residential condominium; Other architectural style
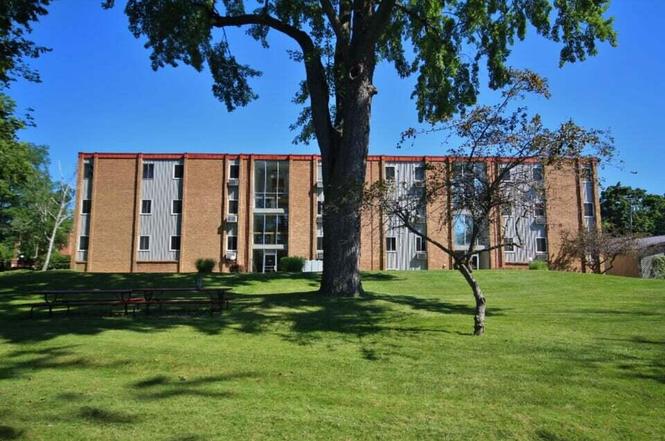
- Construction: Built in 1969; Brick and other construction materials
- Exterior features: Paved road access; Waterfront on the Saint Joseph River
Interior
- Kitchen: Dishwasher; Range; Refrigerator; Garbage disposal
- Bedrooms: Primary bedroom; Second bedroom
- Bathrooms: 1 full bathroom; 1 half bathroom; Primary bathroom; Second bathroom
- Heating & cooling: Baseboard heat; Has cooling
- Interior features: 6 total rooms; Full basement
Neighborhood map
What this means for you Summary
Snapshot
- This is a 2-bed/1.0-bath condo listed at $84k.
Deal economics
- At list price, monthly cash flow is $-339 ($-4k/yr) — negative.
- To cash-flow at today's rent, offer at most $24k (71.3% below list).
- Meets the 1% rule at list price ($1k rent vs $84k).
- Recommended offer: $24k (71.3% below list) — sets the bar for cash-flow.
- Cap rate 7.5% vs local median 5.2% in Three Rivers — top-decile yield for the area; either an underpriced asset or a hidden risk that comps aren't pricing in. Stress-test before assuming the spread holds.
Location & tenants
- Location reads 70/100 on livability (#306 in MI) — a middle-class / working-renter tenant base. Strengths: cost of living A+, housing A+, health & safety A+; Watch: schools D+, crime D, amenities F.
- Three Rivers Community Schools (town): math 37% / reading 45% proficiency, ranked #200 of 540 in MI (top 37%) — families likely to look elsewhere, expect single-tenant / working-renter base with shorter leases.
- Market conditions: 178 active listings in the ZIP; 1 comparable units currently listed for rent nearby; 125 units permitted in St. Joseph County in 2024 (0 in 5+ unit buildings).
Forward outlook
- Local home prices are declining (-3.0%/yr); year-one equity from $581 of loan paydown is wiped out by about $3k of value loss. Plan a longer hold.
- St. Joseph County population projected at -16% by 2050 — secular population decline; favor cash flow + early exit over multi-decade hold.
Negotiation context
- Only 2 days on market — expect competitive offers; lowballing is unlikely to land.
- 5 sale attempts since 12y ago with the ask held roughly flat each time — persistent listings suggest the price (not the market) is what's stuck; bring a comps-based counter.
- Current owner paid $28k; list at $84k implies a 202% gain — meaningful room to come down on a strong offer.
Risks & watch-outs
- Watch-outs: flood insurance adds $427/mo; HOA is 27% of rent.
- Climate carrying-cost: in FEMA flood zone AE (mandatory federal flood insurance) — expect insurance premiums to compound above CPI over the hold.
Questions for the listing agent
- What do current leases actually rent for vs. the listed asking? Can we see a recent rent roll and the last 12 months of T-12 income?
- Built in 1969 — when were the roof, HVAC, electrical panel, plumbing, and water heater last replaced?
- What's the actual annual flood-insurance premium (NFIP or private), and is the property in a SFHA with mandatory coverage?
- What does the HOA fee cover, when was the last increase, and are there any pending special assessments or reserve-fund shortfalls?
- Any open or pending special assessments — roof, HVAC, plumbing, elevator, façade? What's the per-unit balance and payoff schedule, and is the seller paying it off at close or rolling it to the buyer?
- Is there a deadline driving the sale (1031 exchange, divorce, estate, relocation)? That informs how much negotiation room exists.
- Schools are D-rated, which usually means shorter tenancies and higher turnover. Who's the typical renter profile here, and what's been the actual vacancy rate?
- Crime grade is D in this area — have there been break-ins, vandalism, or insurance claims at this property in the last 3 years? What carrier currently insures it and at what premium?
- What's the average days-on-market for RENTAL listings here right now (not sales)? A rising rental-DOM trend means longer vacancies and softer asking-rent achievability than the comps imply.
- What's the recent tenant-quality profile in this submarket — average credit score on applications, eviction rate, late-payment / NSF rate, and stable-employment percentage? A property-management company in the area should have these aggregated.
- How much new apartment / multifamily construction is in the pipeline within 1–3 miles? Heavy new supply (>2% of stock underway) typically softens rents 12–24 months out; light construction supports rent growth.
Investment metrics
- 1% rule
- 1.48% ✓
- Cap rate
- 7.54%
- Cash-on-cash
- 4.47%
- DSCR
- 1.20
- GRM
- 5.6
CMA / ARV
No comps found within radius.
Projected returns pro-forma
-3.0% appreciation · 3.0% rent growth · sell at horizon
- IRR
- -49.2%
- Equity multiple
- -0.48×
- Total profit
- $-34,728
- Equity at exit
- $12,525
- IRR
- -88.0%
- Equity multiple
- -1.39×
- Total profit
- $-56,114
- Equity at exit
- $7,263
Cash invested: $23,520 (down + closing). Projections, not guarantees.
Landlord ↔ Tenant lean methodology
- Overall (STATE)
- 62 Landlord-Friendly
- State Michigan
- 62 Landlord-Friendly · EVEN
- County
- — inherits STATE
- City
- — inherits STATE
ZIP-level market 49093
- Active inventory
- 178
- Price-to-rent
- 5.6×
Monthly cashflow live
- Estimated rent
- $1,245 medium interval (Pro) →
- Mortgage (P&I)
- −$441
- Tax from tax record
- −$81 /mo · $966/yr
- Insurance
- −$35
- Flood insurance flood zone
- −$427 /mo · $5,118/yr
- HOA
- −$340
- Vacancy / Maint / Mgmt
- −$261
- Net cashflow
- $-339
Break-even live
UW: 25.0% down · 7.5% · 30yr · 1.5% tax · 5.0% vac · 8.0% maint · 8.0% mgmt
Financing live
Cash to close
- Down payment
- $21,000
- Closing costs
- $2,520
- Reserves months
- —
- Total cash needed
- —
Loan-product check · same deal, 3 products live
Conventional
25% down · 7.5% · 30yr
- Down + closing
- —
- Monthly P&I
- —
- Monthly cashflow
- —
- DSCR
- —
- Eligible?
- —
Personal DTI + credit; lowest rate.
DSCR
20% down · 8.5% · 30yr
- Down + closing
- —
- Monthly P&I
- —
- Monthly cashflow
- —
- DSCR
- —
- Eligible?
- —
No personal income docs; deal must DSCR.
Hard money
10% down · 12.0% · 12mo
- Down + closing
- —
- Monthly P&I
- —
- Monthly cashflow
- —
- DSCR
- —
- Eligible?
- —
Short-term bridge; refi at stabilization.
Rent comps 1 comps
| Address | Beds | Baths | Sqft | Rent | $/sqft | DOM | Units | Dist |
|---|---|---|---|---|---|---|---|---|
| 320 Thomas St Three Rivers, MI | 1.0–2.0 | 1.0–1.5 | 925 | $1,245 | $1.35 | 13d | 4 | 0.51mi |
HOA detail condo
- Monthly dues
- $340 · $4,080/yr
- Likely covers
- watersewertrashcablesnow removalpool
- Assessments
- None detected in remarks — confirm with the listing agent.
Listing history 3 events
-
2026-06-18days on market $84,000 Active 2 DOM
-
2026-06-17remarks 699-char remark
-
2026-06-17$84,000 Active 1 DOM
ⓘ Source: listings_history table (triggers on properties + properties_extension) + one-shot
backfill from property_details.listing_events for pre-trigger history.
Tax reassessment forecast MI · Partial reset (capped growth)
- Current annual tax
- $966 · $81/mo
- Projected year-2 tax
- $1,130 · $94/mo
- Expected delta
- +$164/yr (+$14/mo · 17.0%)
ⓘ Screening estimate from a state-policy table — verify with the county assessor before closing.
Climate risk First Street
- Flood 10/10 Extreme FEMA zone AE · 99% chance over 30 yrs
- Wildfire 1/10 Low
- Heat 2/10 Low 7 d/yr ≥100°F today · 16 d/yr by 30 yrs out
- Wind 2/10 Low
- Air quality 2/10 Low 1 unhealthy d/yr today · 2 by 30 yrs out
Nearby sold comps map
Loading sold comps map…
Walkable amenities ~0.75 mi
Loading nearby amenities…
Taxation est. · year 1
- Rental income
- $14,940
- − Mortgage interest
- −$4,705
- − Property taxes
- −$966
- − Insurance
- −$5,538
- − Repairs & maintenance
- −$1,195
- − Management
- −$1,195
- − HOA
- −$4,080
- − Depreciation
- −$2,444
- Taxable loss
- −$5,184
- Est. tax savings @ 24.0%
- +$1,244
- After-tax cash flow
- $-2,824/yr
For passive investors: Depreciation is non-cash, so a rental often shows a tax loss while cash-flowing — sheltering income. Rental losses are passive: they offset passive income freely, and up to $25,000/yr can offset ordinary (W-2) income if you actively participate and your MAGI is under $100k (phasing out to $0 by $150k); unused losses carry forward. On sale, claimed depreciation is recaptured at up to 25%, and gains may owe capital-gains tax (a 1031 exchange can defer both). Figures are a year-1 estimate at your 24.0% rate — not tax advice; consult a CPA.
Schools (NCES district)
- District
- Three Rivers Community Schools
- NCES district ID
- 2633840
- Math proficiency
- 37% ▲ 1.00%
- Reading proficiency
- 45% ▼ -3.00%
- Median HH income
- $46,576
- Composite
- 34.97/100
- National rank
- #5058
- State rank
- #200 of 540 in MI
Livability — Three Rivers
- Score
- 70/100
- State rank
- #306
- US rank
- #7604
Category grades
Schools grade is shown separately in the Schools card above.
Census & demographics
- Census place
- Three Rivers, MI
- Population (ZIP)
- 18,439
Population outlook (St. Joseph County) Hauer SSP2
- Today (2025)
- 58,726 people
- By 2030
- 57,030 · -2.9%
- By 2040
- 53,266 · -9.3%
- By 2050
- 49,343 · -16.0%
- By 2075
- 40,441 · -31.1%
- By 2100
- 31,981 · -45.5%
Race, ethnicity, and origin ACS 2023
- Neighborhood character
- Predominantly White (84%)
- Race & ethnicity
- White 84% Two or more races 8% Hispanic / Latino 5% Black 5%
- Hispanic origin (detail)
- Mexican 4%
- Common ancestry
- Italian 11% Iranian 5% Romanian 3%
- Foreign-born
- 2% · Canada
- Languages at home
- 95% English-only · Spanish 3% Other Indo-European 1%
Political lean MEDSL · St. Joseph
- 2024 margin
- Solid R (+34.0) · D 32.2% · R 66.2% · Other 1.5%
- 2008→2024 swing
- -31.8pp toward R · 2008: -2.2pp · 2024: -34.0pp
- All cycles
- 2024: R+34.0 2020: R+31.7 2016: R+31.0 2012: R+12.3 2008: R+2.2
Not yet ingested
- Civics
- —
Market trends
- HPI YoY
- ▼ -159.07%
- Current HPI
- 226.5079
- Rent YoY
- —
- Metro
- —
- State GDP YoY
- ▲ 1.37%
- F500 in state
- 28
Industry mix (Fortune 500 HQ in MI)
| Industry | F500 HQs | Revenue |
|---|---|---|
| Automotive Parts | 3 | $48B |
|
||
| Automotive | 2 | $372B |
|
||
| Chemicals | 1 | $45B |
|
||
| Automotive Retail | 1 | $29B |
|
||
| Healthcare / Medical Devices | 1 | $23B |
|
||
| Automotive Technology | 1 | $20B |
|
||
Price history
+189.7% since first listed8 events — show timeline
- 2026-06-16 Listed $84,000 REALCOMP
- 2026-06-16 Listed $84,000 MiRealSource-MiMLS
- 2026-06-16 Listed $84,000 SW Michigan MLS
- 2015-07-30 Sold (Public Records) $27,850 Public Records
- 2015-06-30 Sold (MLS) $27,850 SW Michigan MLS
- 2015-06-30 Sold (MLS) $27,850 REALCOMP
- 2014-09-11 Listed $29,000 SW Michigan MLS
- 2014-09-11 Listed $29,000 REALCOMP
Property tax history
+7.9%/yrLatest (2025): $966 · -11.1% YoY. Source: county tax records.
Cash-flow waterfall
monthlySold comps — $/sqft
last 12 mo · ≤1 miLoading sold comps…