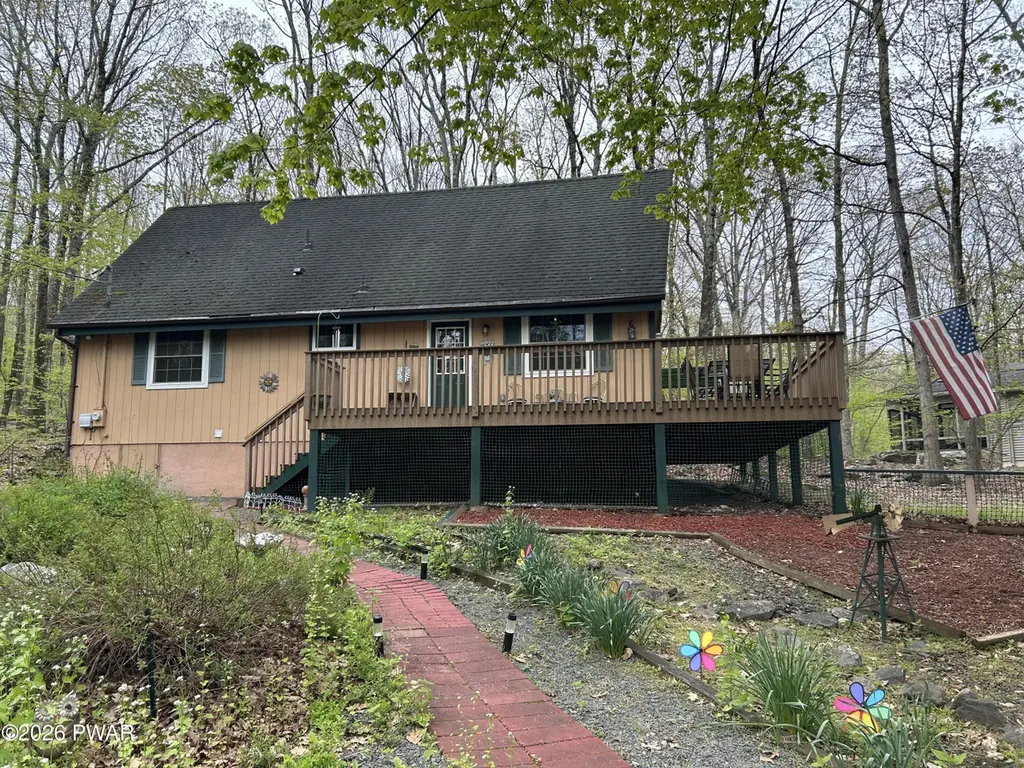
802 Cedar Ct · Hemlock Farms, PA
Flood risk 1/10 · Minimal
- FEMA flood zone
- X (unshaded)
- Chance of flooding over 30 yrs
- 0.0%
- Est. flood insurance / yr
- $473 – $860
Fire risk 5/10 · Moderate
- Est. fire insurance / yr
- $511 – $949
Heat risk 2/10 · Minimal
- Hot days now (above 91°F)
- 7 days/yr
- Hot days in 30 yrs
- 15 days/yr
Wind risk 3/10 · Minor
- Chance of severe wind over 30 yrs
- 6.0%
Air-quality risk 2/10 · Minimal
- Unhealthy air days now
- 1 days/yr
- Unhealthy air days in 30 yrs
- 2 days/yr
Risk factors via First Street. Map © Google.
Why this score? — see what drove the A grade
The composite is a weighted blend of 9 inputs, each scored 0–100. Each bar is that input's sub-score; the figure is the points it added to the 100-point composite (weight × sub-score).
- Cash flow +29.9/30.0
- ARV discount +14.2/15.0
- DSCR +10.0/10.0
- Appreciation +10.0/10.0
- 1% rule +9.0/10.0
- Schools +4.2/10.0
- Livability +3.4/5.0
- Rent growth +2.5/5.0
- Condition / age +2.5/5.0
$274,000
🖨 Deal sheet 📄 Offer letter ✓ Due diligence
Listing remarks MLS
Hemlock Farms Chalet: One-level living on over 3/4 of an acre, located on a private cul-de-sac! This could be your dream home! Featuring 3 bedrooms, 1 1/2 baths, this Chalet-style property offers a functional main level with an eat-in kitchen, a spacious living room with a brick gas fireplace and hand-made wooden mantel and trim, hardwood flooring, 2 large bedrooms, and a full bath and laundry area. The second level features a large bedroom and a 1/2 bath. Hemlock Farms is a full amenity community offering several pools including an indoor pool, fitness center, cafe, meeting room, tennis courts, a beach area on Elm Lake, several recreational areas, a Library, places of Worship and so much more. Looking for options, there are activities for all ages to enjoy. Close to the Interstate for an easy commute! Being Sold with contents. Make an offer today!
Key facts
- 0.8 acre lot
- 5 parking spots
- Community pool
Neighborhood map
What this means for you Summary
Snapshot
- This is a 3-bed/2.0-bath single-family listed at $274k.
Deal economics
- At list price, monthly cash flow is $1k ($12k/yr) — positive.
- The deal already cash-flows at list — no discount required.
- Meets the 1% rule at list price ($4k rent vs $274k).
- Recommended offer: $258k (6.0% below list) — sets the bar for market timing.
- Cap rate 10.7% vs local median 7.1% in Hemlock Farms — top-decile yield for the area; either an underpriced asset or a hidden risk that comps aren't pricing in. Stress-test before assuming the spread holds.
Location & tenants
- Location reads 68/100 on livability (#884 in PA) — a middle-class / working-renter tenant base. Strengths: crime A+, housing A+, health & safety A+; Watch: schools C-, amenities F, commute F.
- Wallenpaupack Area SD (rural): math 39% / reading 59% proficiency, ranked #192 of 539 in PA (top 36%) — families likely to look elsewhere, expect single-tenant / working-renter base with shorter leases.
- Market conditions: 371 active listings in the ZIP; 2 comparable units currently listed for rent nearby; 213 units permitted in Pike County in 2024 (0 in 5+ unit buildings).
Forward outlook
- In year one you build about $29k of equity ($2k loan paydown + $27k appreciation (10.0% local appreciation)).
- Pike County population projected at -25% by 2050 — secular population decline; favor cash flow + early exit over multi-decade hold.
- At projected returns (10.0% appreciation + 3.0% rent growth), your $77k cash investment doubles in ~2 years — after that, you're playing with house money.
- By year 2, paydown + projected appreciation supports a ~$47k cash-out refi (75% LTV) — recoverable capital for the next deal without selling this one.
Negotiation context
- It's been on market 77 days — a 6% lower offer ($258k) is reasonable based on typical stale-listing flexibility.
- Current owner paid $90k; list at $274k implies a 204% gain — meaningful room to come down on a strong offer.
Risks & watch-outs
- Climate carrying-cost: moderate wildfire risk — expect insurance premiums to compound above CPI over the hold.
Questions for the listing agent
- It's been on market 77 days. Have you received any prior offers? Is the seller open to a 6% concession, seller financing, or rate buy-down credit?
- Built in 1975 — when were the roof, HVAC, electrical panel, plumbing, and water heater last replaced?
- What does the HOA fee cover, when was the last increase, and are there any pending special assessments or reserve-fund shortfalls?
- Why hasn't it sold? Are there any deal-killer items the seller is aware of (foundation, flood, title, zoning, code violations)?
- Is there a deadline driving the sale (1031 exchange, divorce, estate, relocation)? That informs how much negotiation room exists.
- What's the average days-on-market for RENTAL listings here right now (not sales)? A rising rental-DOM trend means longer vacancies and softer asking-rent achievability than the comps imply.
- What's the recent tenant-quality profile in this submarket — average credit score on applications, eviction rate, late-payment / NSF rate, and stable-employment percentage? A property-management company in the area should have these aggregated.
- How much new for-sale + rental construction is in the pipeline within 1–3 miles? Heavy new supply typically softens prices + rents 12–24 months out; constrained supply supports both.
Investment metrics
- 1% rule
- 1.40% ✓
- Cap rate
- 10.73%
- Cash-on-cash
- 15.85%
- DSCR
- 1.71
- GRM
- 5.9
CMA / ARV
- ARV (median comp)
- $321,675
- List price
- $274,000
- Delta
- -14.82%
- Verdict
- UNDERPRICED
- Comps
- 20 within 1.0 mi
Show comp detail 12 sales within ~0.75 mi
| Address | Dist | Beds/Ba | Sqft | Sold | Price | $/sf | Match |
|---|---|---|---|---|---|---|---|
| 800 Bluestone Ct N Unit 800 Bluestone Court North | 0.46mi | 3/2.0 | 1,202 (-2%) | 1mo | $276,000 | $230 | 75 |
| 806 Rimrock Ct | 0.34mi | 3/2.0 | 1,142 (-7%) | 4mo | $300,000 | $263 | 70 |
| 111 Blueridge Ln | 0.28mi | 3/1.0 | 1,176 (-4%) | 9mo | $215,000 | $183 | 69 |
| 105 Tupelo Dr | 0.67mi | 3/2.0 | 1,215 (-1%) | 0mo | $360,000 | $296 | 67 |
| 404 Forest Dr | 0.13mi | 3/1.0 | 1,085 (-11%) | 6mo | $270,000 | $249 | 66 |
| 304 Forest Dr | 0.38mi | 3/1.5 | 1,344 (+10%) | 2mo | $280,000 | $208 | 63 |
| 103 Saddlebrook Ln | 0.53mi | 2/1.5 (-1) | 1,222 (-0%) | 8mo | $210,000 | $172 | 62 |
| 304 Forest Drive Dr | 0.38mi | 3/1.5 | 1,344 (+10%) | 11mo | $181,000 | $135 | 55 |
| 123 Basswood Ln E | 0.68mi | 3/2.0 | 1,320 (+8%) | 8mo | $512,500 | $388 | 49 |
| 107 Ridgeway Dr | 0.51mi | 3/2.0 | 1,083 (-12%) | 10mo | $257,500 | $238 | 48 |
| 807 Rimrock Ct | 0.34mi | 2/1.5 (-1) | 1,080 (-12%) | 17mo | $225,000 | $208 | 44 |
| 109 Curlew Dr | 0.56mi | 2/2.0 (-1) | 1,332 (+9%) | 15mo | $311,000 | $233 | 41 |
Match score weights: distance 35% · size 25% · config 20% · recency 20%. Top-matched comps best support the ARV.
Projected returns pro-forma
10.0% appreciation · 3.0% rent growth · sell at horizon
- IRR
- 36.0%
- Equity multiple
- 3.79×
- Total profit
- $213,893
- Equity at exit
- $246,841
- IRR
- 31.0%
- Equity multiple
- 8.55×
- Total profit
- $579,418
- Equity at exit
- $532,322
Cash invested: $76,720 (down + closing). Projections, not guarantees.
Landlord ↔ Tenant lean methodology
- Overall (STATE)
- 62 Landlord-Friendly
- State Pennsylvania
- 62 Landlord-Friendly · EVEN
- County
- — inherits STATE
- City
- — inherits STATE
ZIP-level market 18428
- Home prices YoY
- 9.2%
- Active inventory
- 371
- Price-to-rent
- 5.9×
Monthly cashflow live
- Estimated rent
- $3,849 medium interval (Pro) →
- Mortgage (P&I)
- −$1,437
- Tax from tax record
- −$224 /mo · $2,686/yr
- Insurance
- −$114
- HOA
- −$253
- Vacancy / Maint / Mgmt
- −$808
- Net cashflow
- $1,013
Break-even live
UW: 25.0% down · 7.5% · 30yr · 1.5% tax · 5.0% vac · 8.0% maint · 8.0% mgmt
Financing live
Cash to close
- Down payment
- $68,500
- Closing costs
- $8,220
- Reserves months
- —
- Total cash needed
- —
Loan-product check · same deal, 3 products live
Conventional
25% down · 7.5% · 30yr
- Down + closing
- —
- Monthly P&I
- —
- Monthly cashflow
- —
- DSCR
- —
- Eligible?
- —
Personal DTI + credit; lowest rate.
DSCR
20% down · 8.5% · 30yr
- Down + closing
- —
- Monthly P&I
- —
- Monthly cashflow
- —
- DSCR
- —
- Eligible?
- —
No personal income docs; deal must DSCR.
Hard money
10% down · 12.0% · 12mo
- Down + closing
- —
- Monthly P&I
- —
- Monthly cashflow
- —
- DSCR
- —
- Eligible?
- —
Short-term bridge; refi at stabilization.
Rent comps 2 comps
| Address | Beds | Baths | Sqft | Rent | $/sqft | DOM | Units | Dist |
|---|---|---|---|---|---|---|---|---|
| 313 Forest Dr Blooming Grove, PA | 3.0 | 2.0 | 1200 | $5,000 | $4.17 | 1d | 1 | 0.35mi |
| 811 Hickory Ct Hawley, PA | 3.0 | 2.0 | 1100 | $2,500 | $2.27 | 1d | 1 | 0.37mi |
HOA detail
- Monthly dues
- $253 · $3,036/yr
- Likely covers
- gaspoolgym
Listing history 16 events
-
2026-06-18days on market $274,000 Active 77 DOM
-
2026-06-17days on market $274,000 Active 76 DOM
-
2026-06-16days on market $274,000 Active 75 DOM
-
2026-06-15days on market $274,000 Active 74 DOM
-
2026-06-13days on market $274,000 Active 72 DOM
-
2026-06-13days on market $274,000 Active 71 DOM
-
2026-06-09days on market $274,000 Active 68 DOM
-
2026-06-08days on market $274,000 Active 67 DOM
-
2026-06-07days on market $274,000 Active 66 DOM
-
2026-06-04days on market $274,000 Active 63 DOM
-
2026-06-03days on market $274,000 Active 62 DOM
-
2026-06-02days on market $274,000 Active 61 DOM
-
2026-06-01days on market $274,000 Active 60 DOM
-
2026-05-31days on market $274,000 Active 59 DOM
-
2026-04-02$289,650 Active 860-char remark
Show marketing remark (860 chars)
Hemlock Farms Chalet: One-level living on over 3/4 of an acre, located on a private cul-de-sac! This could be your dream home! Featuring 3 bedrooms, 1 1/2 baths, this Chalet-style property offers a functional main level with an eat-in kitchen, a spacious living room with a brick gas fireplace and hand-made wooden mantel and trim, hardwood flooring, 2 large bedrooms, and a full bath and laundry area. The second level features a large bedroom and a 1/2 bath. Hemlock Farms is a full amenity community offering several pools including an indoor pool, fitness center, cafe, meeting room, tennis courts, a beach area on Elm Lake, several recreational areas, a Library, places of Worship and so much more. Looking for options, there are activities for all ages to enjoy. Close to the Interstate for an easy commute! Being Sold with contents. Make an offer today!
-
2000-05-16soldstatus $90,000
ⓘ Source: listings_history table (triggers on properties + properties_extension) + one-shot
backfill from property_details.listing_events for pre-trigger history.
Tax reassessment forecast PA · Partial reset (capped growth)
- Current annual tax
- $2,686 · $224/mo
- Projected year-2 tax
- $3,508 · $292/mo
- Expected delta
- +$822/yr (+$68/mo · 30.6%)
ⓘ Screening estimate from a state-policy table — verify with the county assessor before closing.
Climate risk First Street
- Flood 1/10 Low FEMA zone X (unshaded) · 0% chance over 30 yrs
- Wildfire 5/10 Major
- Heat 2/10 Low 7 d/yr ≥91°F today · 15 d/yr by 30 yrs out
- Wind 3/10 Moderate 6% chance of damaging wind over 30 yrs
- Air quality 2/10 Low 1 unhealthy d/yr today · 2 by 30 yrs out
Nearby sold comps map
Loading sold comps map…
Walkable amenities ~0.75 mi
Loading nearby amenities…
Taxation est. · year 1
- Rental income
- $46,192
- − Mortgage interest
- −$15,348
- − Property taxes
- −$2,686
- − Insurance
- −$1,370
- − Repairs & maintenance
- −$3,695
- − Management
- −$3,695
- − HOA
- −$3,036
- − Depreciation
- −$7,971
- Taxable income
- $8,390
- Est. tax owed @ 24.0%
- −$2,014
- After-tax cash flow
- $10,144/yr
For passive investors: Depreciation is non-cash, so a rental often shows a tax loss while cash-flowing — sheltering income. Rental losses are passive: they offset passive income freely, and up to $25,000/yr can offset ordinary (W-2) income if you actively participate and your MAGI is under $100k (phasing out to $0 by $150k); unused losses carry forward. On sale, claimed depreciation is recaptured at up to 25%, and gains may owe capital-gains tax (a 1031 exchange can defer both). Figures are a year-1 estimate at your 24.0% rate — not tax advice; consult a CPA.
Schools (NCES district)
- District
- Wallenpaupack Area SD
- NCES district ID
- 4224750
- Math proficiency
- 39% ▼ -10.00%
- Reading proficiency
- 59% ▼ -5.00%
- Median HH income
- $51,027
- Composite
- 41.97/100
- National rank
- #3345
- State rank
- #192 of 539 in PA
Livability — Hemlock Farms
- Score
- 68/100
- State rank
- #884
- US rank
- #9421
Category grades
Schools grade is shown separately in the Schools card above.
Census & demographics
- Census place
- Hemlock Farms, PA
- Population (ZIP)
- 12,446
Population outlook (Pike County) Hauer SSP2
- Today (2025)
- 53,548 people
- By 2030
- 51,622 · -3.6%
- By 2040
- 46,490 · -13.2%
- By 2050
- 40,372 · -24.6%
- By 2075
- 31,951 · -40.3%
- By 2100
- 26,821 · -49.9%
Race, ethnicity, and origin ACS 2023
- Neighborhood character
- Predominantly White (85%)
- Race & ethnicity
- White 85% Hispanic / Latino 8% Two or more races 6% Black 1% Asian 1%
- Hispanic origin (detail)
- Puerto Rican 5%
- Common ancestry
- Romanian 5% Portuguese 3% Italian 2%
- Foreign-born
- 5% · Canada
- Languages at home
- 91% English-only · Spanish 5% Russian/Polish/Slavic 1% Other Asian/Pacific 1%
Political lean MEDSL · Pike
- 2024 margin
- Strong R (+24.1) · D 37.6% · R 61.6%
- 2008→2024 swing
- -19.8pp toward R · 2008: -4.2pp · 2024: -24.1pp
- All cycles
- 2024: R+24.1 2020: R+19.0 2016: R+26.0 2012: R+11.0 2008: R+4.2
Not yet ingested
- Civics
- —
Market trends
- HPI YoY
- ▲ 28.60%
- Current HPI
- 340.8254
- Rent YoY
- —
- Metro
- —
- State GDP YoY
- ▲ 1.68%
- F500 in state
- 34
Industry mix (Fortune 500 HQ in PA)
| Industry | F500 HQs | Revenue |
|---|---|---|
| Healthcare | 2 | $309B |
|
||
| Insurance | 2 | $27B |
|
||
| Telecommunications / Media | 1 | $124B |
|
||
| Industrial Distribution | 1 | $22B |
|
||
| Financial Services | 1 | $20B |
|
||
| Chemicals / Materials | 1 | $18B |
|
||
Price history
+221.8% since first listed2 events — show timeline
- 2026-04-02 Listed $289,650 PWMLS
- 2000-05-16 Sold (Public Records) $90,000 Public Records
Property tax history
+2.8%/yrLatest (2026): $2,686 · +3.0% YoY. Source: county tax records.
Cash-flow waterfall
monthlySold comps — $/sqft
last 12 mo · ≤1 miLoading sold comps…