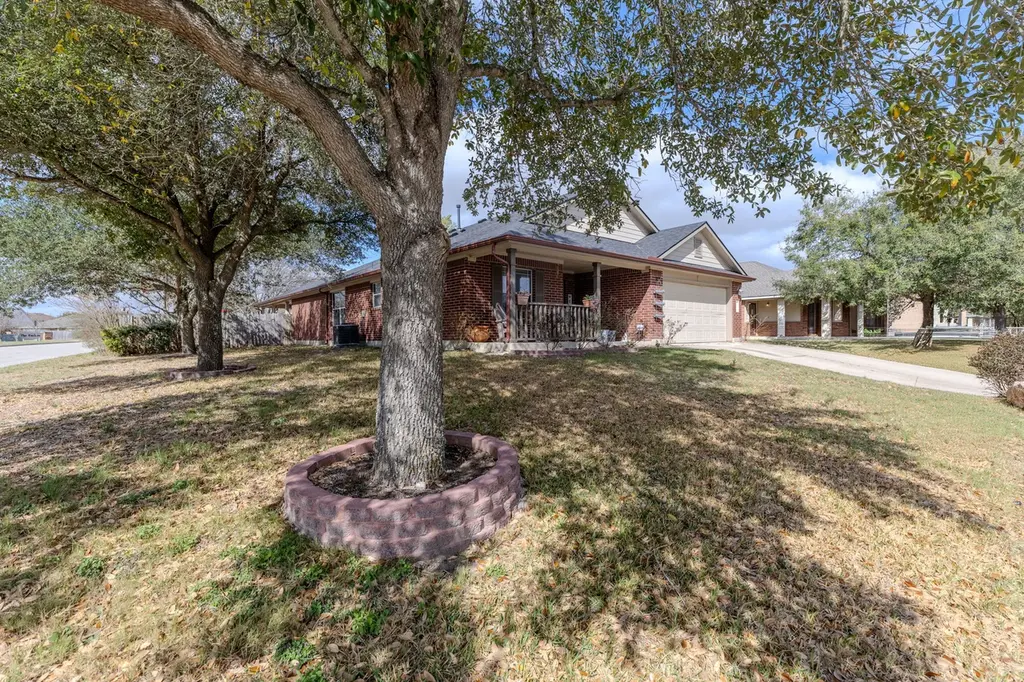
12800 Starbrimson Trl · Elgin, TX
Flood risk 1/10 · Minimal
- FEMA flood zone
- X (unshaded)
- Chance of flooding over 30 yrs
- 0.0%
- Est. flood insurance / yr
- $507 – $1,088
Fire risk 4/10 · Minor
- Est. fire insurance / yr
- $1,222 – $2,270
Heat risk 8/10 · Major
- Hot days now (above 109°F)
- 7 days/yr
- Hot days in 30 yrs
- 23 days/yr
Wind risk 8/10 · Major
- Chance of severe wind over 30 yrs
- 80.0%
Air-quality risk 1/10 · Minimal
- Unhealthy air days now
- 0 days/yr
- Unhealthy air days in 30 yrs
- 0 days/yr
Risk factors via First Street. Map © Google.
Why this score? — see what drove the D grade
The composite is a weighted blend of 9 inputs, each scored 0–100. Each bar is that input's sub-score; the figure is the points it added to the 100-point composite (weight × sub-score).
- ARV discount +11.4/15.0
- Appreciation +10.0/10.0
- Cash flow +5.6/30.0
- Livability +3.7/5.0
- Rent growth +3.3/5.0
- Condition / age +2.5/5.0
- 1% rule +2.4/10.0
- Schools +2.0/10.0
- DSCR +0.0/10.0
$285,000
🖨 Deal sheet (PDF) 📄 Offer letter ✓ Due diligence
Listing remarks MLS
Welcome to 12800 Starbrimson Trail in the rapidly growing and highly desirable Elgin area. This property offers a great opportunity to own in one of Central Texas’ booming communities while still enjoying space, comfort, and convenient access to Austin. Beautiful home located in the Elm Creek neighborhood. This property offers spacious living areas, modern finishes, and a large backyard perfect for outdoor activities. Conveniently situated near schools, parks, and shopping. Potential eligibility for USDA zero down financing program makes this an excellent opportunity for qualified buyers. Schedule your showing today and see the potential this Elgin home has to offer.
Key facts
- Foundation work
- Seller credits
- Usda eligible
Tags
Neighborhood map
What this means for you Summary
Snapshot
- This is a 3-bed/2.0-bath single-family listed at $285k.
Deal economics
- At list price, monthly cash flow is $-598 ($-7k/yr) — negative.
- To cash-flow at today's rent, offer at most $179k (37.1% below list).
- To meet the 1% rule (rent ≥ 1% of price), the offer needs to be $210k (26.2% below list).
- Recommended offer: $179k (37.1% below list) — sets the bar for cash-flow.
Location & tenants
- Location reads 74/100 on livability (#167 in TX, #4,404 nationally) — a middle-class / working-renter tenant base. Strengths: cost of living A+, housing A+, health & safety A+; Watch: amenities F, commute F.
- Elgin ISD (rural): math 17% / reading 26% proficiency, ranked #741 of 826 in TX (top 90%) — low school quality limits family demand, transient renter base, plan for 1-2y turnover; 67% free/reduced lunch — lower-income household profile, screen leases tightly.
- Zoned schools: Elgin El (math 8% / reading 17%, grade F, #4,180 of 4,322 statewide, top 97%, 847 students, 84% FRL); Elgin Middle (math 22% / reading 24%, grade F, #1,327 of 1,662 statewide, top 81%, 780 students, 82% FRL); Elgin H S (math 12% / reading 37%, grade F, #1,264 of 1,632 statewide, top 82%, 1,672 students, 74% FRL).
- Market conditions: Rents rising (+3.1%/yr); 814 active listings in the ZIP; 19 comparable units currently listed for rent nearby; rentals at typical pace (median 22d on market — plan ~3-4 weeks tenant-placement turnaround); solid renter incomes; 17,121 units permitted in Travis County in 2024 (11,963 in 5+ unit buildings).
Forward outlook
- In year one you build about $30k of equity ($2k loan paydown + $28k appreciation (10.0% local appreciation)).
- Travis County population projected at +60% by 2050 — long-run rental-demand tailwind backs the buy-and-hold thesis.
- By year 2, paydown + projected appreciation supports a ~$49k cash-out refi (75% LTV) — recoverable capital for the next deal without selling this one.
Negotiation context
- It's been on market 63 days — a 6% lower offer ($268k) is reasonable based on typical stale-listing flexibility.
Risks & watch-outs
- Watch-outs: property tax is 2.6% of price.
- Climate carrying-cost: severe wind risk, 80% chance of damaging wind over 30y; extreme-heat days projected 7→23/yr by 2055 (HVAC capex compounding) — expect insurance premiums to compound above CPI over the hold.
Questions for the listing agent
- What do current leases actually rent for vs. the listed asking? Can we see a recent rent roll and the last 12 months of T-12 income?
- It's been on market 63 days. Have you received any prior offers? Is the seller open to a 37% concession, seller financing, or rate buy-down credit?
- Property tax is high relative to price — has the assessment been appealed recently, and will the sale trigger a re-assessment?
- What does the HOA fee cover, when was the last increase, and are there any pending special assessments or reserve-fund shortfalls?
- Why hasn't it sold? Are there any deal-killer items the seller is aware of (foundation, flood, title, zoning, code violations)?
- Is there a deadline driving the sale (1031 exchange, divorce, estate, relocation)? That informs how much negotiation room exists.
- Schools are F-rated, which usually means shorter tenancies and higher turnover. Who's the typical renter profile here, and what's been the actual vacancy rate?
- The area grade is low — what's the realistic commute time and amenity access for the typical tenant pool here? Any planned neighborhood developments (good or bad) we should know about?
- What's the average days-on-market for RENTAL listings here right now (not sales)? A rising rental-DOM trend means longer vacancies and softer asking-rent achievability than the comps imply.
- What's the recent tenant-quality profile in this submarket — average credit score on applications, eviction rate, late-payment / NSF rate, and stable-employment percentage? A property-management company in the area should have these aggregated.
- How much new for-sale + rental construction is in the pipeline within 1–3 miles? Heavy new supply typically softens prices + rents 12–24 months out; constrained supply supports both.
Investment metrics
- 1% rule
- 0.74% ✗
- Cap rate
- 3.77%
- Cash-on-cash
- -9.00%
- DSCR
- 0.60
- GRM
- 11.3
CMA / ARV
- ARV (median comp)
- $312,023
- List price
- $285,000
- Delta
- -8.66%
- Verdict
- FAIR
- Comps
- 20 within 1.0 mi
Show comp detail 12 sales within ~0.75 mi
| Address | Dist | Beds/Ba | Sqft | Sold | Price | $/sf | Match |
|---|---|---|---|---|---|---|---|
| 12612 Wayne Spur Ln | 0.17mi | 4/2.0 (+1) | 1,838 (+2%) | 3mo | $209,500 | $114 | 81 |
| 17905 Basketflower Bnd | 0.05mi | 3/2.0 | 1,704 (-5%) | 12mo | $269,500 | $158 | 79 |
| 17913 Honey Locust Ln | 0.43mi | 3/2.5 | 1,668 (-7%) | 2mo | $245,000 | $147 | 64 |
| 12804 Sago Palm Trl | 0.20mi | 3/2.0 | 1,532 (-15%) | 10mo | $250,000 | $163 | 58 |
| 13020 Amaryllis Trl | 0.38mi | 3/2.5 | 1,659 (-8%) | 14mo | $249,999 | $151 | 56 |
| 23813 Glowing Embers Dr | 0.61mi | 4/2.5 (+1) | 1,891 (+5%) | 1mo | $258,999 | $137 | 55 |
| 23821 Glowing Embers Dr | 0.59mi | 4/2.0 (+1) | 1,667 (-7%) | 1mo | $245,999 | $148 | 54 |
| 23829 Glowing Embers Dr | 0.57mi | 4/2.0 (+1) | 1,667 (-7%) | 2mo | $249,990 | $150 | 54 |
| 17813 Boardtree Dr | 0.62mi | 4/2.0 (+1) | 1,684 (-6%) | 3mo | $232,990 | $138 | 53 |
| 13520 Knights Branch Dr | 0.54mi | 3/2.5 | 1,600 (-11%) | 2mo | $230,000 | $144 | 52 |
| 17920 Honey Locust Ln | 0.47mi | 3/2.0 | 1,562 (-13%) | 5mo | $234,900 | $150 | 52 |
| 13300 Banquete | 0.51mi | 4/2.0 (+1) | 1,667 (-7%) | 12mo | $269,950 | $162 | 49 |
Match score weights: distance 35% · size 25% · config 20% · recency 20%. Top-matched comps best support the ARV.
Projected returns pro-forma
10.0% appreciation · 3.12% rent growth · sell at horizon
- IRR
- 18.0%
- Equity multiple
- 2.47×
- Total profit
- $117,578
- Equity at exit
- $256,751
- IRR
- 16.9%
- Equity multiple
- 5.73×
- Total profit
- $377,148
- Equity at exit
- $553,692
Cash invested: $79,800 (down + closing). Projections, not guarantees.
Landlord ↔ Tenant lean methodology
- Overall (STATE)
- 87 Strongly Landlord-Friendly
- State Texas
- 87 Strongly Landlord-Friendly · R+5
- County
- — inherits STATE
- City
- — inherits STATE
ZIP-level market 78621
- Home prices YoY
- 7.6%
- Rents YoY
- 3.1%
- Active inventory
- 814
- Price-to-rent
- 11.3×
Monthly cashflow live
- Estimated rent
- $2,103 high interval (Pro) →
- Mortgage (P&I)
- −$1,495
- Tax from tax record
- −$609 /mo · $7,310/yr
- Insurance
- −$119
- HOA
- −$37
- Vacancy / Maint / Mgmt
- −$442
- Net cashflow
- $-598
Break-even live
Sensitivity live
| Price | -10% $-437 | -5% $-518 | +0% $-598 | +5% $-679 | +10% $-760 |
|---|---|---|---|---|---|
| Rent | -10% $-764 | -5% $-681 | +0% $-598 | +5% $-515 | +10% $-432 |
| Rate | -1.0pp $-455 | -0.5pp $-526 | base $-598 | +0.5pp $-672 | +1.0pp $-747 |
UW: 25.0% down · 7.5% · 30yr · 1.5% tax · 5.0% vac · 8.0% maint · 8.0% mgmt
Financing live
Cash to close
- Down payment
- $71,250
- Closing costs
- $8,550
- Reserves months
- —
- Total cash needed
- —
Loan-product check · same deal, 3 products live
Conventional
25% down · 7.5% · 30yr
- Down + closing
- —
- Monthly P&I
- —
- Monthly cashflow
- —
- DSCR
- —
- Eligible?
- —
Personal DTI + credit; lowest rate.
DSCR
20% down · 8.5% · 30yr
- Down + closing
- —
- Monthly P&I
- —
- Monthly cashflow
- —
- DSCR
- —
- Eligible?
- —
No personal income docs; deal must DSCR.
Hard money
10% down · 12.0% · 12mo
- Down + closing
- —
- Monthly P&I
- —
- Monthly cashflow
- —
- DSCR
- —
- Eligible?
- —
Short-term bridge; refi at stabilization.
Rent comps 19 comps
| Address | Beds | Baths | Sqft | Rent | $/sqft | DOM | Units | Dist |
|---|---|---|---|---|---|---|---|---|
| 17812 Prairie Verbena Ln Elgin, TX | 3.0 | 2.5 | 2049 | $2,199 | $1.07 | 45d | 1 | 0.28mi |
| 13124 Maidenhair Trl Elgin, TX | 4.0 | 2.0 | 1448 | $1,775 | $1.23 | 25d | 1 | 0.45mi |
| 13124 Maidenhair Trl Elgin, TX | 4.0 | 2.0 | 1448 | $1,775 | $1.23 | 18d | 1 | 0.45mi |
| 13121 Blackeyed Susan Trl Elgin, TX | 4.0 | 2.0 | 1586 | $1,800 | $1.13 | 19d | 1 | 0.56mi |
| 13305 Banquete St Elgin, TX | 4.0 | 2.0 | 1707 | $1,995 | $1.17 | 45d | 1 | 0.56mi |
| 13520 Knights Branch Dr Elgin, TX | 3.0 | 2.5 | 1600 | $1,850 | $1.16 | 3d | 1 | 0.57mi |
| 13725 Knights Branch Dr Elgin, TX | 4.0 | 2.5 | 1800 | $2,100 | $1.17 | 25d | 1 | 0.60mi |
| 13604 Menard Way Elgin, TX | 3.0 | 2.0 | 1474 | $1,875 | $1.27 | 25d | 1 | 0.64mi |
| 13804 Knights Branch Dr Elgin, TX | 3.0 | 2.5 | 1427 | $1,900 | $1.33 | 6d | 1 | 0.64mi |
| 13501 Mussel Run Elgin, TX | 4.0 | 2.0 | 1667 | $1,800 | $1.08 | 18d | 1 | 0.65mi |
| 14129 Tordillo Dr Unit NA Elgin, TX | 4.0 | 2.5 | 1874 | $2,495 | $1.33 | 0d | 1 | 0.77mi |
| 14129 Tordillo Dr Elgin, TX | 4.0 | 2.5 | 1874 | $2,675 | $1.43 | 25d | 1 | 0.77mi |
| 13249 Illumination Rd Unit R4 Elgin, TX | 4.0 | 3.0 | 2000 | $589 | $0.29 | 45d | 1 | 0.90mi |
| 13249 Illumination Rd Unit R2 Elgin, TX | 4.0 | 3.0 | 2000 | $600 | $0.30 | 19d | 1 | 0.91mi |
| 13249 Illumination Rd Unit R3 Elgin, TX | 4.0 | 3.0 | 2000 | $560 | $0.28 | 23d | 1 | 0.91mi |
| 23408 Tiny Moons Way Elgin, TX | 4.0 | 2.5 | 2000 | $1,960 | $0.98 | 22d | 1 | 0.94mi |
| 13501 Sierra Wind Ln Elgin, TX | 4.0 | 2.5 | 2066 | $2,500 | $1.21 | 21d | 1 | 1.06mi |
| 18408 Cloudmore Ln Elgin, TX | 4.0 | 3.0 | 2420 | $2,150 | $0.89 | 0d | 1 | 1.33mi |
| 18436 Weatherby Ln Elgin, TX | 4.0 | 2.5 | 2095 | $2,000 | $0.95 | 6d | 1 | 1.39mi |
HOA detail
- Monthly dues
- $37 · $444/yr
Listing history 3 events
-
2026-05-08status Pending 681-char remark
Show marketing remark (681 chars)
Welcome to 12800 Starbrimson Trail in the rapidly growing and highly desirable Elgin area. This property offers a great opportunity to own in one of Central Texas’ booming communities while still enjoying space, comfort, and convenient access to Austin. Beautiful home located in the Elm Creek neighborhood. This property offers spacious living areas, modern finishes, and a large backyard perfect for outdoor activities. Conveniently situated near schools, parks, and shopping. Potential eligibility for USDA zero down financing program makes this an excellent opportunity for qualified buyers. Schedule your showing today and see the potential this Elgin home has to offer.
-
2026-04-30price $285,000 681-char remark
Show marketing remark (681 chars)
Welcome to 12800 Starbrimson Trail in the rapidly growing and highly desirable Elgin area. This property offers a great opportunity to own in one of Central Texas’ booming communities while still enjoying space, comfort, and convenient access to Austin. Beautiful home located in the Elm Creek neighborhood. This property offers spacious living areas, modern finishes, and a large backyard perfect for outdoor activities. Conveniently situated near schools, parks, and shopping. Potential eligibility for USDA zero down financing program makes this an excellent opportunity for qualified buyers. Schedule your showing today and see the potential this Elgin home has to offer.
-
2026-03-06$292,000 Active 681-char remark
Show marketing remark (681 chars)
Welcome to 12800 Starbrimson Trail in the rapidly growing and highly desirable Elgin area. This property offers a great opportunity to own in one of Central Texas’ booming communities while still enjoying space, comfort, and convenient access to Austin. Beautiful home located in the Elm Creek neighborhood. This property offers spacious living areas, modern finishes, and a large backyard perfect for outdoor activities. Conveniently situated near schools, parks, and shopping. Potential eligibility for USDA zero down financing program makes this an excellent opportunity for qualified buyers. Schedule your showing today and see the potential this Elgin home has to offer.
ⓘ Source: listings_history table (triggers on properties + properties_extension) + one-shot
backfill from property_details.listing_events for pre-trigger history.
Tax reassessment forecast TX · Resets to sale price
- Current annual tax
- $7,310 · $609/mo
- Projected year-2 tax
- $7,310 · $609/mo
- Expected delta
- $0/yr ($0/mo · -0.0%)
ⓘ Screening estimate from a state-policy table — verify with the county assessor before closing.
Climate risk First Street
- Flood 1/10 Low FEMA zone X (unshaded) · 0% chance over 30 yrs
- Wildfire 4/10 Moderate
- Heat 8/10 Severe 7 d/yr ≥109°F today · 23 d/yr by 30 yrs out
- Wind 8/10 Severe 80% chance of damaging wind over 30 yrs
- Air quality 1/10 Low 0 unhealthy d/yr today · 0 by 30 yrs out
Nearby sold comps map
Loading sold comps map…
Walkable amenities ~0.75 mi
Loading nearby amenities…
Taxation est. · year 1
- Rental income
- $25,233
- − Mortgage interest
- −$15,964
- − Property taxes
- −$7,310
- − Insurance
- −$1,425
- − Repairs & maintenance
- −$2,019
- − Management
- −$2,019
- − HOA
- −$444
- − Depreciation
- −$8,291
- Taxable loss
- −$12,238
- Est. tax savings @ 24.0%
- +$2,937
- After-tax cash flow
- $-4,242/yr
For passive investors: Depreciation is non-cash, so a rental often shows a tax loss while cash-flowing — sheltering income. Rental losses are passive: they offset passive income freely, and up to $25,000/yr can offset ordinary (W-2) income if you actively participate and your MAGI is under $100k (phasing out to $0 by $150k); unused losses carry forward. On sale, claimed depreciation is recaptured at up to 25%, and gains may owe capital-gains tax (a 1031 exchange can defer both). Figures are a year-1 estimate at your 24.0% rate — not tax advice; consult a CPA.
Schools (NCES district)
- District
- Elgin ISD
- NCES district ID
- 4818360
- Math proficiency
- 17% ▼ -9.00%
- Reading proficiency
- 26% ▼ -5.00%
- Median HH income
- $55,176
- Composite
- 19.62/100
- National rank
- #8749
- State rank
- #741 of 826 in TX
Livability — Elgin
- Score
- 74/100
- State rank
- #167
- US rank
- #4404
Category grades
Schools grade is shown separately in the Schools card above.
Census & demographics
- County
- Bastrop County · 68,601 people
- City population
- 27,860
- Metro
- Austin-Round Rock-Georgetown, TX
- Population (ZIP)
- 30,411
- Household income
- $98,534
- Rent vs Own
- Severe rent burden
- 235.0
Population outlook (Travis County) Hauer SSP2
- Today (2025)
- 1,545,133 people
- By 2030
- 1,729,269 · +11.9%
- By 2040
- 2,097,596 · +35.8%
- By 2050
- 2,463,890 · +59.5%
- By 2075
- 3,249,374 · +110.3%
- By 2100
- 3,801,868 · +146.1%
Race, ethnicity, and origin ACS 2023
- Neighborhood character
- Diverse neighborhood (Simpson 0.64)
- Race & ethnicity
- Hispanic / Latino 46% White 38% Two or more races 19% Black 11% Native American 1%
- Hispanic origin (detail)
- Mexican 38%
- Common ancestry
- Slovak 2% Italian 2% Romanian 1%
- Foreign-born
- 17% · Canada, Vietnam
- Languages at home
- 63% English-only · Spanish 36%
Political lean MEDSL · Travis
- 2024 margin
- Solid D (+39.3) · D 68.8% · R 29.4% · Other 1.8%
- 2008→2024 swing
- +9.9pp toward D · 2008: 29.4pp · 2024: 39.3pp
- All cycles
- 2024: D+39.3 2020: D+45.0 2016: D+38.9 2012: D+23.9 2008: D+29.4
Not yet ingested
- Civics
- —
Market trends
- HPI YoY
- ▲ 29.47%
- Current HPI
- 416.87
- Rent YoY
- ▲ 3.12%
- Metro
- Austin-Round Rock-Georgetown, TX
- State GDP YoY
- ▲ 3.95%
- F500 in state
- 110
Industry mix (Fortune 500 HQ in TX)
| Industry | F500 HQs | Revenue |
|---|---|---|
| Energy | 16 | $1,198B |
|
||
| Technology | 5 | $198B |
|
||
| Engineering / Construction | 4 | $72B |
|
||
| Energy Services | 3 | $60B |
|
||
| Utilities | 3 | $41B |
|
||
| Healthcare | 2 | $330B |
|
||
Price history
-2.4% since first listed3 events — show timeline
- 2026-05-08 Pending — Unlock MLS
- 2026-04-30 Price Changed $285,000 Unlock MLS
- 2026-03-06 Listed $292,000 Unlock MLS
Property tax history
+3.8%/yrLatest (2026): $7,310 · -3.9% YoY. Source: county tax records.
Cash-flow waterfall
monthlySold comps — $/sqft
last 12 mo · ≤1 miLoading sold comps…