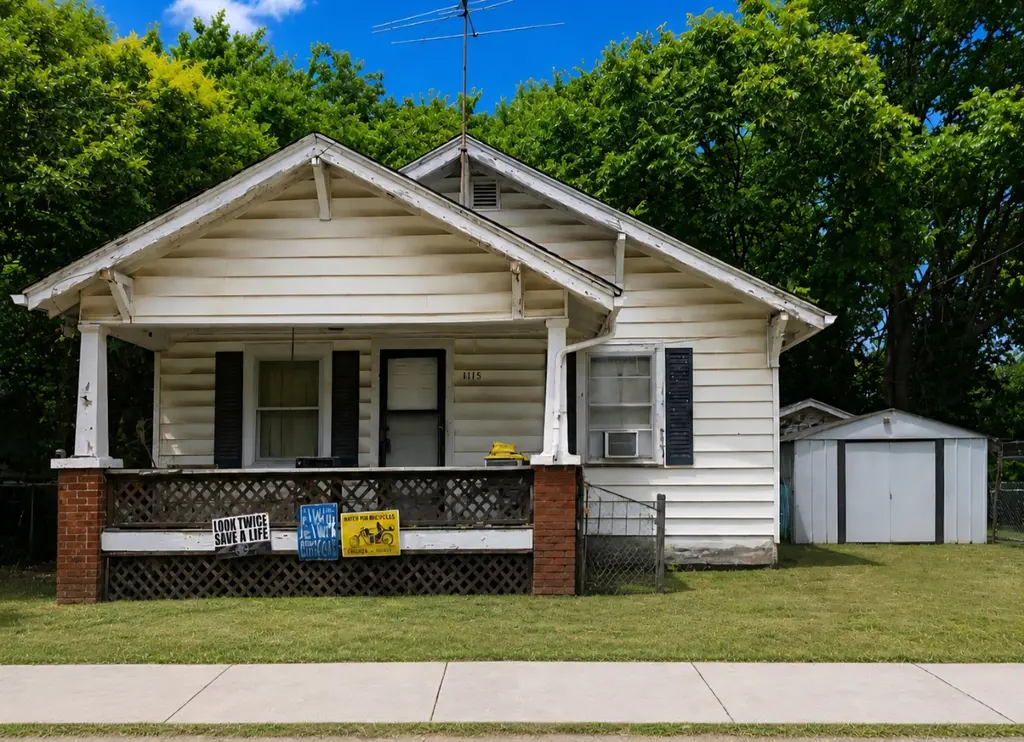
1115 N Missouri Ave · Springfield, MO
Flood risk 1/10 · Minimal
- FEMA flood zone
- X (unshaded)
- Chance of flooding over 30 yrs
- 0.0%
- Est. flood insurance / yr
- $473 – $860
Fire risk 1/10 · Minimal
- Est. fire insurance / yr
- $1,054 – $1,958
Heat risk 5/10 · Moderate
- Hot days now (above 104°F)
- 7 days/yr
- Hot days in 30 yrs
- 18 days/yr
Wind risk 2/10 · Minimal
- Chance of severe wind over 30 yrs
- —
Air-quality risk 2/10 · Minimal
- Unhealthy air days now
- 1 days/yr
- Unhealthy air days in 30 yrs
- 2 days/yr
Risk factors via First Street. Map © Google.
Why this score? — see what drove the B grade
The composite is a weighted blend of 9 inputs, each scored 0–100. Each bar is that input's sub-score; the figure is the points it added to the 100-point composite (weight × sub-score).
- Cash flow +30.0/30.0
- 1% rule +10.0/10.0
- DSCR +10.0/10.0
- ARV discount +7.5/15.0
- Livability +3.8/5.0
- Rent growth +3.7/5.0
- Schools +3.2/10.0
- Condition / age +2.5/5.0
- Appreciation +0.0/10.0
$42,000
🖨 Deal sheet (PDF) 📄 Offer letter ✓ Due diligence
Listing remarks
Investors dont miss out on this one. With a little work this one will make you money. Bring all offers.
Key facts
- 2,614 sq ft lot
- Built 1926
Property features AI
Exterior
- Utilities: Public water; Public sewer
- Home design: Single-family residence; One story
- Construction: Block foundation
- Exterior features: Front porch; Shed(s) on the property; Asphalt road access; Located on a city street
Interior
- Bathrooms: 1 full bathroom
- Heating & cooling: Central heating (electric); Central air conditioning
- Interior features: Full unfinished basement
Neighborhood map
What this means for you Summary
Snapshot
- This is a 2-bed/1.0-bath single-family listed at $42k.
Deal economics
- At list price, monthly cash flow is $508 ($6k/yr) — positive.
- The deal already cash-flows at list — no discount required.
- Meets the 1% rule at list price ($1k rent vs $42k).
- Cap rate 20.8% vs local median 4.6% in Springfield — top-decile yield for the area; either an underpriced asset or a hidden risk that comps aren't pricing in. Stress-test before assuming the spread holds.
Location & tenants
- Location reads 75/100 on livability (#57 in MO, #4,121 nationally) — a middle-class / working-renter tenant base. Strengths: commute A+, cost of living A+, housing A+; Watch: crime F, employment F.
- Springfield R-XII (urban): math 32% / reading 46% proficiency, ranked #174 of 324 in MO (top 54%) — families likely to look elsewhere, expect single-tenant / working-renter base with shorter leases.
- Zoned schools: Weaver Elem. (math 27% / reading 47%, grade F, #611 of 1,115 statewide, top 59%, 224 students, 91% FRL); Central High (math 42% / reading 62%, grade D+, #92 of 521 statewide, top 20%, 1,464 students, 51% FRL) — zoned schools average 71% FRL vs 46% district-wide (25 pts higher); higher-poverty schools than district average — tighter screening recommended.
- Market conditions: Rents rising fast (+4.8%/yr); 513 active listings in the ZIP; 40 comparable units currently listed for rent nearby; rentals at typical pace (median 25d on market — plan ~3-4 weeks tenant-placement turnaround); 1,302 units permitted in Greene County in 2024 (250 in 5+ unit buildings).
Forward outlook
- Local home prices are declining (-3.0%/yr); year-one equity from $290 of loan paydown is wiped out by about $1k of value loss. Plan a longer hold.
- Greene County population projected at +25% by 2050 — long-run rental-demand tailwind backs the buy-and-hold thesis.
- At projected returns (-3.0% appreciation + 4.8% rent growth), your $12k cash investment doubles in ~3 years — after that, you're playing with house money.
Negotiation context
- Only 1 days on market — expect competitive offers; lowballing is unlikely to land.
Risks & watch-outs
- Watch-outs: built in 1926 — expect roof / HVAC / electrical / plumbing capex.
- Climate carrying-cost: extreme-heat days projected 7→18/yr by 2055 (HVAC capex compounding) — expect insurance premiums to compound above CPI over the hold.
Questions for the listing agent
- Built in 1926 — when were the roof, HVAC, electrical panel, plumbing, and water heater last replaced?
- Is there a deadline driving the sale (1031 exchange, divorce, estate, relocation)? That informs how much negotiation room exists.
- Crime grade is F in this area — have there been break-ins, vandalism, or insurance claims at this property in the last 3 years? What carrier currently insures it and at what premium?
- What's the average days-on-market for RENTAL listings here right now (not sales)? A rising rental-DOM trend means longer vacancies and softer asking-rent achievability than the comps imply.
- What's the recent tenant-quality profile in this submarket — average credit score on applications, eviction rate, late-payment / NSF rate, and stable-employment percentage? A property-management company in the area should have these aggregated.
- How much new for-sale + rental construction is in the pipeline within 1–3 miles? Heavy new supply typically softens prices + rents 12–24 months out; constrained supply supports both.
Investment metrics
- 1% rule
- 2.38% ✓
- Cap rate
- 20.82%
- Cash-on-cash
- 51.87%
- DSCR
- 3.31
- GRM
- 3.5
CMA / ARV
- ARV (on-the-fly)
- $121,352
- Comps found
- 12
Show comp detail 12 sales within ~0.75 mi
| Address | Dist | Beds/Ba | Sqft | Sold | Price | $/sf | Match |
|---|---|---|---|---|---|---|---|
| 1025 W Scott St | 0.14mi | 2/1.0 | 784 (-0%) | 10mo | $25,500 | $33 | 84 |
| 1305 N Irving Ave | 0.15mi | 2/1.0 | 832 (+6%) | 2mo | $128,000 | $154 | 82 |
| 1126 W Calhoun St | 0.27mi | 2/1.0 | 798 (+1%) | 6mo | $149,900 | $188 | 81 |
| 1329 N Concord Ave | 0.28mi | 2/1.0 | 816 (+4%) | 7mo | $115,000 | $141 | 75 |
| 1318 N Douglas Ave | 0.20mi | 2/1.0 | 714 (-9%) | 1mo | $92,500 | $130 | 75 |
| 612 W Pacific St | 0.60mi | 2/1.0 | 780 (-1%) | 3mo | $125,000 | $160 | 67 |
| 803 N Concord Ave | 0.37mi | 2/1.0 | 720 (-9%) | 4mo | $85,000 | $118 | 65 |
| 1521 W Hamilton St | 0.58mi | 2/1.0 | 825 (+5%) | 1mo | $134,900 | $164 | 64 |
| 1511 W Hamilton St | 0.56mi | 2/1.0 | 825 (+5%) | 9mo | $119,900 | $145 | 59 |
| 619 N Nettleton Ave | 0.66mi | 2/1.0 | 800 (+2%) | 10mo | $133,400 | $167 | 59 |
| 1635 W Lynn St | 0.69mi | 2/1.0 | 732 (-7%) | 1mo | $115,000 | $157 | 55 |
| 521 W Locust St | 0.57mi | 2/1.0 | 905 (+15%) | 3mo | $105,000 | $116 | 46 |
Match score weights: distance 35% · size 25% · config 20% · recency 20%. Top-matched comps best support the ARV.
Projected returns pro-forma
-3.0% appreciation · 4.82% rent growth · sell at horizon
- IRR
- 51.8%
- Equity multiple
- 3.33×
- Total profit
- $27,444
- Equity at exit
- $6,262
- IRR
- 57.9%
- Equity multiple
- 7.26×
- Total profit
- $73,565
- Equity at exit
- $3,631
Cash invested: $11,760 (down + closing). Projections, not guarantees.
Landlord ↔ Tenant lean methodology
- Overall (STATE)
- 81 Strongly Landlord-Friendly
- State Missouri
- 81 Strongly Landlord-Friendly · R+10
- County
- — inherits STATE
- City
- — inherits STATE
ZIP-level market 65802
- Home prices YoY
- -31.9%
- Rents YoY
- 4.8%
- Active inventory
- 513
- Price-to-rent
- 3.5×
Monthly cashflow live
- Estimated rent
- $1,000 high interval (Pro) →
- Mortgage (P&I)
- −$220
- Tax from tax record
- −$44 /mo · $526/yr
- Insurance
- −$18
- HOA
- −$0
- Vacancy / Maint / Mgmt
- −$210
- Net cashflow
- $508
Break-even live
Sensitivity live
| Price | -10% $532 | -5% $520 | +0% $508 | +5% $496 | +10% $485 |
|---|---|---|---|---|---|
| Rent | -10% $429 | -5% $469 | +0% $508 | +5% $548 | +10% $587 |
| Rate | -1.0pp $529 | -0.5pp $519 | base $508 | +0.5pp $497 | +1.0pp $486 |
UW: 25.0% down · 7.5% · 30yr · 1.5% tax · 5.0% vac · 8.0% maint · 8.0% mgmt
Financing live
Cash to close
- Down payment
- $10,500
- Closing costs
- $1,260
- Reserves months
- —
- Total cash needed
- —
Loan-product check · same deal, 3 products live
Conventional
25% down · 7.5% · 30yr
- Down + closing
- —
- Monthly P&I
- —
- Monthly cashflow
- —
- DSCR
- —
- Eligible?
- —
Personal DTI + credit; lowest rate.
DSCR
20% down · 8.5% · 30yr
- Down + closing
- —
- Monthly P&I
- —
- Monthly cashflow
- —
- DSCR
- —
- Eligible?
- —
No personal income docs; deal must DSCR.
Hard money
10% down · 12.0% · 12mo
- Down + closing
- —
- Monthly P&I
- —
- Monthly cashflow
- —
- DSCR
- —
- Eligible?
- —
Short-term bridge; refi at stabilization.
Rent comps 40 comps
| Address | Beds | Baths | Sqft | Rent | $/sqft | DOM | Units | Dist |
|---|---|---|---|---|---|---|---|---|
| 647 W Central St Springfield, MO | 3.0 | 1.0 | 882 | $1,050 | $1.19 | 24d | 1 | 0.29mi |
| 1126 W Hamilton St Springfield, MO | 2.0 | 1.0 | 648 | $895 | $1.38 | 24d | 1 | 0.30mi |
| 815 N Grant Ave Unit A Springfield, MO | 2.0 | 1.0 | 801 | $625 | $0.78 | 44d | 1 | 0.30mi |
| 813 W Poplar St Unit 813 Springfield, MO | 2.0 | 1.0 | 560 | $795 | $1.42 | 14d | 1 | 0.36mi |
| 603 W Division St Springfield, MO | 2.0 | 1.0 | 816 | $995 | $1.22 | 14d | 1 | 0.44mi |
| 1406 W Calhoun St Unit B Springfield, MO | 2.0 | 1.0 | 885 | $865 | $0.98 | 24d | 1 | 0.46mi |
| 916 N Kansas Expy Springfield, MO | 1.0 | 1.0 | 573 | $595 | $1.04 | 44d | 1 | 0.61mi |
| 1530 N Robberson Ave Springfield, MO | 3.0 | 2.0 | 1122 | $1,425 | $1.27 | 44d | 1 | 0.72mi |
| 203 W Commercial St Unit 2F Springfield, MO | 2.0 | 1.0 | 1000 | $1,150 | $1.15 | 22d | 1 | 0.77mi |
| 1623 N Jefferson Ave Unit B Springfield, MO | 1.0 | 1.0 | 750 | $950 | $1.27 | 44d | 1 | 0.81mi |
| 235 N Market Ave Springfield, MO | 1.0–4.0 | 1.0–2.0 | 1350 | $1,267 | $0.94 | 14d | 4 | 0.84mi |
| 235 N Market Ave Springfield, MO | 1.0–4.0 | 1.0–2.0 | 1350 | $1,267 | $0.94 | 24d | 5 | 0.84mi |
| 733 W College St Springfield, MO | 1.0 | 1.0 | 700 | $750 | $1.07 | 14d | 1 | 0.85mi |
| 1409 N Washington Ave Springfield, MO | 2.0 | 1.0 | 839 | $1,405 | $1.67 | 14d | 2 | 0.86mi |
| 138 Park Central Sq Springfield, MO | 1.0–2.0 | 1.0–2.0 | 1083 | $2,489 | $2.30 | 14d | 8 | 0.91mi |
| 211 S Market Ave Springfield, MO | 2.0–4.0 | 1.0–2.0 | 1442 | $1,425 | $0.99 | 22d | 5 | 0.92mi |
| 211 S Market Ave Springfield, MO | 2.0–4.0 | 1.0–2.0 | 1442 | $1,425 | $0.99 | 24d | 5 | 0.92mi |
| 535 W Walnut St Springfield, MO | 2.0 | 2.0 | 1096 | $1,495 | $1.36 | 44d | 1 | 0.95mi |
| 317 E Chase St Springfield, MO | 2.0 | 2.0 | 915 | $1,100 | $1.20 | 44d | 1 | 0.95mi |
| 305 S Campbell Ave Unit 208 Springfield, MO | 1.0 | 1.0 | 649 | $975 | $1.50 | 14d | 1 | 0.96mi |
| 209 W McDaniel St Unit 209-207 Springfield, MO | 1.0 | 1.0 | 700 | $950 | $1.36 | 44d | 1 | 0.99mi |
| 865 S Douglas Ave Springfield, MO | 2.0 | 2.0 | 850 | $895 | $1.05 | 14d | 4 | 1.01mi |
| 1200 W Walnut St Springfield, MO | 2.0 | 2.0 | 1000 | $995 | $0.99 | 14d | 3 | 1.04mi |
| 2120 N Johnston Ave Springfield, MO | 2.0 | 1.0 | 880 | $925 | $1.05 | 44d | 1 | 1.06mi |
| 430 W Pershing St Springfield, MO | 2.0 | 2.0 | 765 | $1,195 | $1.56 | 14d | 1 | 1.06mi |
| 716 E Locust St Unit A Springfield, MO | 2.0 | 1.0 | 915 | $850 | $0.93 | 24d | 1 | 1.07mi |
| 513 S Broadway Ave Springfield, MO | 2.0 | 1.0 | 800 | $855 | $1.07 | 44d | 1 | 1.09mi |
| 309 S Jefferson Ave Unit 211 Springfield, MO | 2.0 | 2.0 | 762 | $767 | $1.01 | 44d | 1 | 1.09mi |
| 1740 W Olive St Springfield, MO | 3.0 | 1.0 | 736 | $1,195 | $1.62 | 14d | 1 | 1.12mi |
| 407 E Dale St Apt B Springfield, MO | 2.0 | 1.0 | 720 | $795 | $1.10 | 14d | 1 | 1.20mi |
| 522 N Park Ave Springfield, MO | 1.0 | 1.0 | 608 | $950 | $1.56 | 44d | 1 | 1.21mi |
| 930 W Harrison St Springfield, MO | 3.0 | 2.0 | 1046 | $1,150 | $1.10 | 14d | 1 | 1.23mi |
| 2230 N Campbell Ave Springfield, MO | 2.0 | 1.0 | 1084 | $1,095 | $1.01 | 44d | 1 | 1.25mi |
| 1306 N Frisco Ave Apt A Springfield, MO | 2.0 | 1.5–2.0 | 970 | $995 | $1.03 | 14d | 19 | 1.26mi |
| 2034 N Washington Ave Springfield, MO | 2.0 | 1.0 | 800 | $875 | $1.09 | 44d | 1 | 1.27mi |
| 627 S Fort Ave Springfield, MO | 2.0 | 1.0 | 880 | $895 | $1.02 | 24d | 1 | 1.27mi |
| 2126 N Lexington Ave Springfield, MO | 2.0 | 1.0 | 990 | $895 | $0.90 | 14d | 1 | 1.29mi |
| 2117 N Lexington Ave Springfield, MO | 3.0 | 1.0 | 1040 | $1,195 | $1.15 | 44d | 1 | 1.29mi |
| 301 W State St Unit D Springfield, MO | 1.0 | 1.0 | 570 | $875 | $1.54 | 24d | 1 | 1.34mi |
| 1911 W Elm St Springfield, MO | 2.0 | 1.0 | 580 | $875 | $1.51 | 44d | 1 | 1.34mi |
Listing history 2 events
-
2026-06-14remarks 103-char remark
-
2026-06-14$42,000 Pending 1 DOM
ⓘ Source: listings_history table (triggers on properties + properties_extension) + one-shot
backfill from property_details.listing_events for pre-trigger history.
Tax reassessment forecast MO · Resets to sale price
- Current annual tax
- $526 · $44/mo
- Projected year-2 tax
- $526 · $44/mo
- Expected delta
- $0/yr ($0/mo · 0.0%)
ⓘ Screening estimate from a state-policy table — verify with the county assessor before closing.
Climate risk First Street
- Flood 1/10 Low FEMA zone X (unshaded) · 0% chance over 30 yrs
- Wildfire 1/10 Low
- Heat 5/10 Major 7 d/yr ≥104°F today · 18 d/yr by 30 yrs out
- Wind 2/10 Low
- Air quality 2/10 Low 1 unhealthy d/yr today · 2 by 30 yrs out
Nearby sold comps map
Loading sold comps map…
Walkable amenities ~0.75 mi
Loading nearby amenities…
Taxation est. · year 1
- Rental income
- $11,998
- − Mortgage interest
- −$2,353
- − Property taxes
- −$526
- − Insurance
- −$210
- − Repairs & maintenance
- −$960
- − Management
- −$960
- − Depreciation
- −$1,222
- Taxable income
- $5,768
- Est. tax owed @ 24.0%
- −$1,384
- After-tax cash flow
- $4,716/yr
For passive investors: Depreciation is non-cash, so a rental often shows a tax loss while cash-flowing — sheltering income. Rental losses are passive: they offset passive income freely, and up to $25,000/yr can offset ordinary (W-2) income if you actively participate and your MAGI is under $100k (phasing out to $0 by $150k); unused losses carry forward. On sale, claimed depreciation is recaptured at up to 25%, and gains may owe capital-gains tax (a 1031 exchange can defer both). Figures are a year-1 estimate at your 24.0% rate — not tax advice; consult a CPA.
Schools (NCES district)
- District
- Springfield R-XII
- NCES district ID
- 2928860
- Math proficiency
- 32% ▼ -2.00%
- Reading proficiency
- 46% ▼ -3.00%
- Median HH income
- $37,886
- Composite
- 32.45/100
- National rank
- #5717
- State rank
- #174 of 324 in MO
Livability — Springfield
- Score
- 75/100
- State rank
- #57
- US rank
- #4121
Category grades
Schools grade is shown separately in the Schools card above.
Census & demographics
- Census place
- Springfield, MO
- County
- Greene County · 244,327 people
- City population
- 223,044
- Metro
- Springfield, MO
- Population (ZIP)
- 46,739
- Household income
- $55,019
- Rent vs Own
- Severe rent burden
- 1818.0
Population outlook (Greene County) Hauer SSP2
- Today (2025)
- 319,054 people
- By 2030
- 335,135 · +5.0%
- By 2040
- 366,186 · +14.8%
- By 2050
- 397,431 · +24.6%
- By 2075
- 477,035 · +49.5%
- By 2100
- 520,828 · +63.2%
Race, ethnicity, and origin ACS 2023
- Neighborhood character
- Predominantly White (81%)
- Race & ethnicity
- White 81% Two or more races 8% Hispanic / Latino 5% Black 4% Asian 2%
- Common ancestry
- Slovak 2% Lithuanian 2% Italian 2%
- Foreign-born
- 3% · Canada, Vietnam
- Languages at home
- 95% English-only · Spanish 2% Vietnamese 1% Other Indo-European 1%
Political lean MEDSL · Greene
- 2024 margin
- Strong R (+20.8) · D 38.9% · R 59.7% · Other 1.4%
- 2008→2024 swing
- -5.0pp toward R · 2008: -15.8pp · 2024: -20.8pp
- All cycles
- 2024: R+20.8 2020: R+20.1 2016: R+27.4 2012: R+24.4 2008: R+15.8
Not yet ingested
- Civics
- —
Market trends
- HPI YoY
- ▼ -99.72%
- Current HPI
- 212.9826
- Rent YoY
- ▲ 4.82%
- Metro
- Springfield, MO
- State GDP YoY
- ▲ 1.84%
- F500 in state
- 20
Industry mix (Fortune 500 HQ in MO)
| Industry | F500 HQs | Revenue |
|---|---|---|
| Healthcare | 1 | $163B |
|
||
| Insurance | 1 | $21B |
|
||
| Industrial Technology | 1 | $17B |
|
||
| Retail | 1 | $16B |
|
||
| Industrial Distribution | 1 | $10B |
|
||
| Utilities | 1 | $9B |
|
||
Price history
3 events — show timeline
- 2026-06-13 Pending — SOMO
- 2026-06-12 Listed $42,000 SOMO
- 2004-07-01 Sold (Public Records) — Public Records
Property tax history
+3.4%/yrLatest (2025): $526 · +21.9% YoY. Source: county tax records.
Cash-flow waterfall
monthlySold comps — $/sqft
last 12 mo · ≤1 miLoading sold comps…