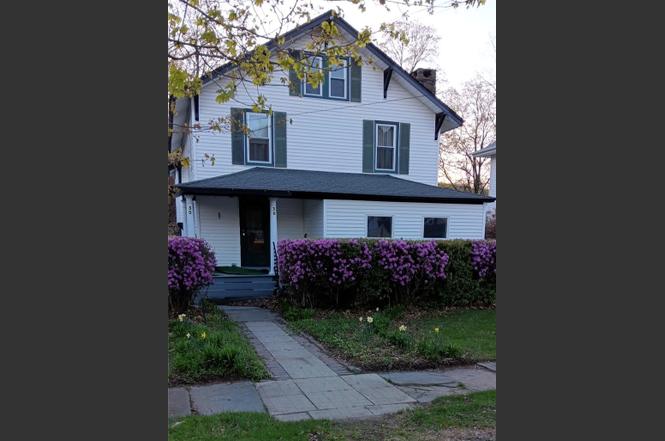
30 Highland Ave · Roscoe, NY
Flood risk 1/10 · Minimal
- FEMA flood zone
- X (unshaded)
- Chance of flooding over 30 yrs
- 0.0%
- Est. flood insurance / yr
- $473 – $860
Fire risk 1/10 · Minimal
- Est. fire insurance / yr
- $691 – $1,283
Heat risk 3/10 · Minor
- Hot days now (above 88°F)
- 8 days/yr
- Hot days in 30 yrs
- 19 days/yr
Wind risk 2/10 · Minimal
- Chance of severe wind over 30 yrs
- 2.0%
Air-quality risk 2/10 · Minimal
- Unhealthy air days now
- 0 days/yr
- Unhealthy air days in 30 yrs
- 1 days/yr
Risk factors via First Street. Map © Google.
Why this score? — see what drove the C- grade
The composite is a weighted blend of 9 inputs, each scored 0–100. Each bar is that input's sub-score; the figure is the points it added to the 100-point composite (weight × sub-score).
- ARV discount +15.0/15.0
- Cash flow +12.8/30.0
- Appreciation +8.1/10.0
- 1% rule +3.8/10.0
- DSCR +3.8/10.0
- Schools +3.3/10.0
- Livability +2.8/5.0
- Rent growth +2.5/5.0
- Condition / age +2.5/5.0
$220,000
🖨 Deal sheet 📄 Offer letter ✓ Due diligence
Listing remarks
Gorgeous home looking for some finishing touches Home is immaculate and boast beautiful hardwood floors solid doors and lovely built in cabinets and storage units. Large deck really completes the package Walk to public transportation to NYC. Easy access to the rivers in the area and walking distance to all the towns amenities. Breweries, restaurants all at your disposal. Owner is anxious to move and will consider every offer Call today
Key facts
- Large deck
- Built in cabinets
- Hardwood floors
Tags
Neighborhood map
What this means for you Summary
Snapshot
- This is a 3-bed/1.5-bath single-family listed at $220k.
Deal economics
- At list price, monthly cash flow is $-19 ($-226/yr) — negative.
- To cash-flow at today's rent, offer at most $217k (1.5% below list).
- To meet the 1% rule (rent ≥ 1% of price), the offer needs to be $194k (11.6% below list).
- Recommended offer: $194k (12.0% below list) — sets the bar for market timing.
- Cap rate 6.2% vs local median 1.3% in Roscoe — top-decile yield for the area; either an underpriced asset or a hidden risk that comps aren't pricing in. Stress-test before assuming the spread holds.
Location & tenants
- Location reads 56/100 on livability (#1,100 in NY) — a working-class tenant base; expect higher turnover. Strengths: cost of living A, housing B; Watch: crime F, amenities F, commute F.
- Roscoe Central School District (rural): math 35% / reading 35% proficiency, ranked #689 of 755 in NY (top 91%) — families likely to look elsewhere, expect single-tenant / working-renter base with shorter leases.
- Market conditions: 39 active listings in the ZIP; 739 units permitted in Sullivan County in 2024 (5 in 5+ unit buildings).
Forward outlook
- In year one you build about $15k of equity ($2k loan paydown + $14k appreciation (6.1% local appreciation)).
- Sullivan County population projected at -24% by 2050 — secular population decline; favor cash flow + early exit over multi-decade hold.
- At projected returns (6.1% appreciation + 3.0% rent growth), your $62k cash investment doubles in ~4 years — after that, you're playing with house money.
- By year 3, paydown + projected appreciation supports a ~$37k cash-out refi (75% LTV) — recoverable capital for the next deal without selling this one.
Negotiation context
- It's been on market 248 days — a 12% lower offer ($194k) is reasonable based on typical stale-listing flexibility.
Risks & watch-outs
- Watch-outs: built in 1908 — expect roof / HVAC / electrical / plumbing capex.
Questions for the listing agent
- What do current leases actually rent for vs. the listed asking? Can we see a recent rent roll and the last 12 months of T-12 income?
- It's been on market 248 days. Have you received any prior offers? Is the seller open to a 12% concession, seller financing, or rate buy-down credit?
- Built in 1908 — when were the roof, HVAC, electrical panel, plumbing, and water heater last replaced?
- Why hasn't it sold? Are there any deal-killer items the seller is aware of (foundation, flood, title, zoning, code violations)?
- Is there a deadline driving the sale (1031 exchange, divorce, estate, relocation)? That informs how much negotiation room exists.
- Crime grade is F in this area — have there been break-ins, vandalism, or insurance claims at this property in the last 3 years? What carrier currently insures it and at what premium?
- What's the average days-on-market for RENTAL listings here right now (not sales)? A rising rental-DOM trend means longer vacancies and softer asking-rent achievability than the comps imply.
- What's the recent tenant-quality profile in this submarket — average credit score on applications, eviction rate, late-payment / NSF rate, and stable-employment percentage? A property-management company in the area should have these aggregated.
- How much new for-sale + rental construction is in the pipeline within 1–3 miles? Heavy new supply typically softens prices + rents 12–24 months out; constrained supply supports both.
Investment metrics
- 1% rule
- 0.88% ✗
- Cap rate
- 6.19%
- Cash-on-cash
- -0.37%
- DSCR
- 0.98
- GRM
- 9.4
CMA / ARV
- ARV (on-the-fly)
- $263,862
- Comps found
- 6
Show comp detail 6 sales within ~0.75 mi
| Address | Dist | Beds/Ba | Sqft | Sold | Price | $/sf | Match |
|---|---|---|---|---|---|---|---|
| 16 Church Ave | 0.11mi | 3/2.0 | 2,102 (+9%) | 18mo | $415,000 | $197 | 63 |
| 23 Riverside Dr | 0.32mi | 3/2.0 | 1,643 (-15%) | 4mo | $225,000 | $137 | 56 |
| 123 Rockland Rd | 0.71mi | 4/1.5 (+1) | 1,872 (-3%) | 4mo | $250,000 | $134 | 54 |
| 40 Butcher Rd | 0.53mi | 2/1.5 (-1) | 1,932 (+0%) | 23mo | $425,000 | $220 | 51 |
| 127 Rockland Rd | 0.73mi | 4/3.0 (+1) | 1,984 (+3%) | 9mo | $250,000 | $126 | 43 |
| 98 Rockland Rd | 0.58mi | 3/1.5 | 1,767 (-8%) | 20mo | $53,500 | $30 | 43 |
Match score weights: distance 35% · size 25% · config 20% · recency 20%. Top-matched comps best support the ARV.
Projected returns pro-forma
6.14% appreciation · 3.0% rent growth · sell at horizon
- IRR
- 15.4%
- Equity multiple
- 2.04×
- Total profit
- $64,217
- Equity at exit
- $140,265
- IRR
- 15.5%
- Equity multiple
- 4.08×
- Total profit
- $189,451
- Equity at exit
- $256,077
Cash invested: $61,600 (down + closing). Projections, not guarantees.
Landlord ↔ Tenant lean methodology
- Overall (STATE)
- 15 Strongly Tenant-Friendly
- State New York
- 15 Strongly Tenant-Friendly · D+10
- County
- — inherits STATE
- City
- — inherits STATE
ZIP-level market 12776
- Home prices YoY
- 2.1%
- Active inventory
- 39
- Price-to-rent
- 9.4×
Monthly cashflow live
- Estimated rent
- $1,944 medium interval (Pro) →
- Mortgage (P&I)
- −$1,154
- Tax from tax record
- −$309 /mo · $3,708/yr
- Insurance
- −$92
- HOA
- −$0
- Vacancy / Maint / Mgmt
- −$408
- Net cashflow
- $-19
Break-even live
UW: 25.0% down · 7.5% · 30yr · 1.5% tax · 5.0% vac · 8.0% maint · 8.0% mgmt
Financing live
Cash to close
- Down payment
- $55,000
- Closing costs
- $6,600
- Reserves months
- —
- Total cash needed
- —
Loan-product check · same deal, 3 products live
Conventional
25% down · 7.5% · 30yr
- Down + closing
- —
- Monthly P&I
- —
- Monthly cashflow
- —
- DSCR
- —
- Eligible?
- —
Personal DTI + credit; lowest rate.
DSCR
20% down · 8.5% · 30yr
- Down + closing
- —
- Monthly P&I
- —
- Monthly cashflow
- —
- DSCR
- —
- Eligible?
- —
No personal income docs; deal must DSCR.
Hard money
10% down · 12.0% · 12mo
- Down + closing
- —
- Monthly P&I
- —
- Monthly cashflow
- —
- DSCR
- —
- Eligible?
- —
Short-term bridge; refi at stabilization.
Listing history 7 events
-
2026-02-09soldstatus $225,000
-
2025-11-24status Pending
-
2025-10-17price $220,000
-
2025-05-27price $279,000
-
2025-05-12price $315,000
-
2025-04-21price $320,000
-
2025-03-21$330,000 Active
ⓘ Source: listings_history table (triggers on properties + properties_extension) + one-shot
backfill from property_details.listing_events for pre-trigger history.
Tax reassessment forecast NY · Partial reset (capped growth)
- Current annual tax
- $3,708 · $309/mo
- Projected year-2 tax
- $3,713 · $309/mo
- Expected delta
- +$5/yr ($0/mo · 0.1%)
ⓘ Screening estimate from a state-policy table — verify with the county assessor before closing.
Climate risk First Street
- Flood 1/10 Low FEMA zone X (unshaded) · 0% chance over 30 yrs
- Wildfire 1/10 Low
- Heat 3/10 Moderate 8 d/yr ≥88°F today · 19 d/yr by 30 yrs out
- Wind 2/10 Low 2% chance of damaging wind over 30 yrs
- Air quality 2/10 Low 0 unhealthy d/yr today · 1 by 30 yrs out
Nearby sold comps map
Loading sold comps map…
Walkable amenities ~0.75 mi
Loading nearby amenities…
Taxation est. · year 1
- Rental income
- $23,325
- − Mortgage interest
- −$12,323
- − Property taxes
- −$3,708
- − Insurance
- −$1,100
- − Repairs & maintenance
- −$1,866
- − Management
- −$1,866
- − Depreciation
- −$6,400
- Taxable loss
- −$3,938
- Est. tax savings @ 24.0%
- +$945
- After-tax cash flow
- $719/yr
For passive investors: Depreciation is non-cash, so a rental often shows a tax loss while cash-flowing — sheltering income. Rental losses are passive: they offset passive income freely, and up to $25,000/yr can offset ordinary (W-2) income if you actively participate and your MAGI is under $100k (phasing out to $0 by $150k); unused losses carry forward. On sale, claimed depreciation is recaptured at up to 25%, and gains may owe capital-gains tax (a 1031 exchange can defer both). Figures are a year-1 estimate at your 24.0% rate — not tax advice; consult a CPA.
Schools (NCES district)
- District
- Roscoe Central School District
- NCES district ID
- 3625020
- Math proficiency
- 35% ▬ 0.00%
- Reading proficiency
- 35% ▬ 0.00%
- Median HH income
- $50,743
- Composite
- 33.05/100
- National rank
- #10658
- State rank
- #689 of 755 in NY
Livability — Roscoe
- Score
- 56/100
- State rank
- #1100
- US rank
- #22431
Category grades
Schools grade is shown separately in the Schools card above.
Census & demographics
- Census place
- Roscoe, NY
- Population (ZIP)
- 2,046
Population outlook (Sullivan County) Hauer SSP2
- Today (2025)
- 68,974 people
- By 2030
- 65,609 · -4.9%
- By 2040
- 58,878 · -14.6%
- By 2050
- 52,500 · -23.9%
- By 2075
- 39,941 · -42.1%
- By 2100
- 28,880 · -58.1%
Race, ethnicity, and origin ACS 2023
- Neighborhood character
- Predominantly White (86%)
- Race & ethnicity
- White 86% Hispanic / Latino 10% Two or more races 6%
- Hispanic origin (detail)
- Puerto Rican 6%
- Common ancestry
- Iranian 5% Romanian 4% Lithuanian 3%
- Foreign-born
- 2% · Canada
- Languages at home
- 95% English-only · Spanish 3% Other Indo-European 1%
Political lean MEDSL · Sullivan
- 2024 margin
- R (+16.7) · D 41.6% · R 58.4%
- 2008→2024 swing
- -26.2pp toward R · 2008: 9.5pp · 2024: -16.7pp
- All cycles
- 2024: R+16.7 2020: R+9.2 2016: R+13.7 2012: D+10.4 2008: D+9.5
Not yet ingested
- Civics
- —
Market trends
- HPI YoY
- ▲ 6.14%
- Current HPI
- 298.015
- Rent YoY
- —
- Metro
- —
- State GDP YoY
- ▲ 2.60%
- F500 in state
- 92
Industry mix (Fortune 500 HQ in NY)
| Industry | F500 HQs | Revenue |
|---|---|---|
| Financial Services | 10 | $950B |
|
||
| Consumer Goods | 9 | $162B |
|
||
| Insurance | 4 | $225B |
|
||
| Telecommunications | 2 | $144B |
|
||
| Pharmaceuticals | 2 | $112B |
|
||
| Media / Entertainment | 2 | $69B |
|
||
Price history
-31.8% since first listed7 events — show timeline
- 2026-02-09 Sold (Public Records) $225,000 Public Records
- 2025-11-24 Pending — UNYREIS
- 2025-10-17 Price Changed $220,000 UNYREIS
- 2025-05-27 Price Changed $279,000 UNYREIS
- 2025-05-12 Price Changed $315,000 UNYREIS
- 2025-04-21 Price Changed $320,000 UNYREIS
- 2025-03-21 Listed $330,000 UNYREIS
Property tax history
+3.0%/yrLatest (2025): $3,708 · +0.9% YoY. Source: county tax records.
Cash-flow waterfall
monthlySold comps — $/sqft
last 12 mo · ≤1 miLoading sold comps…