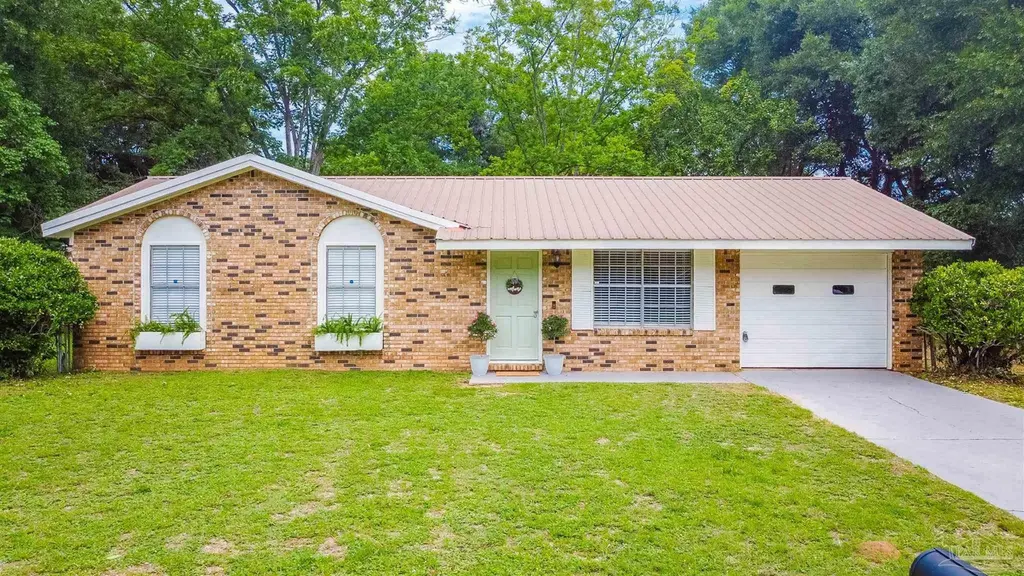
4272 W Avenida De Golf · Pea Ridge, FL
Flood risk 1/10 · Minimal
- FEMA flood zone
- X (unshaded)
- Chance of flooding over 30 yrs
- 0.0%
- Est. flood insurance / yr
- $507 – $1,088
Fire risk 3/10 · Minor
- Est. fire insurance / yr
- $947 – $1,759
Heat risk 10/10 · Severe
- Hot days now (above 105°F)
- 7 days/yr
- Hot days in 30 yrs
- 22 days/yr
Wind risk 9/10 · Severe
- Chance of severe wind over 30 yrs
- 99.0%
Air-quality risk 1/10 · Minimal
- Unhealthy air days now
- 0 days/yr
- Unhealthy air days in 30 yrs
- 0 days/yr
Risk factors via First Street. Map © Google.
Why this score? — see what drove the D- grade
The composite is a weighted blend of 9 inputs, each scored 0–100. Each bar is that input's sub-score; the figure is the points it added to the 100-point composite (weight × sub-score).
- Cash flow +12.0/30.0
- Schools +5.3/10.0
- DSCR +3.5/10.0
- Livability +3.5/5.0
- 1% rule +3.4/10.0
- Rent growth +3.2/5.0
- ARV discount +3.0/15.0
- Condition / age +2.5/5.0
- Appreciation +0.0/10.0
$200,000
🖨 Deal sheet 📄 Offer letter ✓ Due diligence
Listing remarks
Come see this beautiful home on 0.34 acres in Pace! Located in the Santa Villa neighborhood, this one family owned property features several upgrades including brand new carpet in the bedrooms (2026), new water heater (2024), metal roof, and ADT security system that includes sensors, smoke alarms & control center. Enjoy the gorgeous outdoor spaces featuring a spacious fenced backyard with an open patio area off the kitchen, a metal yard building for storage, and ample room for a garden, firepit, or other outdoor activity. The property also showcases an open patio overlooking the front yard and several fruit producing trees including date palms, two pecan trees, a kumquat tree, a pomeg
Key facts
- Hardwood flooring
- Open patio
- Metal yard building
Tags
Property features AI
Finance
- Other: Homestead exemption indicated
- Financial info: Association fees not applicable
- HOA & community: No homeowners association
Exterior
- Parking: Attached garage (1 car); One covered parking space; total of one parking space
- Security: Security system; Smoke detectors
- Utilities: Public water; Public sewer; Electric service with circuit breakers; Paved road access (county maintained)
- Home design: Single-story (one level); Resale property; Not attached to other properties; Yard building on the property
- Construction: Brick construction; Slab foundation; Metal roof; Built as a one-level home
- Exterior features: Patio; Chain link fencing around the backyard; Interior lot
Interior
- Kitchen: Dishwasher; Refrigerator; Electric water heater
- Bedrooms: Master bedroom on the first floor; Additional bedrooms on the first floor
- Flooring: Hardwood; Tile
- Bathrooms: One full bathroom on the first floor; One half bathroom on the first floor
- Heating & cooling: Central heating; Central air conditioning
- Interior features: Hardwood and tile flooring
- Laundry & utility: Washer/dryer hookups
Neighborhood map
What this means for you Summary
Snapshot
- This is a 3-bed/2.0-bath single-family listed at $200k.
Deal economics
- At list price, monthly cash flow is $-48 ($-576/yr) — negative.
- To cash-flow at today's rent, offer at most $193k (3.5% below list).
- To meet the 1% rule (rent ≥ 1% of price), the offer needs to be $169k (15.6% below list).
- Recommended offer: $169k (15.6% below list) — sets the bar for 1% rule.
- Cap rate 6.0% vs local median 4.5% in Pea Ridge — top-decile yield for the area; either an underpriced asset or a hidden risk that comps aren't pricing in. Stress-test before assuming the spread holds.
Location & tenants
- Location reads 69/100 on livability (#459 in FL) — a middle-class / working-renter tenant base. Strengths: cost of living A+, housing A+, crime A-; Watch: schools D-, amenities F, commute F.
- Santa Rosa (suburban): math 63% / reading 60% proficiency, ranked #8 of 73 in FL (top 11%) — acceptable for families but not a draw, mixed tenant base, ~2y average lease.
- Market conditions: Rents rising (+2.7%/yr); 665 active listings in the ZIP; 7 comparable units currently listed for rent nearby; rentals at typical pace (median 14d on market — plan ~3-4 weeks tenant-placement turnaround); solid renter incomes; 1,983 units permitted in Santa Rosa County in 2024 (128 in 5+ unit buildings).
Forward outlook
- Local home prices are declining (-3.0%/yr); year-one equity from $1k of loan paydown is wiped out by about $6k of value loss. Plan a longer hold.
- Santa Rosa County population projected at +31% by 2050 — long-run rental-demand tailwind backs the buy-and-hold thesis.
Negotiation context
- Only 3 days on market — expect competitive offers; lowballing is unlikely to land.
- Current owner paid $23k; list at $200k implies a 770% gain — meaningful room to come down on a strong offer.
Risks & watch-outs
- Climate carrying-cost: severe wind risk, 99% chance of damaging wind over 30y; extreme-heat days projected 7→22/yr by 2055 (HVAC capex compounding) — expect insurance premiums to compound above CPI over the hold.
Questions for the listing agent
- What do current leases actually rent for vs. the listed asking? Can we see a recent rent roll and the last 12 months of T-12 income?
- Built in 1977 — when were the roof, HVAC, electrical panel, plumbing, and water heater last replaced?
- Is there a deadline driving the sale (1031 exchange, divorce, estate, relocation)? That informs how much negotiation room exists.
- Schools are D-rated, which usually means shorter tenancies and higher turnover. Who's the typical renter profile here, and what's been the actual vacancy rate?
- The area grade is low — what's the realistic commute time and amenity access for the typical tenant pool here? Any planned neighborhood developments (good or bad) we should know about?
- What's the average days-on-market for RENTAL listings here right now (not sales)? A rising rental-DOM trend means longer vacancies and softer asking-rent achievability than the comps imply.
- What's the recent tenant-quality profile in this submarket — average credit score on applications, eviction rate, late-payment / NSF rate, and stable-employment percentage? A property-management company in the area should have these aggregated.
- How much new for-sale + rental construction is in the pipeline within 1–3 miles? Heavy new supply typically softens prices + rents 12–24 months out; constrained supply supports both.
Investment metrics
- 1% rule
- 0.84% ✗
- Cap rate
- 6.01%
- Cash-on-cash
- -1.03%
- DSCR
- 0.95
- GRM
- 9.9
CMA / ARV
- ARV (on-the-fly)
- $182,000
- Comps found
- 7
Show comp detail 7 sales within ~0.75 mi
| Address | Dist | Beds/Ba | Sqft | Sold | Price | $/sf | Match |
|---|---|---|---|---|---|---|---|
| 4373 Cecelia Ct | 0.16mi | 3/2.0 | 1,067 (+7%) | 4mo | $207,000 | $194 | 78 |
| 4229 W Avenida De Golf | 0.16mi | 3/1.5 | 1,014 (+1%) | 15mo | $185,000 | $182 | 76 |
| 4381 Santa Villa Dr | 0.24mi | 3/2.0 | 1,040 (+4%) | 8mo | $200,000 | $192 | 76 |
| 4531 Sunrise Dr | 0.58mi | 3/1.0 | 1,008 (+1%) | 5mo | $120,000 | $119 | 64 |
| 4344 W Avenida De Golf | 0.24mi | 3/1.5 | 1,040 (+4%) | 22mo | $189,500 | $182 | 62 |
| 5232 Catalina St | 0.51mi | 3/1.5 | 1,040 (+4%) | 23mo | $205,000 | $197 | 49 |
| 5248 Catalina St | 0.49mi | 3/2.0 | 1,118 (+12%) | 18mo | $195,000 | $174 | 42 |
Match score weights: distance 35% · size 25% · config 20% · recency 20%. Top-matched comps best support the ARV.
Projected returns pro-forma
-3.0% appreciation · 2.72% rent growth · sell at horizon
- IRR
- -18.3%
- Equity multiple
- 0.36×
- Total profit
- $-35,912
- Equity at exit
- $29,821
- IRR
- -11.1%
- Equity multiple
- 0.34×
- Total profit
- $-37,038
- Equity at exit
- $17,292
Cash invested: $56,000 (down + closing). Projections, not guarantees.
Landlord ↔ Tenant lean methodology
- Overall (STATE)
- 87 Strongly Landlord-Friendly
- State Florida
- 87 Strongly Landlord-Friendly · R+3
- County
- — inherits STATE
- City
- — inherits STATE
ZIP-level market 32571
- Home prices YoY
- -17.7%
- Rents YoY
- 2.7%
- Active inventory
- 665
- Price-to-rent
- 9.9×
Monthly cashflow live
- Estimated rent
- $1,689 high interval (Pro) →
- Mortgage (P&I)
- −$1,049
- Tax est. 1.5%
- −$250 /mo · $3,000/yr
- Insurance
- −$83
- HOA
- −$0
- Vacancy / Maint / Mgmt
- −$355
- Net cashflow
- $-48
Break-even live
UW: 25.0% down · 7.5% · 30yr · 1.5% tax · 5.0% vac · 8.0% maint · 8.0% mgmt
Financing live
Cash to close
- Down payment
- $50,000
- Closing costs
- $6,000
- Reserves months
- —
- Total cash needed
- —
Loan-product check · same deal, 3 products live
Conventional
25% down · 7.5% · 30yr
- Down + closing
- —
- Monthly P&I
- —
- Monthly cashflow
- —
- DSCR
- —
- Eligible?
- —
Personal DTI + credit; lowest rate.
DSCR
20% down · 8.5% · 30yr
- Down + closing
- —
- Monthly P&I
- —
- Monthly cashflow
- —
- DSCR
- —
- Eligible?
- —
No personal income docs; deal must DSCR.
Hard money
10% down · 12.0% · 12mo
- Down + closing
- —
- Monthly P&I
- —
- Monthly cashflow
- —
- DSCR
- —
- Eligible?
- —
Short-term bridge; refi at stabilization.
Rent comps 7 comps
| Address | Beds | Baths | Sqft | Rent | $/sqft | DOM | Units | Dist |
|---|---|---|---|---|---|---|---|---|
| 5385 E Avenida de Golf Milton, FL | 2.0 | 1.0 | 792 | $1,200 | $1.52 | 14d | 1 | 0.19mi |
| 4933 Bell Ridge Ln Milton, FL | 1.0–3.0 | 1.0–2.0 | 865 | $1,437 | $1.66 | 14d | 8 | 0.80mi |
| 4413 Oak Vista Ln Milton, FL | 1.0–3.0 | 1.0–2.0 | 992 | $2,354 | $2.37 | 14d | 18 | 1.23mi |
| 3864 Oakus Dr Unit 5B Milton, FL | 2.0 | 1.0 | 800 | $1,300 | $1.62 | 23d | 1 | 1.40mi |
| 4496 Fiske St Milton, FL | 3.0 | 2.0 | 1418 | $1,850 | $1.30 | 14d | 1 | 1.43mi |
| 4355 Park Ct Trlr Park , FL | 2.0 | 1.5 | 1000 | $1,200 | $1.20 | 23d | 1 | 1.46mi |
| 4389 Park Ct Trlr Park , FL | 2.0 | 1.0 | 700 | $1,100 | $1.57 | 23d | 1 | 1.46mi |
Listing history 4 events
-
2026-06-08status $200,000 Pending 3 DOM
-
2026-06-07days on market $200,000 Active 3 DOM
-
2026-06-05remarks 695-char remark
-
2026-06-05$200,000 Active 1 DOM
ⓘ Source: listings_history table (triggers on properties + properties_extension) + one-shot
backfill from property_details.listing_events for pre-trigger history.
Climate risk First Street
- Flood 1/10 Low FEMA zone X (unshaded) · 0% chance over 30 yrs
- Wildfire 3/10 Moderate
- Heat 10/10 Extreme 7 d/yr ≥105°F today · 22 d/yr by 30 yrs out
- Wind 9/10 Extreme 99% chance of damaging wind over 30 yrs
- Air quality 1/10 Low 0 unhealthy d/yr today · 0 by 30 yrs out
Nearby sold comps map
Loading sold comps map…
Walkable amenities ~0.75 mi
Loading nearby amenities…
Taxation est. · year 1
- Rental income
- $20,266
- − Mortgage interest
- −$11,203
- − Property taxes
- −$3,000
- − Insurance
- −$1,000
- − Repairs & maintenance
- −$1,621
- − Management
- −$1,621
- − Depreciation
- −$5,818
- Taxable loss
- −$3,998
- Est. tax savings @ 24.0%
- +$959
- After-tax cash flow
- $384/yr
For passive investors: Depreciation is non-cash, so a rental often shows a tax loss while cash-flowing — sheltering income. Rental losses are passive: they offset passive income freely, and up to $25,000/yr can offset ordinary (W-2) income if you actively participate and your MAGI is under $100k (phasing out to $0 by $150k); unused losses carry forward. On sale, claimed depreciation is recaptured at up to 25%, and gains may owe capital-gains tax (a 1031 exchange can defer both). Figures are a year-1 estimate at your 24.0% rate — not tax advice; consult a CPA.
Schools (NCES district)
- District
- Santa Rosa
- NCES district ID
- 1201650
- Math proficiency
- 63% ▼ -6.00%
- Reading proficiency
- 60% ▼ -5.00%
- Median HH income
- $58,161
- Composite
- 53.12/100
- National rank
- #1511
- State rank
- #8 of 73 in FL
Livability — Pea Ridge
- Score
- 69/100
- State rank
- #459
- US rank
- #8316
Category grades
Schools grade is shown separately in the Schools card above.
Census & demographics
- Census place
- Pea Ridge, FL
- County
- Santa Rosa County · 194,764 people
- Metro
- Pensacola-Ferry Pass-Brent, FL
- Population (ZIP)
- 42,171
- Household income
- $87,617
- Rent vs Own
- Severe rent burden
- 301.0
Population outlook (Santa Rosa County) Hauer SSP2
- Today (2025)
- 195,978 people
- By 2030
- 209,782 · +7.0%
- By 2040
- 235,293 · +20.1%
- By 2050
- 256,408 · +30.8%
- By 2075
- 298,074 · +52.1%
- By 2100
- 303,216 · +54.7%
Race, ethnicity, and origin ACS 2023
- Neighborhood character
- Predominantly White (80%)
- Race & ethnicity
- White 80% Two or more races 9% Hispanic / Latino 6% Black 4% Asian 2%
- Hispanic origin (detail)
- Mexican 3%
- Common ancestry
- Lithuanian 4% Italian 3% Slovak 2%
- Foreign-born
- 6% · Canada, South Korea
- Languages at home
- 93% English-only · Spanish 2% Other Indo-European 1% Russian/Polish/Slavic 1%
Political lean MEDSL · Santa Rosa
- 2024 margin
- Solid R (+51.0) · D 24.1% · R 75.0%
- 2008→2024 swing
- -3.0pp toward R · 2008: -47.9pp · 2024: -51.0pp
- All cycles
- 2024: R+51.0 2020: R+46.5 2016: R+53.5 2012: R+52.6 2008: R+47.9
Not yet ingested
- Civics
- —
Market trends
- HPI YoY
- ▼ -62.39%
- Current HPI
- 290.2953
- Rent YoY
- ▲ 2.72%
- Metro
- Pensacola-Ferry Pass-Brent, FL
- State GDP YoY
- ▲ 3.28%
- F500 in state
- 36
Industry mix (Fortune 500 HQ in FL)
| Industry | F500 HQs | Revenue |
|---|---|---|
| Industrial Technology | 2 | $29B |
|
||
| Insurance | 2 | $17B |
|
||
| Retail | 1 | $60B |
|
||
| Technology Distribution | 1 | $58B |
|
||
| Homebuilding | 1 | $35B |
|
||
| Technology Manufacturing | 1 | $35B |
|
||
Price history
+769.6% since first listed2 events — show timeline
- 2026-06-04 Listed $200,000 PARMLS
- 1977-09-01 Sold (Public Records) $23,000 Public Records
Property tax history
+1.8%/yrLatest (2025): $330 · +3.2% YoY. Source: county tax records.
Cash-flow waterfall
monthlySold comps — $/sqft
last 12 mo · ≤1 miLoading sold comps…