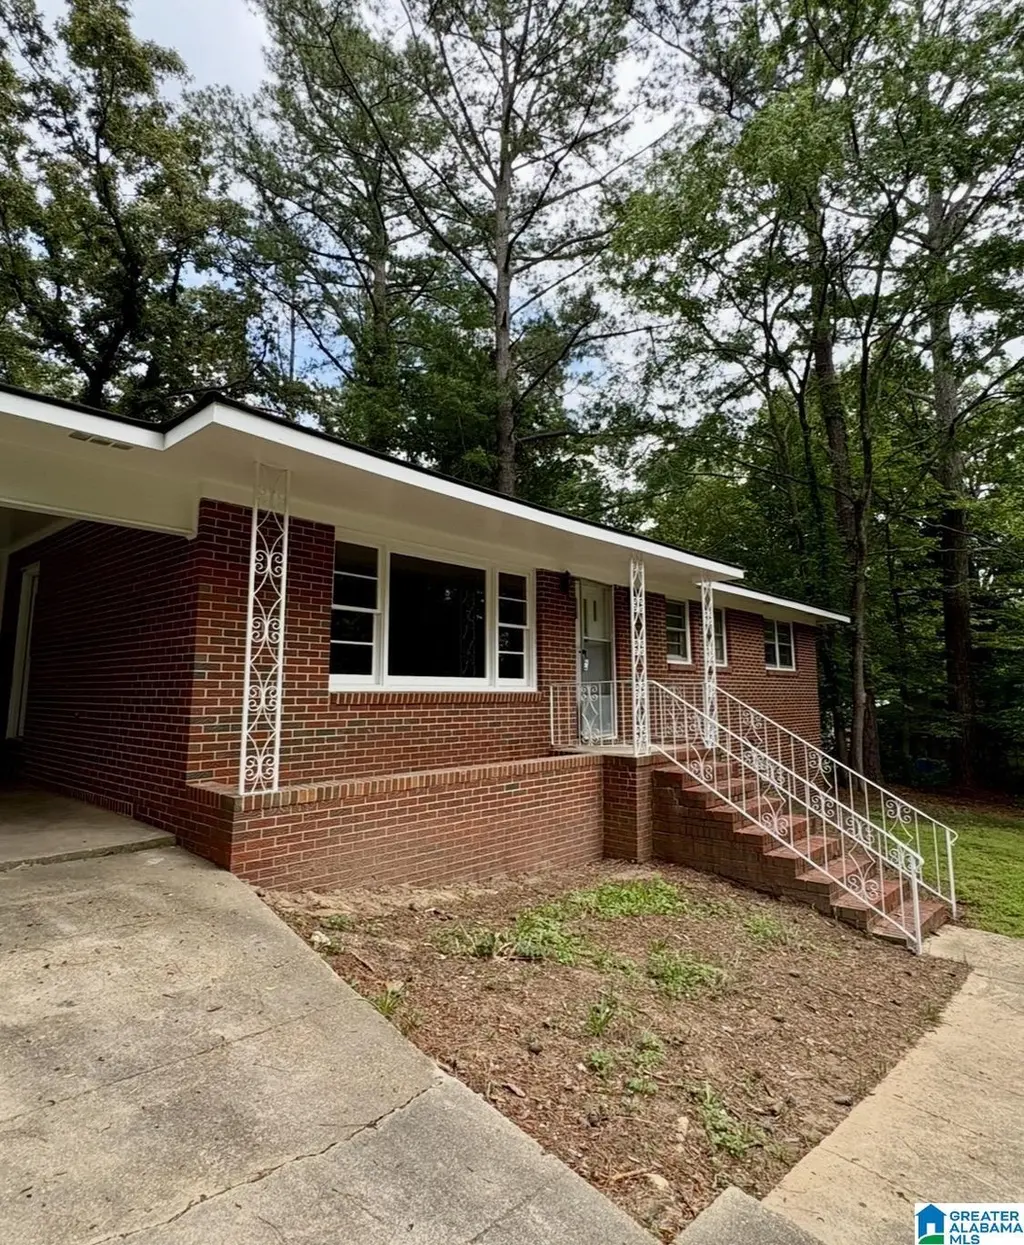
801 Bonnie Dr · Weaver, AL
Flood risk 1/10 · Minimal
- FEMA flood zone
- X (unshaded)
- Chance of flooding over 30 yrs
- 0.0%
- Est. flood insurance / yr
- $507 – $1,088
Fire risk 4/10 · Minor
- Est. fire insurance / yr
- $916 – $1,700
Heat risk 6/10 · Moderate
- Hot days now (above 105°F)
- 7 days/yr
- Hot days in 30 yrs
- 19 days/yr
Wind risk 6/10 · Moderate
- Chance of severe wind over 30 yrs
- 27.0%
Air-quality risk 3/10 · Minor
- Unhealthy air days now
- 2 days/yr
- Unhealthy air days in 30 yrs
- 3 days/yr
Risk factors via First Street. Map © Google.
Why this score? — see what drove the C grade
The composite is a weighted blend of 9 inputs, each scored 0–100. Each bar is that input's sub-score; the figure is the points it added to the 100-point composite (weight × sub-score).
- Cash flow +21.6/30.0
- ARV discount +15.0/15.0
- DSCR +6.9/10.0
- 1% rule +4.8/10.0
- Livability +3.2/5.0
- Schools +2.9/10.0
- Rent growth +2.5/5.0
- Condition / age +2.5/5.0
- Appreciation +0.0/10.0
$145,000
🖨 Deal sheet 📄 Offer letter ✓ Due diligence
Listing remarks
Charming Weaver home situated on a spacious ½-acre lot! This 3-bedroom, 1.5-bath home offers comfortable living with beautiful hardwood and tile flooring throughout. Enjoy plenty of outdoor space for relaxing, entertaining, or gardening, all while being conveniently located near local amenities. A great opportunity for first-time buyers, downsizers, or investors!
Key facts
- Hardwood flooring
- Spacious lot
- Tile flooring
Tags
Property features AI
Finance
- HOA & community: No association fee
Exterior
- Parking: Driveway parking; One carport space
- Utilities: Public water; Connected sewer; Has internet service availability; Two or more water heaters
- Home design: Existing single-family home; Four-sided brick construction; Crawl space foundation
- Construction: 4-side brick exterior; Crawl space foundation
- Exterior features: Fenced yard; No pool; No patio, deck, or garden
Interior
- Kitchen: Tile countertops
- Bedrooms: Master bedroom on main level; Two additional bedrooms on main level
- Flooring: Hardwood floors; Tile floors
- Bathrooms: One full bathroom with tub/shower combo; One half bathroom
- Heating & cooling: Central heating (electric); Central cooling (electric)
- Interior features: Smooth ceilings; Hardwood and tile flooring; Attic present; Laundry room on main level (utilities in garage)
- Laundry & utility: Laundry room on main level; Electric dryer hookup; Utilities located in garage
Neighborhood map
What this means for you Summary
Snapshot
- This is a 3-bed/1.5-bath single-family listed at $145k.
Deal economics
- At list price, monthly cash flow is $220 ($3k/yr) — positive.
- The deal already cash-flows at list — no discount required.
- To meet the 1% rule (rent ≥ 1% of price), the offer needs to be $142k (2.1% below list).
- Recommended offer: $142k (2.1% below list) — sets the bar for 1% rule.
- Cap rate 8.1% vs local median 6.6% in Weaver — meaningfully above typical; check what's discounted (condition, days-on-market, listing class) to confirm the premium yield is real.
Location & tenants
- Location reads 63/100 on livability (#195 in AL) — a middle-class / working-renter tenant base. Strengths: cost of living A+, housing A+; Watch: employment C-, amenities F, commute F.
- Calhoun County (rural): math 19% / reading 49% proficiency, ranked #46 of 129 in AL (top 36%) — families likely to look elsewhere, expect single-tenant / working-renter base with shorter leases.
- Zoned schools: Weaver Elementary School (math 15% / reading 52%, grade F, #318 of 627 statewide, top 51%, 553 students, 73% FRL); Weaver High School (math 11% / reading 40%, grade F, #111 of 305 statewide, top 37%, 517 students, 67% FRL) — zoned schools average 70% FRL vs 49% district-wide (21 pts higher); higher-poverty schools than district average — tighter screening recommended.
- Market conditions: 30 active listings in the ZIP; 135 units permitted in Calhoun County in 2024 (0 in 5+ unit buildings).
Forward outlook
- Local home prices are declining (-3.0%/yr); year-one equity from $1k of loan paydown is wiped out by about $4k of value loss. Plan a longer hold.
- Calhoun County population projected at -21% by 2050 — secular population decline; favor cash flow + early exit over multi-decade hold.
Negotiation context
- Only 11 days on market — expect competitive offers; lowballing is unlikely to land.
Risks & watch-outs
- Climate carrying-cost: major wind risk, 27% chance of damaging wind over 30y; extreme-heat days projected 7→19/yr by 2055 (HVAC capex compounding) — expect insurance premiums to compound above CPI over the hold.
Questions for the listing agent
- Built in 1961 — when were the roof, HVAC, electrical panel, plumbing, and water heater last replaced?
- Is there a deadline driving the sale (1031 exchange, divorce, estate, relocation)? That informs how much negotiation room exists.
- Schools are D-rated, which usually means shorter tenancies and higher turnover. Who's the typical renter profile here, and what's been the actual vacancy rate?
- What's the average days-on-market for RENTAL listings here right now (not sales)? A rising rental-DOM trend means longer vacancies and softer asking-rent achievability than the comps imply.
- What's the recent tenant-quality profile in this submarket — average credit score on applications, eviction rate, late-payment / NSF rate, and stable-employment percentage? A property-management company in the area should have these aggregated.
- How much new for-sale + rental construction is in the pipeline within 1–3 miles? Heavy new supply typically softens prices + rents 12–24 months out; constrained supply supports both.
Investment metrics
- 1% rule
- 0.98% ✗
- Cap rate
- 8.12%
- Cash-on-cash
- 6.51%
- DSCR
- 1.29
- GRM
- 8.5
CMA / ARV
- ARV (on-the-fly)
- $183,080
- Comps found
- 12
Show comp detail 12 sales within ~0.75 mi
| Address | Dist | Beds/Ba | Sqft | Sold | Price | $/sf | Match |
|---|---|---|---|---|---|---|---|
| 902 Ridge Dr | 0.15mi | 3/1.5 | 1,532 (-4%) | 4mo | $148,000 | $97 | 83 |
| 826 Parker Blvd | 0.44mi | 3/1.0 | 1,572 (-1%) | 1mo | $183,000 | $116 | 75 |
| 1102 Bonnie Dr | 0.24mi | 3/2.0 | 1,724 (+8%) | 2mo | $174,900 | $101 | 72 |
| 1009 Astor Ave | 0.38mi | 3/2.0 | 1,500 (-6%) | 0mo | $198,000 | $132 | 70 |
| 104 Main St | 0.34mi | 4/2.0 (+1) | 1,661 (+4%) | 0mo | $110,000 | $66 | 70 |
| 512 Caroline Dr | 0.64mi | 3/2.0 | 1,590 (-0%) | 8mo | $168,000 | $106 | 61 |
| 409 Russell Ln | 0.57mi | 3/2.0 | 1,527 (-4%) | 5mo | $179,000 | $117 | 60 |
| 111 Crestview Dr | 0.53mi | 3/2.0 | 1,668 (+5%) | 8mo | $234,900 | $141 | 58 |
| 601 Parker Blvd | 0.26mi | 4/3.0 (+1) | 1,689 (+6%) | 11mo | $195,000 | $115 | 58 |
| 805 Jacksonville St | 0.16mi | 4/2.0 (+1) | 1,793 (+13%) | 9mo | $185,000 | $103 | 56 |
| 1509 Maple Dr | 0.65mi | 3/2.0 | 1,824 (+15%) | 2mo | $175,000 | $96 | 42 |
| 1034 Russell Dr | 0.71mi | 4/2.0 (+1) | 1,492 (-6%) | 15mo | $190,000 | $127 | 37 |
Match score weights: distance 35% · size 25% · config 20% · recency 20%. Top-matched comps best support the ARV.
Projected returns pro-forma
-3.0% appreciation · 3.0% rent growth · sell at horizon
- IRR
- -6.3%
- Equity multiple
- 0.77×
- Total profit
- $-9,505
- Equity at exit
- $21,620
- IRR
- 3.3%
- Equity multiple
- 1.24×
- Total profit
- $9,625
- Equity at exit
- $12,537
Cash invested: $40,600 (down + closing). Projections, not guarantees.
Landlord ↔ Tenant lean methodology
- Overall (STATE)
- 90 Strongly Landlord-Friendly
- State Alabama
- 90 Strongly Landlord-Friendly · R+15
- County
- — inherits STATE
- City
- — inherits STATE
ZIP-level market 36277
- Home prices YoY
- -17.7%
- Active inventory
- 30
- Price-to-rent
- 8.5×
Monthly cashflow live
- Estimated rent
- $1,419 medium interval (Pro) →
- Mortgage (P&I)
- −$760
- Tax from tax record
- −$80 /mo · $962/yr
- Insurance
- −$60
- HOA
- −$0
- Vacancy / Maint / Mgmt
- −$298
- Net cashflow
- $220
Break-even live
UW: 25.0% down · 7.5% · 30yr · 1.5% tax · 5.0% vac · 8.0% maint · 8.0% mgmt
Financing live
Cash to close
- Down payment
- $36,250
- Closing costs
- $4,350
- Reserves months
- —
- Total cash needed
- —
Loan-product check · same deal, 3 products live
Conventional
25% down · 7.5% · 30yr
- Down + closing
- —
- Monthly P&I
- —
- Monthly cashflow
- —
- DSCR
- —
- Eligible?
- —
Personal DTI + credit; lowest rate.
DSCR
20% down · 8.5% · 30yr
- Down + closing
- —
- Monthly P&I
- —
- Monthly cashflow
- —
- DSCR
- —
- Eligible?
- —
No personal income docs; deal must DSCR.
Hard money
10% down · 12.0% · 12mo
- Down + closing
- —
- Monthly P&I
- —
- Monthly cashflow
- —
- DSCR
- —
- Eligible?
- —
Short-term bridge; refi at stabilization.
Listing history 9 events
-
2026-06-15statusdays on market $145,000 Pending 11 DOM
-
2026-06-14days on market $145,000 Contingent 10 DOM
-
2026-06-13statusdays on market $145,000 Contingent 9 DOM
-
2026-06-10days on market $145,000 Active 7 DOM
-
2026-06-09days on market $145,000 Active 6 DOM
-
2026-06-08days on market $145,000 Active 5 DOM
-
2026-06-07days on market $145,000 Active 4 DOM
-
2026-06-03remarks 365-char remark
-
2026-06-03$145,000 Active 1 DOM
ⓘ Source: listings_history table (triggers on properties + properties_extension) + one-shot
backfill from property_details.listing_events for pre-trigger history.
Tax reassessment forecast AL · Resets to sale price
- Current annual tax
- $962 · $80/mo
- Projected year-2 tax
- $962 · $80/mo
- Expected delta
- $0/yr ($0/mo · 0.0%)
ⓘ Screening estimate from a state-policy table — verify with the county assessor before closing.
Climate risk First Street
- Flood 1/10 Low FEMA zone X (unshaded) · 0% chance over 30 yrs
- Wildfire 4/10 Moderate
- Heat 6/10 Major 7 d/yr ≥105°F today · 19 d/yr by 30 yrs out
- Wind 6/10 Major 27% chance of damaging wind over 30 yrs
- Air quality 3/10 Moderate 2 unhealthy d/yr today · 3 by 30 yrs out
Nearby sold comps map
Loading sold comps map…
Walkable amenities ~0.75 mi
Loading nearby amenities…
Taxation est. · year 1
- Rental income
- $17,032
- − Mortgage interest
- −$8,122
- − Property taxes
- −$962
- − Insurance
- −$725
- − Repairs & maintenance
- −$1,363
- − Management
- −$1,363
- − Depreciation
- −$4,218
- Taxable income
- $280
- Est. tax owed @ 24.0%
- −$67
- After-tax cash flow
- $2,577/yr
For passive investors: Depreciation is non-cash, so a rental often shows a tax loss while cash-flowing — sheltering income. Rental losses are passive: they offset passive income freely, and up to $25,000/yr can offset ordinary (W-2) income if you actively participate and your MAGI is under $100k (phasing out to $0 by $150k); unused losses carry forward. On sale, claimed depreciation is recaptured at up to 25%, and gains may owe capital-gains tax (a 1031 exchange can defer both). Figures are a year-1 estimate at your 24.0% rate — not tax advice; consult a CPA.
Schools (NCES district)
- District
- Calhoun County
- NCES district ID
- 0100540
- Math proficiency
- 19% ▼ -26.00%
- Reading proficiency
- 49% ▬ 0.00%
- Median HH income
- $44,891
- Composite
- 28.91/100
- National rank
- #6635
- State rank
- #46 of 129 in AL
Livability — Weaver
- Score
- 63/100
- State rank
- #195
- US rank
- #15696
Category grades
Schools grade is shown separately in the Schools card above.
Census & demographics
- Census place
- Weaver, AL
- City population
- 5,153
- Population (ZIP)
- 5,153
Population outlook (Calhoun County) Hauer SSP2
- Today (2025)
- 109,765 people
- By 2030
- 105,708 · -3.7%
- By 2040
- 96,192 · -12.4%
- By 2050
- 86,413 · -21.3%
- By 2075
- 63,467 · -42.2%
- By 2100
- 44,704 · -59.3%
Race, ethnicity, and origin ACS 2023
- Neighborhood character
- Predominantly White (76%)
- Race & ethnicity
- White 76% Black 16% Hispanic / Latino 5% Two or more races 3%
- Hispanic origin (detail)
- Mexican 4%
- Common ancestry
- Italian 3% Portuguese 2% Slovak 2%
- Foreign-born
- 2% · Canada, South Korea
- Languages at home
- 97% English-only · Spanish 2%
Political lean MEDSL · Calhoun
- 2024 margin
- Solid R (+44.8) · D 27.2% · R 71.9%
- 2008→2024 swing
- -12.2pp toward R · 2008: -32.5pp · 2024: -44.8pp
- All cycles
- 2024: R+44.8 2020: R+39.0 2016: R+41.4 2012: R+31.9 2008: R+32.5
Not yet ingested
- Civics
- —
Market trends
- HPI YoY
- ▼ -41.96%
- Current HPI
- 195.0725
- Rent YoY
- —
- Metro
- —
- State GDP YoY
- ▲ 2.94%
- F500 in state
- 4
Industry mix (Fortune 500 HQ in AL)
| Industry | F500 HQs | Revenue |
|---|---|---|
| Financial Services | 1 | $8B |
|
||
| Healthcare | 1 | $5B |
|
||
Price history
1 event — show timeline
- 2026-06-03 Listed $145,000 Greater Alabama MLS
Property tax history
+2.7%/yrLatest (2025): $962 · +0.0% YoY. Source: county tax records.
Cash-flow waterfall
monthlySold comps — $/sqft
last 12 mo · ≤1 miLoading sold comps…