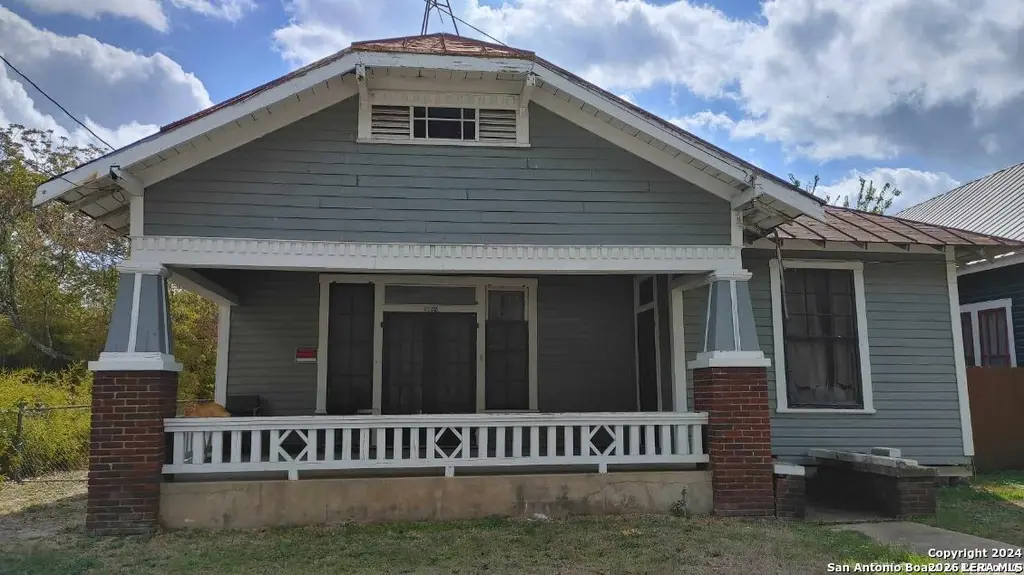
1122 Burnet · San Antonio, TX
Flood risk 1/10 · Minimal
- FEMA flood zone
- X (unshaded)
- Chance of flooding over 30 yrs
- 0.0%
- Est. flood insurance / yr
- $507 – $1,088
Fire risk 1/10 · Minimal
- Est. fire insurance / yr
- $1,222 – $2,270
Heat risk 8/10 · Major
- Hot days now (above 108°F)
- 7 days/yr
- Hot days in 30 yrs
- 20 days/yr
Wind risk 8/10 · Major
- Chance of severe wind over 30 yrs
- 80.0%
Air-quality risk 2/10 · Minimal
- Unhealthy air days now
- 1 days/yr
- Unhealthy air days in 30 yrs
- 2 days/yr
Risk factors via First Street. Map © Google.
Why this score? — see what drove the D grade
The composite is a weighted blend of 9 inputs, each scored 0–100. Each bar is that input's sub-score; the figure is the points it added to the 100-point composite (weight × sub-score).
- ARV discount +15.0/15.0
- Appreciation +10.0/10.0
- Cash flow +4.8/30.0
- Rent growth +4.5/5.0
- Livability +4.0/5.0
- Condition / age +2.5/5.0
- 1% rule +1.7/10.0
- Schools +1.4/10.0
- DSCR +0.0/10.0
$300,000
🖨 Deal sheet (PDF) 📄 Offer letter ✓ Due diligence
Listing remarks MLS
INVESTORS are welcome. This property is AS-IS and is listed below county appraisal value. Sellers are very motivated and will look at all offers. This is a Historic District community and great location. Ideal for handyman and good investment. Come and schedule a showing today.
Key facts
- 0.25 acre lot
- Listed 122 days
Neighborhood map
What this means for you Summary
Snapshot
- This is a 3-bed/2.0-bath single-family listed at $300k.
Deal economics
- At list price, monthly cash flow is $-733 ($-9k/yr) — negative.
- To cash-flow at today's rent, offer at most $170k (43.2% below list).
- To meet the 1% rule (rent ≥ 1% of price), the offer needs to be $201k (33.1% below list).
- Recommended offer: $170k (43.2% below list) — sets the bar for cash-flow.
Location & tenants
- Location reads 80/100 on livability (#31 in TX, #1,616 nationally) — a professional / high-income tenant draw. Strengths: amenities A+, commute A+, cost of living A+; Watch: crime F.
- San Antonio ISD (urban): math 12% / reading 22% proficiency, ranked #805 of 826 in TX (top 98%) — low school quality limits family demand, transient renter base, plan for 1-2y turnover; 80% free/reduced lunch — lower-income household profile, screen leases tightly.
- Zoned schools: Bowden Academy (math 10% / reading 18%, grade F, #4,127 of 4,322 statewide, top 96%, 477 students, 94% FRL, charter); Brackenridge H S (math 12% / reading 25%, grade F, #1,436 of 1,632 statewide, top 88%, 1,568 students, 88% FRL).
- Market conditions: Rents rising fast (+8.2%/yr); 201 active listings in the ZIP; 40 comparable units currently listed for rent nearby; rentals at typical pace (median 26d on market — plan ~3-4 weeks tenant-placement turnaround); 40% of comp listings sitting > 30 days — soft ceiling on asking rent; 8,308 units permitted in Bexar County in 2024 (2,506 in 5+ unit buildings).
- At $2,007/mo this rent would consume 51% of the median local household income ($47k/yr) (locally 543% of renters already pay >50% of income on rent) — very limited rent-growth headroom before tenants either downsize or default.
Forward outlook
- In year one you build about $32k of equity ($2k loan paydown + $30k appreciation (10.0% local appreciation)).
- Bexar County population projected at +50% by 2050 — long-run rental-demand tailwind backs the buy-and-hold thesis.
- By year 2, paydown + projected appreciation supports a ~$52k cash-out refi (75% LTV) — recoverable capital for the next deal without selling this one.
Negotiation context
- It's been on market 122 days — a 12% lower offer ($264k) is reasonable based on typical stale-listing flexibility.
- 2 sale attempts since 2y ago with the ask held roughly flat each time — persistent listings suggest the price (not the market) is what's stuck; bring a comps-based counter.
Risks & watch-outs
- Watch-outs: built in 1930 — expect roof / HVAC / electrical / plumbing capex.
- Climate carrying-cost: severe wind risk, 80% chance of damaging wind over 30y; extreme-heat days projected 7→20/yr by 2055 (HVAC capex compounding) — expect insurance premiums to compound above CPI over the hold.
Questions for the listing agent
- What do current leases actually rent for vs. the listed asking? Can we see a recent rent roll and the last 12 months of T-12 income?
- It's been on market 122 days. Have you received any prior offers? Is the seller open to a 43% concession, seller financing, or rate buy-down credit?
- Built in 1930 — when were the roof, HVAC, electrical panel, plumbing, and water heater last replaced?
- Why hasn't it sold? Are there any deal-killer items the seller is aware of (foundation, flood, title, zoning, code violations)?
- Is there a deadline driving the sale (1031 exchange, divorce, estate, relocation)? That informs how much negotiation room exists.
- Crime grade is F in this area — have there been break-ins, vandalism, or insurance claims at this property in the last 3 years? What carrier currently insures it and at what premium?
- The area grade is low — what's the realistic commute time and amenity access for the typical tenant pool here? Any planned neighborhood developments (good or bad) we should know about?
- What's the average days-on-market for RENTAL listings here right now (not sales)? A rising rental-DOM trend means longer vacancies and softer asking-rent achievability than the comps imply.
- What's the recent tenant-quality profile in this submarket — average credit score on applications, eviction rate, late-payment / NSF rate, and stable-employment percentage? A property-management company in the area should have these aggregated.
- How much new for-sale + rental construction is in the pipeline within 1–3 miles? Heavy new supply typically softens prices + rents 12–24 months out; constrained supply supports both.
Investment metrics
- 1% rule
- 0.67% ✗
- Cap rate
- 3.36%
- Cash-on-cash
- -10.47%
- DSCR
- 0.53
- GRM
- 12.5
CMA / ARV
- ARV (median comp)
- $360,963
- List price
- $300,000
- Delta
- -16.89%
- Verdict
- UNDERPRICED
- Comps
- 20 within 1.0 mi
Show comp detail 12 sales within ~0.75 mi
| Address | Dist | Beds/Ba | Sqft | Sold | Price | $/sf | Match |
|---|---|---|---|---|---|---|---|
| 917 Hays St | 0.15mi | 3/2.5 | 2,160 (+12%) | 0mo | $549,000 | $254 | 72 |
| 423 N Mesquite St | 0.55mi | 3/2.5 | 1,925 (-1%) | 1mo | $399,990 | $208 | 71 |
| 922 N Pine | 0.27mi | 2/2.0 (-1) | 1,820 (-6%) | 4mo | $439,000 | $241 | 69 |
| 938 Dawson St | 0.23mi | 3/2.5 | 1,778 (-8%) | 6mo | $370,000 | $208 | 68 |
| 214 Rudolph | 0.34mi | 3/2.5 | 1,757 (-9%) | 6mo | $324,990 | $185 | 62 |
| 414 Canton | 0.58mi | 4/2.5 (+1) | 1,899 (-2%) | 3mo | $230,000 | $121 | 60 |
| 508 N Cherry St | 0.60mi | 4/2.0 (+1) | 1,896 (-2%) | 4mo | $309,990 | $163 | 60 |
| 1012 N Cherry St | 0.66mi | 3/2.5 | 1,828 (-6%) | 7mo | $395,000 | $216 | 52 |
| 8543 Willow Xing | 0.39mi | 4/2.5 (+1) | 1,692 (-13%) | 3mo | $205,999 | $122 | 52 |
| 8523 Willow Xing | 0.39mi | 4/2.5 (+1) | 1,692 (-13%) | 3mo | $195,999 | $116 | 51 |
| 533 Nolan | 0.52mi | 2/2.0 (-1) | 1,671 (-14%) | 6mo | $149,999 | $90 | 43 |
| 1112 Muncey | 0.75mi | 4/2.0 (+1) | 2,080 (+7%) | 7mo | $400,000 | $192 | 42 |
Match score weights: distance 35% · size 25% · config 20% · recency 20%. Top-matched comps best support the ARV.
Projected returns pro-forma
10.0% appreciation · 8.0% rent growth · sell at horizon
- IRR
- 18.3%
- Equity multiple
- 2.52×
- Total profit
- $127,478
- Equity at exit
- $270,264
- IRR
- 18.2%
- Equity multiple
- 6.22×
- Total profit
- $438,757
- Equity at exit
- $582,834
Cash invested: $84,000 (down + closing). Projections, not guarantees.
Landlord ↔ Tenant lean methodology
- Overall (STATE)
- 87 Strongly Landlord-Friendly
- State Texas
- 87 Strongly Landlord-Friendly · R+5
- County
- — inherits STATE
- City
- — inherits STATE
ZIP-level market 78202
- Home prices YoY
- 27.0%
- Rents YoY
- 8.2%
- Active inventory
- 201
- Price-to-rent
- 12.5×
Monthly cashflow live
- Estimated rent
- $2,007 high interval (Pro) →
- Mortgage (P&I)
- −$1,573
- Tax from tax record
- −$620 /mo · $7,443/yr
- Insurance
- −$125
- HOA
- −$0
- Vacancy / Maint / Mgmt
- −$421
- Net cashflow
- $-733
Break-even live
Sensitivity live
| Price | -10% $-563 | -5% $-648 | +0% $-733 | +5% $-818 | +10% $-903 |
|---|---|---|---|---|---|
| Rent | -10% $-892 | -5% $-812 | +0% $-733 | +5% $-654 | +10% $-575 |
| Rate | -1.0pp $-582 | -0.5pp $-657 | base $-733 | +0.5pp $-811 | +1.0pp $-890 |
UW: 25.0% down · 7.5% · 30yr · 1.5% tax · 5.0% vac · 8.0% maint · 8.0% mgmt
Financing live
Cash to close
- Down payment
- $75,000
- Closing costs
- $9,000
- Reserves months
- —
- Total cash needed
- —
Loan-product check · same deal, 3 products live
Conventional
25% down · 7.5% · 30yr
- Down + closing
- —
- Monthly P&I
- —
- Monthly cashflow
- —
- DSCR
- —
- Eligible?
- —
Personal DTI + credit; lowest rate.
DSCR
20% down · 8.5% · 30yr
- Down + closing
- —
- Monthly P&I
- —
- Monthly cashflow
- —
- DSCR
- —
- Eligible?
- —
No personal income docs; deal must DSCR.
Hard money
10% down · 12.0% · 12mo
- Down + closing
- —
- Monthly P&I
- —
- Monthly cashflow
- —
- DSCR
- —
- Eligible?
- —
Short-term bridge; refi at stabilization.
Rent comps 40 comps
| Address | Beds | Baths | Sqft | Rent | $/sqft | DOM | Units | Dist |
|---|---|---|---|---|---|---|---|---|
| 118 Canadian St San Antonio, TX | 3.0 | 2.0 | 1232 | $2,300 | $1.87 | 45d | 1 | 0.09mi |
| 1010 Burnet St San Antonio, TX | 3.0 | 2.5 | 1886 | $1,995 | $1.06 | 6d | 1 | 0.13mi |
| 115 Saint Charles San Antonio, TX | 3.0 | 2.0 | 1680 | $2,050 | $1.22 | 12d | 1 | 0.16mi |
| 1223 Hays St San Antonio, TX | 3.0 | 2.5 | 1810 | $2,495 | $1.38 | 25d | 1 | 0.20mi |
| 1102 Burleson San Antonio, TX | 3.0 | 2.0 | 1400 | $2,500 | $1.79 | 25d | 1 | 0.27mi |
| 821 Burleson San Antonio, TX | 2.0 | 2.5 | 1456 | $1,629 | $1.12 | 45d | 1 | 0.29mi |
| 1412 Hays St San Antonio, TX | 3.0 | 1.0 | 1250 | $1,495 | $1.20 | 25d | 1 | 0.34mi |
| 1018 N Olive St San Antonio, TX | 3.0 | 2.0 | 1600 | $1,495 | $0.93 | 45d | 1 | 0.37mi |
| 631 Potomac San Antonio, TX | 3.0 | 2.5 | 1844 | $1,797 | $0.97 | 25d | 1 | 0.45mi |
| 418 Lockhart St Unit 1 San Antonio, TX | 4.0 | 2.0 | 1479 | $1,590 | $1.08 | 45d | 1 | 0.50mi |
| 418 Lockhart San Antonio, TX | 4.0 | 2.0 | 1479 | $1,799 | $1.22 | 23d | 1 | 0.50mi |
| 1414 Burleson San Antonio, TX | 4.0 | 2.0 | 1769 | $2,000 | $1.13 | 45d | 1 | 0.50mi |
| 1707 Dawson St Unit 1101 San Antonio, TX | 2.0 | 1.5 | 1884 | $1,000 | $0.53 | 45d | 1 | 0.53mi |
| 603 N Mesquite St San Antonio, TX | 3.0 | 2.5 | 1333 | $1,750 | $1.31 | 25d | 1 | 0.55mi |
| 323 Gabriel Unit 1 101 San Antonio, TX | 3.0 | 2.5 | 1400 | $1,950 | $1.39 | 25d | 1 | 0.56mi |
| 323 Gabriel San Antonio, TX | 3.0 | 2.0 | 1400 | $1,950 | $1.39 | 23d | 1 | 0.56mi |
| 2332 E Houston St San Antonio, TX | 3.0 | 2.0 | 1652 | $1,550 | $0.94 | 25d | 1 | 0.57mi |
| 423 N Mesquite St San Antonio, TX | 3.0 | 2.5 | 1925 | $1,750 | $0.91 | 14d | 1 | 0.58mi |
| 1104 N Gevers St San Antonio, TX | 3.0 | 2.5 | 1276 | $1,725 | $1.35 | 45d | 1 | 0.58mi |
| 515 Nolan St San Antonio, TX | 4.0 | 2.0 | 1928 | $3,500 | $1.82 | 45d | 1 | 0.59mi |
| 452 Gulf San Antonio, TX | 3.0 | 1.0 | 1244 | $1,899 | $1.53 | 23d | 1 | 0.59mi |
| 1723 E Crockett St San Antonio, TX | 3.0 | 3.0 | 1819 | $1,800 | $0.99 | 25d | 1 | 0.60mi |
| 1727 E Crockett St San Antonio, TX | 3.0 | 3.0 | 1819 | $1,725 | $0.95 | 22d | 1 | 0.61mi |
| 1111 Gibbs San Antonio, TX | 3.0 | 2.0 | 1476 | $1,595 | $1.08 | 25d | 1 | 0.66mi |
| 817 Potomac San Antonio, TX | 3.0 | 2.5 | 1508 | $1,795 | $1.19 | 25d | 1 | 0.72mi |
| 811 Montana St Unit 1301 San Antonio, TX | 2.0 | 2.0 | 1240 | $1,800 | $1.45 | 45d | 1 | 0.72mi |
| 607 Gulf San Antonio, TX | 3.0 | 2.0 | 1482 | $1,395 | $0.94 | 25d | 1 | 0.73mi |
| 802 Montana St Unit 2 San Antonio, TX | 3.0 | 1.0 | 1440 | $1,500 | $1.04 | 12d | 1 | 0.75mi |
| 1607 N Pine St San Antonio, TX | 4.0 | 3.0 | 2034 | $2,995 | $1.47 | 45d | 1 | 0.76mi |
| 630 Montana St Unit 301 San Antonio, TX | 2.0 | 2.0 | 1320 | $2,250 | $1.70 | 16d | 1 | 0.78mi |
| 1419 Wyoming St San Antonio, TX | 2.0 | 1.0 | 1232 | $1,550 | $1.26 | 6d | 1 | 0.80mi |
| 1606 N Hackberry St #102 San Antonio, TX | 2.0 | 2.5 | 1474 | $2,500 | $1.70 | 12d | 1 | 0.82mi |
| 218 S Olive St #2101 San Antonio, TX | 3.0 | 3.5 | 1800 | $3,199 | $1.78 | 45d | 1 | 0.83mi |
| 222 S Olive St San Antonio, TX | 3.0 | 3.5 | 2073 | $2,500 | $1.21 | 45d | 1 | 0.84mi |
| 222 S Olive St #1102 San Antonio, TX | 3.0 | 3.5 | 2073 | $2,500 | $1.21 | 45d | 1 | 0.84mi |
| 808 E Carson St #101 San Antonio, TX | 3.0 | 2.5 | 1790 | $2,850 | $1.59 | 45d | 1 | 0.85mi |
| 808 E Carson #102 San Antonio, TX | 3.0 | 2.5 | 1883 | $2,900 | $1.54 | 45d | 1 | 0.85mi |
| 215 Center St #307 San Antonio, TX | 2.0 | 2.0 | 1424 | $2,350 | $1.65 | 25d | 1 | 0.87mi |
| 215 Center St #307 San Antonio, TX | 2.0 | 2.0 | 1424 | $2,350 | $1.65 | 22d | 1 | 0.87mi |
| 330 E Carson St Unit 2103 San Antonio, TX | 3.0 | 3.0 | 1428 | $2,215 | $1.55 | 45d | 1 | 0.88mi |
Listing history 20 events
-
2026-06-21days on market $300,000 Active 122 DOM
-
2026-06-18days on market $300,000 Active 119 DOM
-
2026-06-17days on market $300,000 Active 118 DOM
-
2026-06-16days on market $300,000 Active 117 DOM
-
2026-06-15days on market $300,000 Active 116 DOM
-
2026-06-13days on market $300,000 Active 114 DOM
-
2026-06-09days on market $300,000 Active 110 DOM
-
2026-06-08days on market $300,000 Active 109 DOM
-
2026-06-07days on market $300,000 Active 108 DOM
-
2026-06-04days on market $300,000 Active 105 DOM
-
2026-06-03days on market $300,000 Active 104 DOM
-
2026-06-02days on market $300,000 Active 103 DOM
-
2026-06-01days on market $300,000 Active 102 DOM
-
2026-05-31days on market $300,000 Active 101 DOM
-
2026-02-19$300,000 New 283-char remark
Show marketing remark (283 chars)
INVESTORS are welcome. This property is AS-IS and is listed below county appraisal value. Sellers are very motivated and will look at all offers. This is a Historic District community and great location. Ideal for handyman and good investment. Come and schedule a showing today.
-
2025-11-30historical
-
2025-03-10price $300,000
-
2024-11-27$335,000 New
-
2013-03-21soldstatus
-
1977-09-01soldstatus
ⓘ Source: listings_history table (triggers on properties + properties_extension) + one-shot
backfill from property_details.listing_events for pre-trigger history.
Tax reassessment forecast TX · Resets to sale price
- Current annual tax
- $7,443 · $620/mo
- Projected year-2 tax
- $7,443 · $620/mo
- Expected delta
- $0/yr ($0/mo · 0.0%)
ⓘ Screening estimate from a state-policy table — verify with the county assessor before closing.
Climate risk First Street
- Flood 1/10 Low FEMA zone X (unshaded) · 0% chance over 30 yrs
- Wildfire 1/10 Low
- Heat 8/10 Severe 7 d/yr ≥108°F today · 20 d/yr by 30 yrs out
- Wind 8/10 Severe 80% chance of damaging wind over 30 yrs
- Air quality 2/10 Low 1 unhealthy d/yr today · 2 by 30 yrs out
Nearby sold comps map
Loading sold comps map…
Walkable amenities ~0.75 mi
Loading nearby amenities…
Taxation est. · year 1
- Rental income
- $24,081
- − Mortgage interest
- −$16,805
- − Property taxes
- −$7,443
- − Insurance
- −$1,500
- − Repairs & maintenance
- −$1,926
- − Management
- −$1,926
- − Depreciation
- −$8,727
- Taxable loss
- −$14,247
- Est. tax savings @ 24.0%
- +$3,419
- After-tax cash flow
- $-5,379/yr
For passive investors: Depreciation is non-cash, so a rental often shows a tax loss while cash-flowing — sheltering income. Rental losses are passive: they offset passive income freely, and up to $25,000/yr can offset ordinary (W-2) income if you actively participate and your MAGI is under $100k (phasing out to $0 by $150k); unused losses carry forward. On sale, claimed depreciation is recaptured at up to 25%, and gains may owe capital-gains tax (a 1031 exchange can defer both). Figures are a year-1 estimate at your 24.0% rate — not tax advice; consult a CPA.
Schools (NCES district)
- District
- San Antonio ISD
- NCES district ID
- 4838730
- Math proficiency
- 12% ▼ -21.00%
- Reading proficiency
- 22% ▼ -7.00%
- Median HH income
- $30,952
- Composite
- 13.57/100
- National rank
- #9512
- State rank
- #805 of 826 in TX
Livability — San Antonio
- Score
- 80/100
- State rank
- #31
- US rank
- #1616
Category grades
Schools grade is shown separately in the Schools card above.
Census & demographics
- Census place
- San Antonio, TX
- County
- Bexar County · 1,990,555 people
- City population
- 1,806,925
- Metro
- San Antonio-New Braunfels, TX
- Population (ZIP)
- 10,224
- Household income
- $47,478
- Rent vs Own
- Severe rent burden
- 543.0
Population outlook (Bexar County) Hauer SSP2
- Today (2025)
- 2,336,851 people
- By 2030
- 2,560,728 · +9.6%
- By 2040
- 3,020,569 · +29.3%
- By 2050
- 3,493,522 · +49.5%
- By 2075
- 4,668,459 · +99.8%
- By 2100
- 5,533,242 · +136.8%
Race, ethnicity, and origin ACS 2023
- Neighborhood character
- Predominantly Hispanic (66%)
- Race & ethnicity
- Hispanic / Latino 66% Two or more races 28% White 17% Black 16% Native American 1%
- Hispanic origin (detail)
- Mexican 57% Puerto Rican 1% Cuban 1%
- Common ancestry
- Italian 2% Slovak 1%
- Foreign-born
- 14% · Canada
- Languages at home
- 59% English-only · Spanish 41%
Political lean MEDSL · Bexar
- 2024 margin
- Lean D (+9.8) · D 54.3% · R 44.6% · Other 1.1%
- 2008→2024 swing
- +4.2pp toward D · 2008: 5.6pp · 2024: 9.8pp
- All cycles
- 2024: D+9.8 2020: D+18.2 2016: D+13.5 2012: D+4.6 2008: D+5.6
Not yet ingested
- Civics
- —
Market trends
- HPI YoY
- ▲ 53.82%
- Current HPI
- 253.3196
- Rent YoY
- ▲ 8.20%
- Metro
- San Antonio-New Braunfels, TX
- State GDP YoY
- ▲ 3.95%
- F500 in state
- 110
Industry mix (Fortune 500 HQ in TX)
| Industry | F500 HQs | Revenue |
|---|---|---|
| Energy | 16 | $1,198B |
|
||
| Technology | 5 | $198B |
|
||
| Engineering / Construction | 4 | $72B |
|
||
| Energy Services | 3 | $60B |
|
||
| Utilities | 3 | $41B |
|
||
| Healthcare | 2 | $330B |
|
||
Price history
-10.4% since first listed6 events — show timeline
- 2026-02-19 Listed $300,000 LERA
- 2025-11-30 Listing Removed — LERA
- 2025-03-10 Price Changed $300,000 LERA
- 2024-11-27 Listed $335,000 LERA
- 2013-03-21 Sold (Public Records) — Public Records
- 1977-09-01 Sold (Public Records) — Public Records
Property tax history
+9.6%/yrLatest (2025): $7,443 · -20.1% YoY. Source: county tax records.
Cash-flow waterfall
monthlySold comps — $/sqft
last 12 mo · ≤1 miLoading sold comps…