303 W 122nd St #2 · New York, NY
Flood risk 8/10 · Major
- FEMA flood zone
- X (unshaded)
- Chance of flooding over 30 yrs
- 0.78%
- Est. flood insurance / yr
- $507 – $1,088
Fire risk 1/10 · Minimal
- Est. fire insurance / yr
- $691 – $1,283
Heat risk 6/10 · Moderate
- Hot days now (above 99°F)
- 7 days/yr
- Hot days in 30 yrs
- 15 days/yr
Wind risk 6/10 · Moderate
- Chance of severe wind over 30 yrs
- 27.0%
Air-quality risk 4/10 · Minor
- Unhealthy air days now
- 5 days/yr
- Unhealthy air days in 30 yrs
- 6 days/yr
Risk factors via First Street. Map © Google.
Why this score? — see what drove the B+ grade
The composite is a weighted blend of 9 inputs, each scored 0–100. Each bar is that input's sub-score; the figure is the points it added to the 100-point composite (weight × sub-score).
- Cash flow +30.0/30.0
- 1% rule +10.0/10.0
- DSCR +10.0/10.0
- ARV discount +7.5/15.0
- Schools +5.0/10.0
- Appreciation +4.4/10.0
- Livability +3.8/5.0
- Rent growth +3.2/5.0
- Condition / age +2.2/5.0
$239,000
🖨 Deal sheet (PDF) 📄 Offer letter ✓ Due diligence
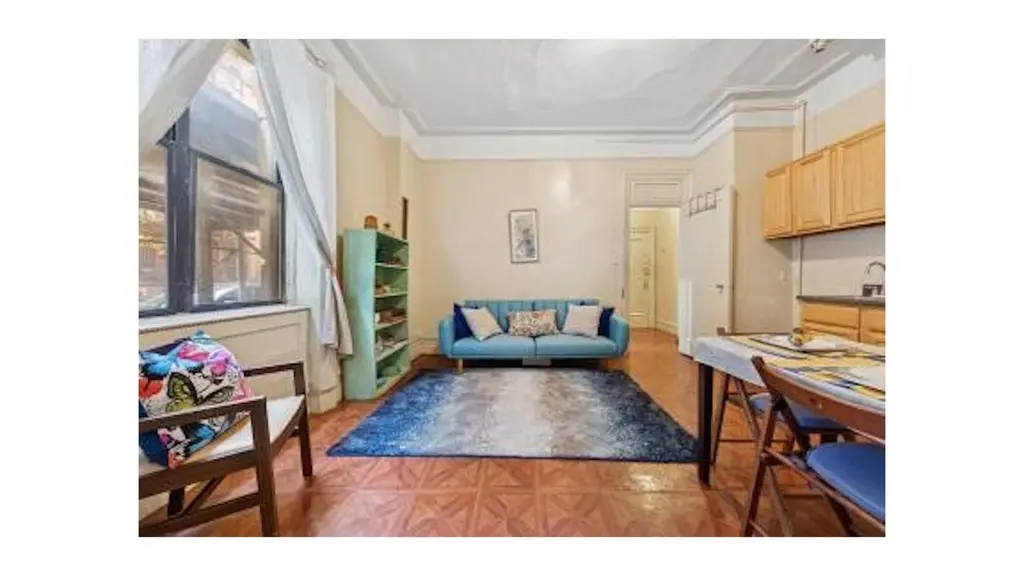
Listing remarks
one bedroom , large windows , high ceilings
Key facts
- $682 HOA
- Built 1913
- Listed 68 days
Property features AI
Finance
- Other: Building contains 42 total units
- HOA & community: Monthly association fee of $682; Building allows dogs (small dogs permitted)
Exterior
- Home design: 6-story building; Elevator building
- Exterior features: No exterior features listed; Zoning: R8A
Interior
- Bedrooms: Entry level: 6 (unit entry on 6th floor)
- Bathrooms: 1 full bathroom
- Heating & cooling: Window AC units (has cooling)
- Interior features: Total of 3 rooms; Basement described as 'Other'; Unit has a view
- Laundry & utility: Building laundry (other)
Neighborhood map
What this means for you Summary
Snapshot
- This is a 1-bed/1.0-bath single-family listed at $239k. Condition is rated fair.
Deal economics
- At list price, monthly cash flow is $905 ($11k/yr) — positive.
- The deal already cash-flows at list — no discount required.
- Meets the 1% rule at list price ($4k rent vs $239k).
- Recommended offer: $225k (6.0% below list) — sets the bar for market timing.
- Cap rate 11.2% vs local median 2.6% in New York — top-decile yield for the area; either an underpriced asset or a hidden risk that comps aren't pricing in. Stress-test before assuming the spread holds.
Location & tenants
- Location reads 75/100 on livability (#268 in NY, #4,188 nationally) — a middle-class / working-renter tenant base. Strengths: amenities A+, commute A+, health & safety A; Watch: crime F, cost of living F.
- Zoned schools: Elm Tree Elementary School (math 27% / reading 52%, grade F, #1,444 of 2,108 statewide, top 71%, 806 students, 94% FRL); Mark Twain Is 239 For The Gifted And Talented (math 90% / reading 96%, grade A+, #6 of 729 statewide, top 1%, 1,207 students, 44% FRL); Midwood High School (math 94% / reading 96%, grade A+, #83 of 1,100 statewide, top 8%, 4,062 students, 73% FRL).
- Market conditions: Rents rising (+2.7%/yr); 177 active listings in the ZIP; 15 comparable units currently listed for rent nearby; rentals at typical pace (median 19d on market — plan ~3-4 weeks tenant-placement turnaround); 4,467 units permitted in New York County in 2024 (4,463 in 5+ unit buildings).
- At $4,184/mo this rent would consume 84% of the median local household income ($60k/yr) (locally 5635% of renters already pay >50% of income on rent) — very limited rent-growth headroom before tenants either downsize or default.
Forward outlook
- Local home prices are declining (-1.3%/yr); year-one equity from $2k of loan paydown is wiped out by about $3k of value loss. Plan a longer hold.
- New York County population projected at +21% by 2050 — long-run rental-demand tailwind backs the buy-and-hold thesis.
- At projected returns (-1.3% appreciation + 2.7% rent growth), your $67k cash investment doubles in ~6 years — after that, you're playing with house money.
Negotiation context
- It's been on market 69 days — a 6% lower offer ($225k) is reasonable based on typical stale-listing flexibility.
Risks & watch-outs
- Watch-outs: flood insurance adds $66/mo; built in 1913 — expect roof / HVAC / electrical / plumbing capex.
- Climate carrying-cost: severe flood risk; major wind risk, 27% chance of damaging wind over 30y; extreme-heat days projected 7→15/yr by 2055 (HVAC capex compounding) — expect insurance premiums to compound above CPI over the hold.
Questions for the listing agent
- It's been on market 69 days. Have you received any prior offers? Is the seller open to a 6% concession, seller financing, or rate buy-down credit?
- Have any recent inspections been done? Can we get a copy of the seller's disclosures and any deferred-maintenance estimates?
- Built in 1913 — when were the roof, HVAC, electrical panel, plumbing, and water heater last replaced?
- What's the actual annual flood-insurance premium (NFIP or private), and is the property in a SFHA with mandatory coverage?
- What does the HOA fee cover, when was the last increase, and are there any pending special assessments or reserve-fund shortfalls?
- Why hasn't it sold? Are there any deal-killer items the seller is aware of (foundation, flood, title, zoning, code violations)?
- Is there a deadline driving the sale (1031 exchange, divorce, estate, relocation)? That informs how much negotiation room exists.
- Schools are B-rated — typically a magnet for longer-tenancy family renters. What's the average tenant stay here, and is there a school-zone premium baked into asking?
- Crime grade is F in this area — have there been break-ins, vandalism, or insurance claims at this property in the last 3 years? What carrier currently insures it and at what premium?
- What's the average days-on-market for RENTAL listings here right now (not sales)? A rising rental-DOM trend means longer vacancies and softer asking-rent achievability than the comps imply.
- What's the recent tenant-quality profile in this submarket — average credit score on applications, eviction rate, late-payment / NSF rate, and stable-employment percentage? A property-management company in the area should have these aggregated.
- How much new for-sale + rental construction is in the pipeline within 1–3 miles? Heavy new supply typically softens prices + rents 12–24 months out; constrained supply supports both.
Investment metrics
- 1% rule
- 1.75% ✓
- Cap rate
- 11.17%
- Cash-on-cash
- 17.43%
- DSCR
- 1.78
- GRM
- 4.8
CMA / ARV
No comps found within radius.
Projected returns pro-forma
-1.26% appreciation · 2.71% rent growth · sell at horizon
- IRR
- 12.2%
- Equity multiple
- 1.54×
- Total profit
- $36,186
- Equity at exit
- $54,725
- IRR
- 18.4%
- Equity multiple
- 2.79×
- Total profit
- $119,548
- Equity at exit
- $54,974
Cash invested: $66,920 (down + closing). Projections, not guarantees.
Landlord ↔ Tenant lean methodology
- Overall (CITY)
- 0 Strongly Tenant-Friendly
- State New York
- 15 Strongly Tenant-Friendly · D+10
- County
- — inherits STATE
- City New York
- 0 Strongly Tenant-Friendly · D+34
ZIP-level market 10027
- Home prices YoY
- -0.3%
- Rents YoY
- 2.7%
- Active inventory
- 177
- Price-to-rent
- 4.8×
Monthly cashflow live
- Estimated rent
- $4,184 medium interval (Pro) →
- Mortgage (P&I)
- −$1,253
- Tax est. 1.5%
- −$299 /mo · $3,585/yr
- Insurance
- −$100
- Flood insurance flood zone
- −$66 /mo · $798/yr
- HOA
- −$682
- Vacancy / Maint / Mgmt
- −$879
- Net cashflow
- $905
Break-even live
Sensitivity live
| Price | -10% $1,071 | -5% $988 | +0% $905 | +5% $823 | +10% $740 |
|---|---|---|---|---|---|
| Rent | -10% $575 | -5% $740 | +0% $905 | +5% $1,071 | +10% $1,236 |
| Rate | -1.0pp $1,026 | -0.5pp $966 | base $905 | +0.5pp $843 | +1.0pp $780 |
UW: 25.0% down · 7.5% · 30yr · 1.5% tax · 5.0% vac · 8.0% maint · 8.0% mgmt
Financing live
Cash to close
- Down payment
- $59,750
- Closing costs
- $7,170
- Reserves months
- —
- Total cash needed
- —
Loan-product check · same deal, 3 products live
Conventional
25% down · 7.5% · 30yr
- Down + closing
- —
- Monthly P&I
- —
- Monthly cashflow
- —
- DSCR
- —
- Eligible?
- —
Personal DTI + credit; lowest rate.
DSCR
20% down · 8.5% · 30yr
- Down + closing
- —
- Monthly P&I
- —
- Monthly cashflow
- —
- DSCR
- —
- Eligible?
- —
No personal income docs; deal must DSCR.
Hard money
10% down · 12.0% · 12mo
- Down + closing
- —
- Monthly P&I
- —
- Monthly cashflow
- —
- DSCR
- —
- Eligible?
- —
Short-term bridge; refi at stabilization.
Rent comps 15 comps
| Address | Beds | Baths | Sqft | Rent | $/sqft | DOM | Units | Dist |
|---|---|---|---|---|---|---|---|---|
| 241 Lenox Ave #1 New York, NY | 1.0 | 1.0 | 1175 | $8,000 | $6.81 | 20d | 1 | 0.37mi |
| 543 W 122nd St Unit 27C New York, NY | 2.0 | 2.0 | 1313 | $10,995 | $8.37 | 12d | 1 | 0.40mi |
| 543 W 122nd St New York, NY | 2.0 | 1.0–2.0 | 1057 | $7,948 | $7.52 | 4d | 7 | 0.40mi |
| 61 Malcolm X Blvd New York, NY | 2.0 | 2.0 | 1300 | $4,795 | $3.69 | 26d | 1 | 0.60mi |
| 1 Morningside Dr New York, NY | 3.0 | 1.0–2.0 | 1655 | $6,335 | $3.83 | 0d | 1 | 0.64mi |
| 545 W 110th St Unit 6A New York, NY | 2.0 | 2.0 | 1441 | $7,500 | $5.20 | 26d | 1 | 0.76mi |
| 420 Central Park W Unit 6K New York, NY | 2.0 | 2.0 | 1060 | $8,000 | $7.55 | 23d | 1 | 1.02mi |
| 915 W End Ave #1020 New York, NY | 1.0–3.0 | 1.0–2.0 | 851 | $6,070 | $7.13 | 1d | 2 | 1.03mi |
| 2413 3rd Ave Bronx, NY | 1.0–3.0 | 1.0–2.0 | 857 | $2,953 | $3.44 | 1d | 21 | 1.12mi |
| 400 Central Park W Unit 11D New York, NY | 2.0 | 2.0 | 1142 | $6,950 | $6.09 | 26d | 1 | 1.15mi |
| 5 Lincoln Ave Bronx, NY | 1.0–3.0 | 1.0–2.5 | 1011 | $2,856 | $2.82 | 0d | 181 | 1.18mi |
| 808 Columbus Ave New York, NY | 2.0 | 1.0–2.0 | 773 | $6,906 | $8.93 | 0d | 30 | 1.23mi |
| 788 Columbus Ave #1323 New York, NY | 1.0–3.0 | 1.0–1.5 | 900 | $3,660 | $4.07 | 26d | 2 | 1.24mi |
| 1635 Lexington Ave Unit 6D New York, NY | 2.0 | 2.0 | 1112 | $6,000 | $5.40 | 26d | 1 | 1.30mi |
| 70 W 95th St New York, NY | 1.0–4.0 | 1.0–2.0 | 1095 | $9,999 | $9.13 | 18d | 1 | 1.42mi |
HOA detail
- Monthly dues
- $682 · $8,184/yr
Listing history 11 events
-
2026-06-15days on market $239,000 Active 69 DOM
-
2026-06-13days on market $239,000 Active 67 DOM
-
2026-06-10days on market $239,000 Active 63 DOM
-
2026-06-08days on market $239,000 Active 62 DOM
-
2026-06-08days on market $239,000 Active 61 DOM
-
2026-06-04days on market $239,000 Active 58 DOM
-
2026-06-03days on market $239,000 Active 57 DOM
-
2026-06-01days on market $239,000 Active 55 DOM
-
2026-05-31days on market $239,000 Active 54 DOM
-
2026-04-07$239,000 Active
-
2025-12-04price $249,000
ⓘ Source: listings_history table (triggers on properties + properties_extension) + one-shot
backfill from property_details.listing_events for pre-trigger history.
Climate risk First Street
- Flood 8/10 Severe FEMA zone X (unshaded) · 78% chance over 30 yrs
- Wildfire 1/10 Low
- Heat 6/10 Major 7 d/yr ≥99°F today · 15 d/yr by 30 yrs out
- Wind 6/10 Major 27% chance of damaging wind over 30 yrs
- Air quality 4/10 Moderate 5 unhealthy d/yr today · 6 by 30 yrs out
Nearby sold comps map
Loading sold comps map…
Walkable amenities ~0.75 mi
Loading nearby amenities…
Taxation est. · year 1
- Rental income
- $50,211
- − Mortgage interest
- −$13,388
- − Property taxes
- −$3,585
- − Insurance
- −$1,992
- − Repairs & maintenance
- −$4,017
- − Management
- −$4,017
- − HOA
- −$8,184
- − Depreciation
- −$6,953
- Taxable income
- $8,075
- Est. tax owed @ 24.0%
- −$1,938
- After-tax cash flow
- $8,927/yr
For passive investors: Depreciation is non-cash, so a rental often shows a tax loss while cash-flowing — sheltering income. Rental losses are passive: they offset passive income freely, and up to $25,000/yr can offset ordinary (W-2) income if you actively participate and your MAGI is under $100k (phasing out to $0 by $150k); unused losses carry forward. On sale, claimed depreciation is recaptured at up to 25%, and gains may owe capital-gains tax (a 1031 exchange can defer both). Figures are a year-1 estimate at your 24.0% rate — not tax advice; consult a CPA.
Condition & rehab AI · 6 photos
This property is in fair condition with cosmetic updates needed, particularly in the kitchen and bathroom. Painting and updating these areas can significantly enhance its value.
Repairs flagged
- Minor kitchen cabinets — basic cabinets
- Minor bathroom fixtures — standard fixtures
Value-add opportunities
- Both paint interior walls — Fresh paint enhances curb appeal and interior aesthetics
- Both update kitchen cabinets — Modernizing the kitchen can increase both resale and rental value
- Both update bathroom fixtures — Upgrading fixtures can significantly boost both resale and rental appeal
Renovation cost estimate screening
| Repair item | Severity | Est. cost |
|---|---|---|
| kitchen cabinets · basic cabinets | Minor | $500–3,000 |
| bathroom fixtures · standard fixtures | Minor | $500–3,000 |
| Total estimated repair cost · 2 items | $1,000–6,000 |
Value-add ROI direction
- Both paint interior walls — Fresh paint enhances curb appeal and interior aesthetics ↑
- Both update kitchen cabinets — Modernizing the kitchen can increase both resale and rental value ↑
- Both update bathroom fixtures — Upgrading fixtures can significantly boost both resale and rental appeal ↑
ⓘ Cost ranges are severity-bucket heuristics (US national rule-of-thumb). Get contractor quotes + a written scope before underwriting a rehab budget.
Schools (NCES district)
No district data.
Livability — New York
- Score
- 75/100
- State rank
- #268
- US rank
- #4188
Category grades
Schools grade is shown separately in the Schools card above.
Census & demographics
- Census place
- New York, NY
- County
- New York County · 1,599,927 people
- City population
- 7,731,280
- Metro
- New York-Newark-Jersey City, NY-NJ-PA
- Population (ZIP)
- 63,885
- Household income
- $59,587
- Rent vs Own
- Severe rent burden
- 5635.0
Population outlook (New York County) Hauer SSP2
- Today (2025)
- 1,825,725 people
- By 2030
- 1,904,611 · +4.3%
- By 2040
- 2,052,719 · +12.4%
- By 2050
- 2,206,601 · +20.9%
- By 2075
- 2,509,427 · +37.4%
- By 2100
- 2,702,933 · +48.0%
Race, ethnicity, and origin ACS 2023
- Neighborhood character
- Highly diverse neighborhood (Simpson 0.75)
- Race & ethnicity
- Black 33% White 27% Hispanic / Latino 24% Asian 10% Two or more races 9%
- Hispanic origin (detail)
- Mexican 3% Puerto Rican 5% Dominican 10%
- Common ancestry
- Lithuanian 1% Scotch-Irish 1% Romanian 1%
- Foreign-born
- 26% · Canada, China, South Korea
- Languages at home
- 61% English-only · Spanish 18% French/Haitian/Cajun 5% Chinese 4%
Political lean MEDSL · New York
- 2024 margin
- Solid D (+64.8) · D 82.4% · R 17.6%
- 2008→2024 swing
- -7.4pp toward R · 2008: 72.2pp · 2024: 64.8pp
- All cycles
- 2024: D+64.8 2020: D+74.5 2016: D+77.2 2012: D+69.6 2008: D+72.2
Not yet ingested
- Civics
- —
Market trends
- HPI YoY
- ▼ -1.26%
- Current HPI
- 414.8385
- Rent YoY
- ▲ 2.71%
- Metro
- New York-Newark-Jersey City, NY-NJ-PA
- State GDP YoY
- ▲ 2.60%
- F500 in state
- 92
Industry mix (Fortune 500 HQ in NY)
| Industry | F500 HQs | Revenue |
|---|---|---|
| Financial Services | 10 | $950B |
|
||
| Consumer Goods | 9 | $162B |
|
||
| Insurance | 4 | $225B |
|
||
| Telecommunications | 2 | $144B |
|
||
| Pharmaceuticals | 2 | $112B |
|
||
| Media / Entertainment | 2 | $69B |
|
||
Price history
-4.0% since first listed2 events — show timeline
- 2026-04-07 Listed $239,000 RLS at REBNY
- 2025-12-04 Price Changed $249,000 RLS at REBNY
Cash-flow waterfall
monthlySold comps — $/sqft
last 12 mo · ≤1 miLoading sold comps…