 🔨 Auction
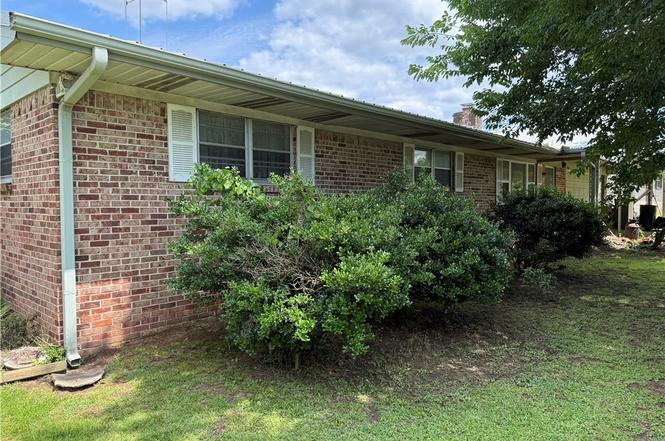
206 Maple Dr · Pocola, OK
Flood risk 1/10 · Minimal
- FEMA flood zone
- X (unshaded)
- Chance of flooding over 30 yrs
- 0.0%
- Est. flood insurance / yr
- $507 – $1,088
Fire risk 5/10 · Moderate
- Est. fire insurance / yr
- $2,463 – $4,575
Heat risk 7/10 · Major
- Hot days now (above 111°F)
- 7 days/yr
- Hot days in 30 yrs
- 20 days/yr
Wind risk 3/10 · Minor
- Chance of severe wind over 30 yrs
- 5.0%
Air-quality risk 2/10 · Minimal
- Unhealthy air days now
- 0 days/yr
- Unhealthy air days in 30 yrs
- 1 days/yr
Risk factors via First Street. Map © Google.
Why this score? — see what drove the F grade
The composite is a weighted blend of 9 inputs, each scored 0–100. Each bar is that input's sub-score; the figure is the points it added to the 100-point composite (weight × sub-score).
- ARV discount +7.5/15.0
- Cash flow +4.5/30.0
- Appreciation +4.3/10.0
- Livability +3.2/5.0
- Rent growth +2.5/5.0
- Condition / age +2.5/5.0
- Schools +1.6/10.0
- 1% rule +0.5/10.0
- DSCR +0.0/10.0
$1
🖨 Deal sheet (PDF) 📄 Offer letter ✓ Due diligence
Listing remarks
Auction 7/23/2026 @ 10 am. This appx 1,476 sf brick home features 3 bedrooms and 2 bathrooms, making it a great choice for a family home or a solid rental property. The home is total electric, has a fireplace in the living area and has new laminate flooring and fresh paint. Outside, you’ll find a 2-car garage plus a carport for extra covered parking. Don’t miss this opportunity to buy a clean, solid home at your price.
Key facts
- Fresh paint
- Carport
- Brick home
Tags
Property features AI
Exterior
- Parking: Attached concrete garage with 2 covered spaces
- Utilities: Public water; Electricity available
- Home design: Single-family house; One story
- Construction: Brick construction; Slab foundation
- Exterior features: Metal roof; Outbuilding; Paved road with public maintenance
Interior
- Kitchen: Dishwasher; Oven
- Flooring: Laminate flooring; Vinyl flooring
- Bathrooms: 2 full bathrooms
- Heating & cooling: Central heating; Central air; Ceiling fan(s)
- Interior features: Ceiling fan(s); Family room fireplace
- Laundry & utility: Electric dryer hookup; Electric water heater
Neighborhood map
What this means for you Summary
Snapshot
- This is a 3-bed/2.0-bath single-family listed at $1.
Deal economics
- At list price, monthly cash flow is $-585 ($-7k/yr) — negative.
- The deal already cash-flows at list — no discount required.
- Meets the 1% rule at list price ($1k rent vs $1).
Location & tenants
- Location reads 64/100 on livability (#179 in OK) — a middle-class / working-renter tenant base. Strengths: crime A+, cost of living A+, housing A; Watch: employment C-, amenities F, commute F.
- Pocola (rural): math 15% / reading 23% proficiency, ranked #188 of 270 in OK (top 70%) — low school quality limits family demand, transient renter base, plan for 1-2y turnover.
- Zoned schools: Pocola Es (math 17% / reading 22%, grade F, #479 of 845 statewide, top 63%, 385 students, 0% FRL); Pocola Ms (math 12% / reading 17%, grade F, #234 of 345 statewide, top 72%, 155 students, 0% FRL); Pocola Hs (math 15% / reading 34%, grade F, #145 of 447 statewide, top 33%, 207 students, 0% FRL) — zoned schools average 0% FRL vs 57% district-wide (57 pts lower); this property's tenant base skews higher-income than the district average.
- Market conditions: 40 active listings in the ZIP; 5 comparable units currently listed for rent nearby; rentals at typical pace (median 15d on market — plan ~3-4 weeks tenant-placement turnaround); 73 units permitted in Le Flore County in 2024 (0 in 5+ unit buildings).
Forward outlook
- Local home prices are declining (-1.4%/yr); year-one equity from $2k of loan paydown is wiped out by about $3k of value loss. Plan a longer hold.
- Le Flore County population projected at -13% by 2050 — secular population decline; favor cash flow + early exit over multi-decade hold.
Negotiation context
- Only 2 days on market — expect competitive offers; lowballing is unlikely to land.
Risks & watch-outs
- Watch-outs: property tax is 343170.0% of price.
- Climate carrying-cost: moderate wildfire risk; extreme-heat days projected 7→20/yr by 2055 (HVAC capex compounding) — expect insurance premiums to compound above CPI over the hold.
Questions for the listing agent
- What do current leases actually rent for vs. the listed asking? Can we see a recent rent roll and the last 12 months of T-12 income?
- Built in 1973 — when were the roof, HVAC, electrical panel, plumbing, and water heater last replaced?
- Property tax is high relative to price — has the assessment been appealed recently, and will the sale trigger a re-assessment?
- Is there a deadline driving the sale (1031 exchange, divorce, estate, relocation)? That informs how much negotiation room exists.
- Schools are F-rated, which usually means shorter tenancies and higher turnover. Who's the typical renter profile here, and what's been the actual vacancy rate?
- The area grade is low — what's the realistic commute time and amenity access for the typical tenant pool here? Any planned neighborhood developments (good or bad) we should know about?
- What's the average days-on-market for RENTAL listings here right now (not sales)? A rising rental-DOM trend means longer vacancies and softer asking-rent achievability than the comps imply.
- What's the recent tenant-quality profile in this submarket — average credit score on applications, eviction rate, late-payment / NSF rate, and stable-employment percentage? A property-management company in the area should have these aggregated.
- How much new for-sale + rental construction is in the pipeline within 1–3 miles? Heavy new supply typically softens prices + rents 12–24 months out; constrained supply supports both.
Investment metrics
- 1% rule
- 0.55% ✗
- Cap rate
- 3.23%
- Cash-on-cash
- -10.95%
- DSCR
- 0.51
- GRM
- 15.1
CMA / ARV
- ARV (on-the-fly)
- $228,780
- Comps found
- 12
Show comp detail 12 sales within ~0.75 mi
| Address | Dist | Beds/Ba | Sqft | Sold | Price | $/sf | Match |
|---|---|---|---|---|---|---|---|
| 8210 Avignon Ln | 0.43mi | 3/2.0 | 1,462 (-1%) | 9mo | $214,900 | $147 | 70 |
| 412 Chateau Dr | 0.57mi | 3/2.0 | 1,474 (-0%) | 16mo | $215,000 | $146 | 60 |
| 8408 Avignon Ln | 0.41mi | 3/2.0 | 1,383 (-6%) | 15mo | $215,000 | $155 | 58 |
| 413 Chateau Dr | 0.59mi | 3/2.0 | 1,411 (-4%) | 11mo | $210,000 | $149 | 56 |
| 615 Windbrook Ct | 0.68mi | 3/2.0 | 1,547 (+5%) | 6mo | $229,500 | $148 | 56 |
| 8104 Avignon Ln | 0.45mi | 3/2.0 | 1,629 (+10%) | 7mo | $225,000 | $138 | 56 |
| 614 Dugan Mill Cir | 0.64mi | 3/2.0 | 1,422 (-4%) | 20mo | $224,900 | $158 | 47 |
| 501 Apple Valley Dr | 0.56mi | 3/2.0 | 1,309 (-11%) | 12mo | $209,999 | $160 | 45 |
| 106 Janet Ln | 0.73mi | 3/2.0 | 1,323 (-10%) | 7mo | $276,000 | $209 | 43 |
| 404 Apple Valley Dr | 0.52mi | 3/2.0 | 1,615 (+9%) | 21mo | $236,500 | $146 | 42 |
| 500 Bordeaux Cir | 0.55mi | 3/2.0 | 1,260 (-15%) | 13mo | $195,000 | $155 | 39 |
| 604 Dugan Mill Cir | 0.62mi | 3/2.0 | 1,333 (-10%) | 19mo | $207,000 | $155 | 39 |
Match score weights: distance 35% · size 25% · config 20% · recency 20%. Top-matched comps best support the ARV.
Projected returns pro-forma
-1.38% appreciation · 3.0% rent growth · sell at horizon
- IRR
- -22.6%
- Equity multiple
- 0.09×
- Total profit
- $-58,364
- Equity at exit
- $51,064
- IRR
- -16.4%
- Equity multiple
- -0.31×
- Total profit
- $-84,033
- Equity at exit
- $50,151
Cash invested: $64,058 (down + closing). Projections, not guarantees.
Landlord ↔ Tenant lean methodology
- Overall (STATE)
- 83 Strongly Landlord-Friendly
- State Oklahoma
- 83 Strongly Landlord-Friendly · R+20
- County
- — inherits STATE
- City
- — inherits STATE
ZIP-level market 74902
- Home prices YoY
- -0.5%
- Active inventory
- 40
Monthly cashflow live
- Estimated rent
- $1,261 high interval (Pro) →
- Mortgage (P&I)
- −$1,200
- Tax est. 1.5%
- −$286 /mo · $3,432/yr
- Insurance
- −$95
- HOA
- −$0
- Vacancy / Maint / Mgmt
- −$265
- Net cashflow
- $-585
Break-even live
Sensitivity live
| Price | -10% $-427 | -5% $-506 | +0% $-585 | +5% $-664 | +10% $-743 |
|---|---|---|---|---|---|
| Rent | -10% $-684 | -5% $-635 | +0% $-585 | +5% $-535 | +10% $-485 |
| Rate | -1.0pp $-470 | -0.5pp $-527 | base $-585 | +0.5pp $-644 | +1.0pp $-704 |
UW: 25.0% down · 7.5% · 30yr · 1.5% tax · 5.0% vac · 8.0% maint · 8.0% mgmt
Financing live
Cash to close
- Down payment
- $57,195
- Closing costs
- $6,863
- Reserves months
- —
- Total cash needed
- —
Loan-product check · same deal, 3 products live
Conventional
25% down · 7.5% · 30yr
- Down + closing
- —
- Monthly P&I
- —
- Monthly cashflow
- —
- DSCR
- —
- Eligible?
- —
Personal DTI + credit; lowest rate.
DSCR
20% down · 8.5% · 30yr
- Down + closing
- —
- Monthly P&I
- —
- Monthly cashflow
- —
- DSCR
- —
- Eligible?
- —
No personal income docs; deal must DSCR.
Hard money
10% down · 12.0% · 12mo
- Down + closing
- —
- Monthly P&I
- —
- Monthly cashflow
- —
- DSCR
- —
- Eligible?
- —
Short-term bridge; refi at stabilization.
Rent comps 5 comps
| Address | Beds | Baths | Sqft | Rent | $/sqft | DOM | Units | Dist |
|---|---|---|---|---|---|---|---|---|
| 7401 Martin Dr Unit 7 Fort Smith, AR | 2.0 | 2.0 | 900 | $995 | $1.11 | 14d | 1 | 0.93mi |
| 700 Hillside Dr Fort Smith, AR | 3.0 | 1.5 | 1168 | $1,400 | $1.20 | 22d | 1 | 1.05mi |
| 1206 Mesa Dr Fort Smith, AR | 3.0 | 2.0 | 1369 | $1,400 | $1.02 | 14d | 1 | 1.05mi |
| 1415 Willowbrook Cir Fort Smith, AR | 3.0 | 2.0 | 1650 | $1,299 | $0.79 | 14d | 1 | 1.39mi |
| 1709 Brooken Hill Dr Fort Smith, AR | 2.0 | 2.0 | 1043 | $1,100 | $1.05 | 14d | 1 | 1.49mi |
Listing history 3 events
-
2026-06-19days on market $1 Active 2 DOM
-
2026-06-17remarks 422-char remark
-
2026-06-17$1 Active 1 DOM
ⓘ Source: listings_history table (triggers on properties + properties_extension) + one-shot
backfill from property_details.listing_events for pre-trigger history.
Climate risk First Street
- Flood 1/10 Low FEMA zone X (unshaded) · 0% chance over 30 yrs
- Wildfire 5/10 Major
- Heat 7/10 Severe 7 d/yr ≥111°F today · 20 d/yr by 30 yrs out
- Wind 3/10 Moderate 5% chance of damaging wind over 30 yrs
- Air quality 2/10 Low 0 unhealthy d/yr today · 1 by 30 yrs out
Nearby sold comps map
Loading sold comps map…
Walkable amenities ~0.75 mi
Loading nearby amenities…
Taxation est. · year 1
- Rental income
- $15,133
- − Mortgage interest
- −$12,815
- − Property taxes
- −$3,432
- − Insurance
- −$1,144
- − Repairs & maintenance
- −$1,211
- − Management
- −$1,211
- − Depreciation
- −$6,655
- Taxable loss
- −$11,335
- Est. tax savings @ 24.0%
- +$2,720
- After-tax cash flow
- $-4,297/yr
For passive investors: Depreciation is non-cash, so a rental often shows a tax loss while cash-flowing — sheltering income. Rental losses are passive: they offset passive income freely, and up to $25,000/yr can offset ordinary (W-2) income if you actively participate and your MAGI is under $100k (phasing out to $0 by $150k); unused losses carry forward. On sale, claimed depreciation is recaptured at up to 25%, and gains may owe capital-gains tax (a 1031 exchange can defer both). Figures are a year-1 estimate at your 24.0% rate — not tax advice; consult a CPA.
Schools (NCES district)
- District
- Pocola
- NCES district ID
- 4024630
- Math proficiency
- 15% ▼ -12.00%
- Reading proficiency
- 23% ▼ -6.00%
- Median HH income
- $38,047
- Composite
- 15.91/100
- National rank
- #9255
- State rank
- #188 of 270 in OK
Livability — Pocola
- Score
- 64/100
- State rank
- #179
- US rank
- #14166
Category grades
Schools grade is shown separately in the Schools card above.
Census & demographics
- Census place
- Pocola, OK
- City population
- 4,359
- Population (ZIP)
- 4,359
Population outlook (Le Flore County) Hauer SSP2
- Today (2025)
- 48,504 people
- By 2030
- 47,474 · -2.1%
- By 2040
- 44,914 · -7.4%
- By 2050
- 42,239 · -12.9%
- By 2075
- 35,071 · -27.7%
- By 2100
- 25,949 · -46.5%
Race, ethnicity, and origin ACS 2023
- Neighborhood character
- Predominantly White (74%)
- Race & ethnicity
- White 74% Two or more races 12% Native American 10% Hispanic / Latino 4% Black 1%
- Common ancestry
- Romanian 3% Lithuanian 3% Slovak 2%
- Foreign-born
- 2% · Canada, Dominican Republic
- Languages at home
- 97% English-only · Spanish 2% Other Indo-European 1%
Political lean MEDSL · Le Flore
- 2024 margin
- Solid R (+64.8) · D 17.0% · R 81.8% · Other 1.3%
- 2008→2024 swing
- -26.1pp toward R · 2008: -38.6pp · 2024: -64.8pp
- All cycles
- 2024: R+64.8 2020: R+63.4 2016: R+58.7 2012: R+41.1 2008: R+38.6
Not yet ingested
- Civics
- —
Market trends
- HPI YoY
- ▼ -1.38%
- Current HPI
- 280.9093
- Rent YoY
- —
- Metro
- —
- State GDP YoY
- ▲ 1.55%
- F500 in state
- 6
Industry mix (Fortune 500 HQ in OK)
| Industry | F500 HQs | Revenue |
|---|---|---|
| Energy | 3 | $48B |
|
||
Property tax history
+3.6%/yrLatest (2025): $487 · +3.0% YoY. Source: county tax records.
Cash-flow waterfall
monthlySold comps — $/sqft
last 12 mo · ≤1 miLoading sold comps…