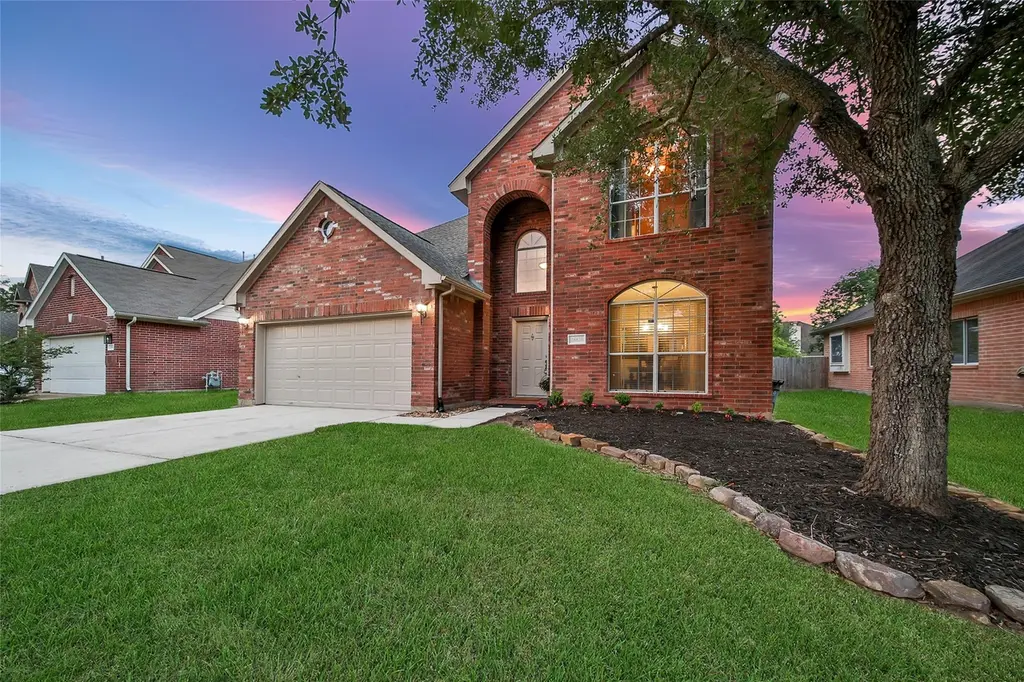
28826 Hidden Cove Dr · The Woodlands, TX
Flood risk 1/10 · Minimal
- FEMA flood zone
- X (unshaded)
- Chance of flooding over 30 yrs
- 0.0%
- Est. flood insurance / yr
- $507 – $1,088
Fire risk 4/10 · Minor
- Est. fire insurance / yr
- $1,222 – $2,270
Heat risk 9/10 · Severe
- Hot days now (above 111°F)
- 7 days/yr
- Hot days in 30 yrs
- 25 days/yr
Wind risk 8/10 · Major
- Chance of severe wind over 30 yrs
- 99.0%
Air-quality risk 2/10 · Minimal
- Unhealthy air days now
- 2 days/yr
- Unhealthy air days in 30 yrs
- 2 days/yr
Risk factors via First Street. Map © Google.
Why this score? — see what drove the D grade
The composite is a weighted blend of 9 inputs, each scored 0–100. Each bar is that input's sub-score; the figure is the points it added to the 100-point composite (weight × sub-score).
- Appreciation +10.0/10.0
- ARV discount +7.7/15.0
- Cash flow +7.2/30.0
- Livability +4.5/5.0
- Schools +3.9/10.0
- Rent growth +2.6/5.0
- Condition / age +2.5/5.0
- 1% rule +2.2/10.0
- DSCR +1.4/10.0
$305,000
🖨 Deal sheet (PDF) 📄 Offer letter ✓ Due diligence
Listing remarks
Discover Hidden Lake Estates. Mins to The Woodlands, 249, TX99. Don't miss this beautifully maintained 2-story, 4 beds, 2.5 baths. Kitchen nestled between dining & family area is designed for both everyday living & entertaining. The primary suite offers dual vanities, garden tub, semi-frameless shower, updated lighting, & WIC. Upstairs, you’ll find a spacious gameroom w/ 3 secondary bedrooms & generous closet space. Enjoy outdoor living year-round under the covered back patio overlooking a spacious backyard shaded by mature trees. Storage is abundant - space under staircase & floored attic storage. Updates include NEW dishwasher, fence, light fixtures, fau
Key facts
- Spacious backyard
- Covered back patio
- New dishwasher
Tags
Property features AI
Finance
- HOA & community: Hidden Lake Estates homeowners association; Annual association fee of $490; Community curbs
Exterior
- Parking: Attached garage; 2 garage spaces; Driveway
- Security: Owned security system; Smoke detectors
- Utilities: Public water
- Home design: Residential property; Faces west; Built in 2007; Slab foundation
- Construction: Brick and cement siding construction; Composition roof
- Exterior features: Back yard fence; Subdivision lot; Concrete road surface
Interior
- Kitchen: Dishwasher; Disposal; Gas oven; Oven; Microwave
- Bedrooms: Primary bedroom (first floor); Bedroom (second floor) — 12x13; Bedroom (second floor) — 13x13; Bedroom (second floor) — 11x13
- Flooring: Carpet; Laminate; Tile
- Bathrooms: 2 full bathrooms; 1 half bathroom
- Heating & cooling: Central heating (gas); Central air (electric)
- Interior features: High ceilings; Kitchen and family room combo; Kitchen and dining combo; Primary bathroom with soaking tub and separate shower; Bath in primary bedroom; Window coverings; Ceiling fans; Gas log fireplace
- Laundry & utility: Washer hookup; Electric dryer hookup; Utility room (first floor)
Neighborhood map
What this means for you Summary
Snapshot
- This is a 4-bed/2.5-bath single-family listed at $305k.
Deal economics
- At list price, monthly cash flow is $-413 ($-5k/yr) — negative.
- To cash-flow at today's rent, offer at most $232k (23.9% below list).
- To meet the 1% rule (rent ≥ 1% of price), the offer needs to be $220k (27.9% below list).
- Recommended offer: $220k (27.9% below list) — sets the bar for 1% rule.
- Cap rate 4.7% vs local median 2.3% in The Woodlands — top-decile yield for the area; either an underpriced asset or a hidden risk that comps aren't pricing in. Stress-test before assuming the spread holds.
Location & tenants
- Location reads 91/100 on livability (#1 in TX, #47 nationally) — a professional / high-income tenant draw. Strengths: amenities A+, commute A+, employment A+; Watch: cost of living D-.
- Magnolia ISD (rural): math 42% / reading 45% proficiency, ranked #247 of 826 in TX (top 30%) — families likely to look elsewhere, expect single-tenant / working-renter base with shorter leases.
- Zoned schools: Cedric C Smith (math 48% / reading 42%, grade D-, #1,133 of 4,322 statewide, top 27%, 724 students, 55% FRL); Bear Branch J H (math 44% / reading 46%, grade D, #479 of 1,662 statewide, top 29%, 1,076 students, 37% FRL); Magnolia H S (math 47% / reading 62%, grade C-, #379 of 1,632 statewide, top 26%, 2,248 students, 31% FRL) — zoned schools at 41% FRL track the district average.
- Market conditions: Rents flat; 1622 active listings in the ZIP; 10 comparable units currently listed for rent nearby; rentals at typical pace (median 15d on market — plan ~3-4 weeks tenant-placement turnaround); high-income renter base; 13,259 units permitted in Montgomery County in 2024 (1,402 in 5+ unit buildings).
Forward outlook
- In year one you build about $33k of equity ($2k loan paydown + $30k appreciation (10.0% local appreciation)).
- Montgomery County population projected at +65% by 2050 — long-run rental-demand tailwind backs the buy-and-hold thesis.
- By year 2, paydown + projected appreciation supports a ~$52k cash-out refi (75% LTV) — recoverable capital for the next deal without selling this one.
Negotiation context
- Only 11 days on market — expect competitive offers; lowballing is unlikely to land.
Risks & watch-outs
- Climate carrying-cost: severe wind risk, 99% chance of damaging wind over 30y; extreme-heat days projected 7→25/yr by 2055 (HVAC capex compounding) — expect insurance premiums to compound above CPI over the hold.
Questions for the listing agent
- What do current leases actually rent for vs. the listed asking? Can we see a recent rent roll and the last 12 months of T-12 income?
- What does the HOA fee cover, when was the last increase, and are there any pending special assessments or reserve-fund shortfalls?
- Is there a deadline driving the sale (1031 exchange, divorce, estate, relocation)? That informs how much negotiation room exists.
- Schools are A-rated — typically a magnet for longer-tenancy family renters. What's the average tenant stay here, and is there a school-zone premium baked into asking?
- The area grade is low — what's the realistic commute time and amenity access for the typical tenant pool here? Any planned neighborhood developments (good or bad) we should know about?
- What's the average days-on-market for RENTAL listings here right now (not sales)? A rising rental-DOM trend means longer vacancies and softer asking-rent achievability than the comps imply.
- What's the recent tenant-quality profile in this submarket — average credit score on applications, eviction rate, late-payment / NSF rate, and stable-employment percentage? A property-management company in the area should have these aggregated.
- How much new for-sale + rental construction is in the pipeline within 1–3 miles? Heavy new supply typically softens prices + rents 12–24 months out; constrained supply supports both.
Investment metrics
- 1% rule
- 0.72% ✗
- Cap rate
- 4.67%
- Cash-on-cash
- -5.81%
- DSCR
- 0.74
- GRM
- 11.6
CMA / ARV
- ARV (on-the-fly)
- $306,045
- Comps found
- 12
Show comp detail 12 sales within ~0.75 mi
| Address | Dist | Beds/Ba | Sqft | Sold | Price | $/sf | Match |
|---|---|---|---|---|---|---|---|
| 28826 Hidden Cove Dr | 0.00mi | 4/2.5 | 2,267 (0%) | 0mo | $305,000 | $135 | 100 |
| 9207 Hidden Ct | 0.17mi | 4/2.5 | 2,280 (+1%) | 5mo | $320,000 | $140 | 87 |
| 9210 E Lakeside Dr | 0.19mi | 4/2.5 | 2,260 (-0%) | 6mo | $285,000 | $126 | 86 |
| 9302 E Lakeside Dr | 0.13mi | 4/2.5 | 2,288 (+1%) | 8mo | $314,999 | $138 | 86 |
| 28918 Hidden Cove Dr | 0.08mi | 4/2.5 | 2,456 (+8%) | 5mo | $325,000 | $132 | 78 |
| 28935 Hidden Cove Dr | 0.14mi | 4/2.5 | 2,455 (+8%) | 3mo | $314,000 | $128 | 77 |
| 29019 Hidden Lake Ct | 0.15mi | 3/2.5 (-1) | 2,043 (-10%) | 2mo | $269,900 | $132 | 70 |
| 9215 Water Front Ct | 0.26mi | 4/2.5 | 2,464 (+9%) | 4mo | $315,000 | $128 | 70 |
| 28823 Champion Oaks Dr | 0.10mi | 4/2.5 | 2,531 (+12%) | 8mo | $355,000 | $140 | 69 |
| 28402 Ascot Farms Rd | 0.53mi | 4/2.5 | 2,461 (+9%) | 3mo | $799,995 | $325 | 58 |
| 28622 Champion Oaks Dr | 0.22mi | 3/2.0 (-1) | 1,973 (-13%) | 7mo | $265,000 | $134 | 55 |
| 28434 Champion Oaks Dr | 0.39mi | 3/2.0 (-1) | 1,967 (-13%) | 13mo | $365,000 | $186 | 42 |
Match score weights: distance 35% · size 25% · config 20% · recency 20%. Top-matched comps best support the ARV.
Projected returns pro-forma
10.0% appreciation · 0.32% rent growth · sell at horizon
- IRR
- 19.4%
- Equity multiple
- 2.57×
- Total profit
- $134,061
- Equity at exit
- $274,768
- IRR
- 17.4%
- Equity multiple
- 5.74×
- Total profit
- $405,132
- Equity at exit
- $592,548
Cash invested: $85,400 (down + closing). Projections, not guarantees.
Landlord ↔ Tenant lean methodology
- Overall (STATE)
- 87 Strongly Landlord-Friendly
- State Texas
- 87 Strongly Landlord-Friendly · R+5
- County
- — inherits STATE
- City
- — inherits STATE
ZIP-level market 77354
- Home prices YoY
- 2.4%
- Rents YoY
- 0.3%
- Active inventory
- 1622
- Price-to-rent
- 11.6×
Monthly cashflow live
- Estimated rent
- $2,199 high interval (Pro) →
- Mortgage (P&I)
- −$1,599
- Tax from tax record
- −$383 /mo · $4,599/yr
- Insurance
- −$127
- HOA
- −$41
- Vacancy / Maint / Mgmt
- −$462
- Net cashflow
- $-413
Break-even live
Sensitivity live
| Price | -10% $-241 | -5% $-327 | +0% $-413 | +5% $-500 | +10% $-586 |
|---|---|---|---|---|---|
| Rent | -10% $-587 | -5% $-500 | +0% $-413 | +5% $-327 | +10% $-240 |
| Rate | -1.0pp $-260 | -0.5pp $-336 | base $-413 | +0.5pp $-493 | +1.0pp $-573 |
UW: 25.0% down · 7.5% · 30yr · 1.5% tax · 5.0% vac · 8.0% maint · 8.0% mgmt
Financing live
Cash to close
- Down payment
- $76,250
- Closing costs
- $9,150
- Reserves months
- —
- Total cash needed
- —
Loan-product check · same deal, 3 products live
Conventional
25% down · 7.5% · 30yr
- Down + closing
- —
- Monthly P&I
- —
- Monthly cashflow
- —
- DSCR
- —
- Eligible?
- —
Personal DTI + credit; lowest rate.
DSCR
20% down · 8.5% · 30yr
- Down + closing
- —
- Monthly P&I
- —
- Monthly cashflow
- —
- DSCR
- —
- Eligible?
- —
No personal income docs; deal must DSCR.
Hard money
10% down · 12.0% · 12mo
- Down + closing
- —
- Monthly P&I
- —
- Monthly cashflow
- —
- DSCR
- —
- Eligible?
- —
Short-term bridge; refi at stabilization.
Rent comps 10 comps
| Address | Beds | Baths | Sqft | Rent | $/sqft | DOM | Units | Dist |
|---|---|---|---|---|---|---|---|---|
| 28911 Hidden Lk W Magnolia, TX | 4.0 | 2.5 | 2279 | $1,846 | $0.81 | 23d | 1 | 0.09mi |
| 28618 Hidden Cove Dr Magnolia, TX | 4.0 | 2.5 | 2430 | $2,046 | $0.84 | 14d | 1 | 0.21mi |
| 28603 Hidden Lk W Magnolia, TX | 5.0 | 2.5 | 2478 | $2,446 | $0.99 | 26d | 1 | 0.26mi |
| 146 Black Swan Pl Magnolia, TX | 4.0 | 3.0 | 2535 | $2,495 | $0.98 | 23d | 1 | 0.89mi |
| 29980 Farm to Market Road 2978 Unit 3228 Magnolia, TX | 3.0 | 2.0 | 1578 | $2,320 | $1.47 | 0d | 1 | 1.05mi |
| 139 Hawkhurst Cir Magnolia, TX | 4.0 | 3.0 | 2563 | $2,950 | $1.15 | 26d | 1 | 1.15mi |
| 29980 Farm to Market Road 2978 Unit 3047 Magnolia, TX | 3.0 | 2.0 | 1578 | $2,371 | $1.50 | 12d | 1 | 1.18mi |
| 29980 Farm to Market Road 2978 Unit 30013 Magnolia, TX | 3.0 | 2.0 | 1578 | $2,360 | $1.50 | 12d | 1 | 1.19mi |
| 30000 FM 2978 Rd Magnolia, TX | 1.0–4.0 | 1.0–4.0 | 1175 | $2,168 | $1.84 | 0d | 47 | 1.22mi |
| 9829 Glen Brook Ln Magnolia, TX | 4.0 | 2.0 | 1637 | $1,999 | $1.22 | 4d | 1 | 1.48mi |
HOA detail
- Monthly dues
- $41 · $492/yr
Listing history 5 events
-
2026-05-22status Pending
-
2026-05-22historical Active Under Contract
-
2026-05-14status Pending
-
2026-05-14price $305,000
-
2026-05-11$299,990 Active
ⓘ Source: listings_history table (triggers on properties + properties_extension) + one-shot
backfill from property_details.listing_events for pre-trigger history.
Tax reassessment forecast TX · Resets to sale price
- Current annual tax
- $4,599 · $383/mo
- Projected year-2 tax
- $5,582 · $465/mo
- Expected delta
- +$983/yr (+$82/mo · 21.4%)
ⓘ Screening estimate from a state-policy table — verify with the county assessor before closing.
Climate risk First Street
- Flood 1/10 Low FEMA zone X (unshaded) · 0% chance over 30 yrs
- Wildfire 4/10 Moderate
- Heat 9/10 Extreme 7 d/yr ≥111°F today · 25 d/yr by 30 yrs out
- Wind 8/10 Severe 99% chance of damaging wind over 30 yrs
- Air quality 2/10 Low 2 unhealthy d/yr today · 2 by 30 yrs out
Nearby sold comps map
Loading sold comps map…
Walkable amenities ~0.75 mi
Loading nearby amenities…
Taxation est. · year 1
- Rental income
- $26,389
- − Mortgage interest
- −$17,085
- − Property taxes
- −$4,599
- − Insurance
- −$1,525
- − Repairs & maintenance
- −$2,111
- − Management
- −$2,111
- − HOA
- −$492
- − Depreciation
- −$8,873
- Taxable loss
- −$10,406
- Est. tax savings @ 24.0%
- +$2,498
- After-tax cash flow
- $-2,464/yr
For passive investors: Depreciation is non-cash, so a rental often shows a tax loss while cash-flowing — sheltering income. Rental losses are passive: they offset passive income freely, and up to $25,000/yr can offset ordinary (W-2) income if you actively participate and your MAGI is under $100k (phasing out to $0 by $150k); unused losses carry forward. On sale, claimed depreciation is recaptured at up to 25%, and gains may owe capital-gains tax (a 1031 exchange can defer both). Figures are a year-1 estimate at your 24.0% rate — not tax advice; consult a CPA.
Schools (NCES district)
- District
- Magnolia ISD
- NCES district ID
- 4828740
- Math proficiency
- 42% ▼ -7.00%
- Reading proficiency
- 45% ▼ -4.00%
- Median HH income
- $71,692
- Composite
- 39.46/100
- National rank
- #3958
- State rank
- #247 of 826 in TX
Livability — The Woodlands
- Score
- 91/100
- State rank
- #1
- US rank
- #47
Category grades
Schools grade is shown separately in the Schools card above.
Census & demographics
- County
- Montgomery County · 663,713 people
- Metro
- Houston-The Woodlands-Sugar Land, TX
- Population (ZIP)
- 44,900
- Household income
- $112,504
- Rent vs Own
- Severe rent burden
- 586.0
Population outlook (Montgomery County) Hauer SSP2
- Today (2025)
- 713,896 people
- By 2030
- 805,263 · +12.8%
- By 2040
- 992,708 · +39.1%
- By 2050
- 1,179,590 · +65.2%
- By 2075
- 1,628,084 · +128.1%
- By 2100
- 1,937,880 · +171.5%
Race, ethnicity, and origin ACS 2023
- Neighborhood character
- Predominantly White (66%)
- Race & ethnicity
- White 66% Hispanic / Latino 25% Two or more races 18% Black 3% Asian 1%
- Hispanic origin (detail)
- Mexican 14% Puerto Rican 1%
- Common ancestry
- Lithuanian 4% Slovak 2% Italian 2%
- Foreign-born
- 11% · Canada, Vietnam
- Languages at home
- 83% English-only · Spanish 15% Other Indo-European 1% German/W. Germanic 1%
Political lean MEDSL · Montgomery
- 2024 margin
- Solid R (+45.5) · D 26.8% · R 72.3%
- 2008→2024 swing
- +7.2pp toward D · 2008: -52.7pp · 2024: -45.5pp
- All cycles
- 2024: R+45.5 2020: R+43.8 2016: R+51.4 2012: R+60.7 2008: R+52.7
Not yet ingested
- Civics
- —
Market trends
- HPI YoY
- ▲ 12.09%
- Current HPI
- 512.87
- Rent YoY
- ▲ 0.32%
- Metro
- Houston-The Woodlands-Sugar Land, TX
- State GDP YoY
- ▲ 3.95%
- F500 in state
- 110
Industry mix (Fortune 500 HQ in TX)
| Industry | F500 HQs | Revenue |
|---|---|---|
| Energy | 16 | $1,198B |
|
||
| Technology | 5 | $198B |
|
||
| Engineering / Construction | 4 | $72B |
|
||
| Energy Services | 3 | $60B |
|
||
| Utilities | 3 | $41B |
|
||
| Healthcare | 2 | $330B |
|
||
Price history
+1.7% since first listed5 events — show timeline
- 2026-05-22 Pending — HARMLS
- 2026-05-22 Contingent — HARMLS
- 2026-05-14 Pending — HARMLS
- 2026-05-14 Price Changed $305,000 HARMLS
- 2026-05-11 Listed $299,990 HARMLS
Property tax history
+3.6%/yrLatest (2025): $4,599 · -0.8% YoY. Source: county tax records.
Cash-flow waterfall
monthlySold comps — $/sqft
last 12 mo · ≤1 miLoading sold comps…