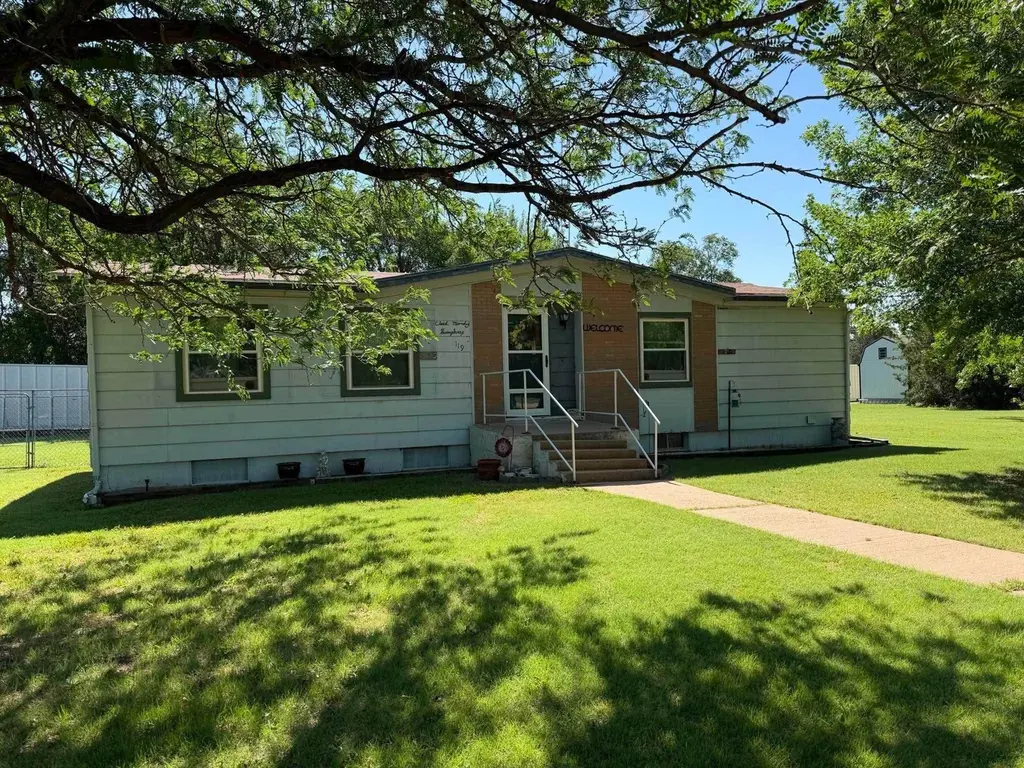
119 N Locust St · Offerle, KS
Flood risk 1/10 · Minimal
- FEMA flood zone
- X (unshaded)
- Chance of flooding over 30 yrs
- 0.0%
- Est. flood insurance / yr
- $473 – $860
Fire risk 4/10 · Minor
- Est. fire insurance / yr
- $1,154 – $2,142
Heat risk 5/10 · Moderate
- Hot days now (above 104°F)
- 7 days/yr
- Hot days in 30 yrs
- 17 days/yr
Wind risk 2/10 · Minimal
- Chance of severe wind over 30 yrs
- —
Air-quality risk 2/10 · Minimal
- Unhealthy air days now
- 0 days/yr
- Unhealthy air days in 30 yrs
- 1 days/yr
Risk factors via First Street. Map © Google.
Why this score? — see what drove the B+ grade
The composite is a weighted blend of 9 inputs, each scored 0–100. Each bar is that input's sub-score; the figure is the points it added to the 100-point composite (weight × sub-score).
- Cash flow +30.0/30.0
- 1% rule +10.0/10.0
- DSCR +10.0/10.0
- ARV discount +7.5/15.0
- Appreciation +7.1/10.0
- Livability +3.2/5.0
- Schools +2.8/10.0
- Rent growth +2.5/5.0
- Condition / age +2.5/5.0
$68,000
🖨 Deal sheet 📄 Offer letter ✓ Due diligence
Key facts
- 0.52 acre lot
- Built 1975
- Listed 5 days
Property features AI
Exterior
- Utilities: Public water; Public sewer
- Home design: Manufactured residential home
- Construction: Concrete basement
- Exterior features: Lot approximately 0.52 acres (150 x 150); Zoned NC.1 / R-1
Interior
- Bedrooms: 3 main-level bedrooms
- Heating & cooling: Window unit cooling
- Interior features: Window coverings; Wood-burning fireplace; Has basement with concrete floor
Neighborhood map
What this means for you Summary
Snapshot
- This is a 3-bed/2.0-bath single-family listed at $68k.
Deal economics
- At list price, monthly cash flow is $390 ($5k/yr) — positive.
- The deal already cash-flows at list — no discount required.
- Meets the 1% rule at list price ($1k rent vs $68k).
Location & tenants
- Location reads 64/100 on livability (#319 in KS) — a middle-class / working-renter tenant base. Strengths: cost of living A+, housing A+; Watch: schools C-, health & safety C-, employment D+.
- Kinsley-Offerle (rural): math 30% / reading 30% proficiency, ranked #172 of 280 in KS (top 61%) — families likely to look elsewhere, expect single-tenant / working-renter base with shorter leases.
- Market conditions: 2 active listings in the ZIP.
Forward outlook
- In year one you build about $3k of equity ($470 loan paydown + $3k appreciation (4.1% local appreciation)).
- Edwards County population projected to shrink 6% by 2050 — rents likely to lag national; underwrite the cash flow, not the appreciation.
- At projected returns (4.1% appreciation + 3.0% rent growth), your $19k cash investment doubles in ~3 years — after that, you're playing with house money.
- By year 10, paydown + projected appreciation supports a ~$32k cash-out refi (75% LTV) — recoverable capital for the next deal without selling this one.
Negotiation context
- Only 5 days on market — expect competitive offers; lowballing is unlikely to land.
- Current owner paid $45k; list at $68k implies a 51% gain — meaningful room to come down on a strong offer.
Risks & watch-outs
- Climate carrying-cost: extreme-heat days projected 7→17/yr by 2055 (HVAC capex compounding) — expect insurance premiums to compound above CPI over the hold.
Questions for the listing agent
- Built in 1975 — when were the roof, HVAC, electrical panel, plumbing, and water heater last replaced?
- Is there a deadline driving the sale (1031 exchange, divorce, estate, relocation)? That informs how much negotiation room exists.
- Crime grade is F in this area — have there been break-ins, vandalism, or insurance claims at this property in the last 3 years? What carrier currently insures it and at what premium?
- What's the average days-on-market for RENTAL listings here right now (not sales)? A rising rental-DOM trend means longer vacancies and softer asking-rent achievability than the comps imply.
- What's the recent tenant-quality profile in this submarket — average credit score on applications, eviction rate, late-payment / NSF rate, and stable-employment percentage? A property-management company in the area should have these aggregated.
- How much new for-sale + rental construction is in the pipeline within 1–3 miles? Heavy new supply typically softens prices + rents 12–24 months out; constrained supply supports both.
Investment metrics
- 1% rule
- 1.60% ✓
- Cap rate
- 13.17%
- Cash-on-cash
- 24.58%
- DSCR
- 2.09
- GRM
- 5.2
CMA / ARV
No comps found within radius.
Projected returns pro-forma
4.12% appreciation · 3.0% rent growth · sell at horizon
- IRR
- 32.7%
- Equity multiple
- 2.95×
- Total profit
- $37,154
- Equity at exit
- $34,948
- IRR
- 32.0%
- Equity multiple
- 5.87×
- Total profit
- $92,653
- Equity at exit
- $57,539
Cash invested: $19,040 (down + closing). Projections, not guarantees.
Landlord ↔ Tenant lean methodology
- Overall (STATE)
- 83 Strongly Landlord-Friendly
- State Kansas
- 83 Strongly Landlord-Friendly · R+10
- County
- — inherits STATE
- City
- — inherits STATE
ZIP-level market 67563
- Home prices YoY
- 2.2%
- Active inventory
- 2
- Price-to-rent
- 5.2×
Monthly cashflow live
- Estimated rent
- $1,088 medium interval (Pro) →
- Mortgage (P&I)
- −$357
- Tax est. 1.5%
- −$85 /mo · $1,020/yr
- Insurance
- −$28
- HOA
- −$0
- Vacancy / Maint / Mgmt
- −$229
- Net cashflow
- $390
Break-even live
UW: 25.0% down · 7.5% · 30yr · 1.5% tax · 5.0% vac · 8.0% maint · 8.0% mgmt
Financing live
Cash to close
- Down payment
- $17,000
- Closing costs
- $2,040
- Reserves months
- —
- Total cash needed
- —
Loan-product check · same deal, 3 products live
Conventional
25% down · 7.5% · 30yr
- Down + closing
- —
- Monthly P&I
- —
- Monthly cashflow
- —
- DSCR
- —
- Eligible?
- —
Personal DTI + credit; lowest rate.
DSCR
20% down · 8.5% · 30yr
- Down + closing
- —
- Monthly P&I
- —
- Monthly cashflow
- —
- DSCR
- —
- Eligible?
- —
No personal income docs; deal must DSCR.
Hard money
10% down · 12.0% · 12mo
- Down + closing
- —
- Monthly P&I
- —
- Monthly cashflow
- —
- DSCR
- —
- Eligible?
- —
Short-term bridge; refi at stabilization.
Listing history 5 events
-
2026-06-18days on market $68,000 Active 5 DOM
-
2026-06-17days on market $68,000 Active 4 DOM
-
2026-06-16days on market $68,000 Active 3 DOM
-
2026-06-15days on market $68,000 Active 2 DOM
-
2026-06-13$68,000 Active 1 DOM
ⓘ Source: listings_history table (triggers on properties + properties_extension) + one-shot
backfill from property_details.listing_events for pre-trigger history.
Climate risk First Street
- Flood 1/10 Low FEMA zone X (unshaded) · 0% chance over 30 yrs
- Wildfire 4/10 Moderate
- Heat 5/10 Major 7 d/yr ≥104°F today · 17 d/yr by 30 yrs out
- Wind 2/10 Low
- Air quality 2/10 Low 0 unhealthy d/yr today · 1 by 30 yrs out
Nearby sold comps map
Loading sold comps map…
Walkable amenities ~0.75 mi
Loading nearby amenities…
Taxation est. · year 1
- Rental income
- $13,062
- − Mortgage interest
- −$3,809
- − Property taxes
- −$1,020
- − Insurance
- −$340
- − Repairs & maintenance
- −$1,045
- − Management
- −$1,045
- − Depreciation
- −$1,978
- Taxable income
- $3,824
- Est. tax owed @ 24.0%
- −$918
- After-tax cash flow
- $3,762/yr
For passive investors: Depreciation is non-cash, so a rental often shows a tax loss while cash-flowing — sheltering income. Rental losses are passive: they offset passive income freely, and up to $25,000/yr can offset ordinary (W-2) income if you actively participate and your MAGI is under $100k (phasing out to $0 by $150k); unused losses carry forward. On sale, claimed depreciation is recaptured at up to 25%, and gains may owe capital-gains tax (a 1031 exchange can defer both). Figures are a year-1 estimate at your 24.0% rate — not tax advice; consult a CPA.
Schools (NCES district)
- District
- Kinsley-Offerle
- NCES district ID
- 2008100
- Math proficiency
- 30% ▬ 0.00%
- Reading proficiency
- 30% ▬ 0.00%
- Median HH income
- $43,157
- Composite
- 28.38/100
- National rank
- #12126
- State rank
- #172 of 280 in KS
Livability — Offerle
- Score
- 64/100
- State rank
- #319
- US rank
- #14722
Category grades
Schools grade is shown separately in the Schools card above.
Census & demographics
- Census place
- Offerle, KS
- Population (ZIP)
- 378
Population outlook (Edwards County) Hauer SSP2
- Today (2025)
- 2,909 people
- By 2030
- 2,871 · -1.3%
- By 2040
- 2,800 · -3.7%
- By 2050
- 2,738 · -5.9%
- By 2075
- 2,702 · -7.1%
- By 2100
- 2,512 · -13.6%
Race, ethnicity, and origin ACS 2023
- Neighborhood character
- Predominantly White (79%)
- Race & ethnicity
- White 79% Hispanic / Latino 15% Two or more races 7% Asian 2%
- Hispanic origin (detail)
- Mexican 15%
- Common ancestry
- Lithuanian 3% Slovak 2% Danish 1%
- Foreign-born
- 3% · Canada
- Languages at home
- 91% English-only · Spanish 7% Tagalog/Filipino 2%
Political lean MEDSL · Edwards
- 2024 margin
- Solid R (+65.3) · D 16.8% · R 82.1% · Other 1.1%
- 2008→2024 swing
- -16.5pp toward R · 2008: -48.8pp · 2024: -65.3pp
- All cycles
- 2024: R+65.3 2020: R+60.9 2016: R+63.1 2012: R+55.5 2008: R+48.8
Not yet ingested
- Civics
- —
Market trends
- HPI YoY
- ▲ 4.12%
- Current HPI
- 187.7952
- Rent YoY
- —
- Metro
- —
- State GDP YoY
- —
- F500 in state
- 0
Price history
+51.1% since first listed5 events — show timeline
- 2026-06-12 Listed $68,000 Hays MLS
- 2003-04-01 Sold (Public Records) — Public Records
- 2003-04-01 Sold (Public Records) — Public Records
- 2000-06-01 Sold (Public Records) $45,000 Public Records
- 2000-06-01 Sold (Public Records) $45,000 Public Records
Cash-flow waterfall
monthlySold comps — $/sqft
last 12 mo · ≤1 miLoading sold comps…