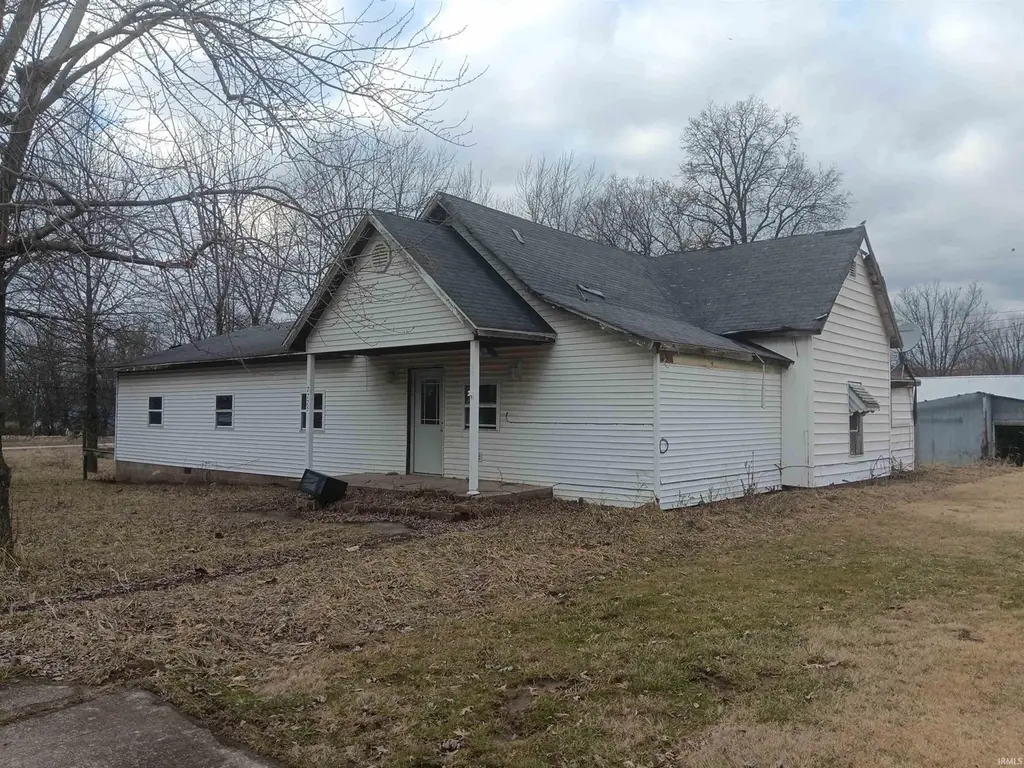
7775 E Church St · Dugger, IN
Flood risk 1/10 · Minimal
- FEMA flood zone
- —
- Chance of flooding over 30 yrs
- 0.0%
- Est. flood insurance / yr
- —
Fire risk 2/10 · Minimal
- Est. fire insurance / yr
- $717 – $1,331
Heat risk 4/10 · Minor
- Hot days now (above 104°F)
- 7 days/yr
- Hot days in 30 yrs
- 19 days/yr
Wind risk 2/10 · Minimal
- Chance of severe wind over 30 yrs
- 2.0%
Air-quality risk 2/10 · Minimal
- Unhealthy air days now
- 1 days/yr
- Unhealthy air days in 30 yrs
- 2 days/yr
Risk factors via First Street. Map © Google.
Why this score? — see what drove the B+ grade
The composite is a weighted blend of 9 inputs, each scored 0–100. Each bar is that input's sub-score; the figure is the points it added to the 100-point composite (weight × sub-score).
- Cash flow +30.0/30.0
- 1% rule +10.0/10.0
- DSCR +10.0/10.0
- Appreciation +7.8/10.0
- ARV discount +7.5/15.0
- Livability +3.0/5.0
- Schools +2.7/10.0
- Rent growth +2.5/5.0
- Condition / age +2.5/5.0
$44,149
🖨 Deal sheet (PDF) 📄 Offer letter ✓ Due diligence
Listing remarks MLS
240 x 129 - Almost 1 Acre! Over 2,000 Sq Ft Home with Large Rooms - All on 1 Level Priced to Sell - Finish as You Desire! Has replacement windows! Vaulted Ceilings! Concrete Floor, Covered Front Porch Partial Basement Outbuilding - 22 x 50/3 Bay 200 Amp Breaker Box Gas Meter on site - Electric wired for Electric Stove
Key facts
- Covered front porch
- Partial basement
- Almost 1 acre
Tags
Neighborhood map
What this means for you Summary
Snapshot
- This is a 5-bed/1.0-bath single-family listed at $44k.
Deal economics
- At list price, monthly cash flow is $693 ($8k/yr) — positive.
- The deal already cash-flows at list — no discount required.
- Meets the 1% rule at list price ($1k rent vs $44k).
- Recommended offer: $39k (12.0% below list) — sets the bar for market timing.
Location & tenants
- Location reads 60/100 on livability (#530 in IN) — a middle-class / working-renter tenant base. Strengths: cost of living A+, housing A+; Watch: crime C-, employment D, amenities F.
- Northeast School Corporation (rural): math 29% / reading 34% proficiency, ranked #228 of 301 in IN (top 76%) — families likely to look elsewhere, expect single-tenant / working-renter base with shorter leases.
- Zoned schools: Northeast East Elementary School (math 52% / reading 42%, grade D-, #325 of 994 statewide, top 36%, 168 students, 68% FRL); North Central Jr/Sr High School (math 12% / reading 32%, grade F, #343 of 369 statewide, top 93%, 374 students, 55% FRL) — zoned schools average 62% FRL vs 44% district-wide (18 pts higher); higher-poverty schools than district average — tighter screening recommended.
- Market conditions: 6 active listings in the ZIP; 4 units permitted in Sullivan County in 2024 (0 in 5+ unit buildings).
Forward outlook
- In year one you build about $3k of equity ($305 loan paydown + $2k appreciation (5.6% local appreciation)).
- Sullivan County population projected at -12% by 2050 — secular population decline; favor cash flow + early exit over multi-decade hold.
- At projected returns (5.6% appreciation + 3.0% rent growth), your $12k cash investment doubles in ~2 years — after that, you're playing with house money.
Negotiation context
- It's been on market 373 days — a 12% lower offer ($39k) is reasonable based on typical stale-listing flexibility.
- 6 sale attempts since 2y ago; this cycle's ask has dropped $3k (6%) from the opening price — seller is motivated, your offer sets the floor, not the list.
- Current owner paid $15k; list at $44k implies a 194% gain — meaningful room to come down on a strong offer.
Risks & watch-outs
- Watch-outs: property tax is 3.5% of price; built in 1918 — expect roof / HVAC / electrical / plumbing capex.
Questions for the listing agent
- It's been on market 373 days. Have you received any prior offers? Is the seller open to a 12% concession, seller financing, or rate buy-down credit?
- Built in 1918 — when were the roof, HVAC, electrical panel, plumbing, and water heater last replaced?
- Property tax is high relative to price — has the assessment been appealed recently, and will the sale trigger a re-assessment?
- Why hasn't it sold? Are there any deal-killer items the seller is aware of (foundation, flood, title, zoning, code violations)?
- Is there a deadline driving the sale (1031 exchange, divorce, estate, relocation)? That informs how much negotiation room exists.
- Schools are D-rated, which usually means shorter tenancies and higher turnover. Who's the typical renter profile here, and what's been the actual vacancy rate?
- What's the average days-on-market for RENTAL listings here right now (not sales)? A rising rental-DOM trend means longer vacancies and softer asking-rent achievability than the comps imply.
- What's the recent tenant-quality profile in this submarket — average credit score on applications, eviction rate, late-payment / NSF rate, and stable-employment percentage? A property-management company in the area should have these aggregated.
- How much new for-sale + rental construction is in the pipeline within 1–3 miles? Heavy new supply typically softens prices + rents 12–24 months out; constrained supply supports both.
Investment metrics
- 1% rule
- 3.07% ✓
- Cap rate
- 25.13%
- Cash-on-cash
- 67.26%
- DSCR
- 3.99
- GRM
- 2.7
CMA / ARV
- ARV (median comp)
- $260,000
- List price
- $44,149
- Delta
- -83.02%
- Verdict
- UNDERPRICED
- Comps
- 1 within 2.0 mi
Show comp detail 1 sale within ~0.75 mi
| Address | Dist | Beds/Ba | Sqft | Sold | Price | $/sf | Match |
|---|---|---|---|---|---|---|---|
| 8444 E Monroe St | 0.72mi | 4/2.0 (-1) | 1,848 (-8%) | 3mo | $260,000 | $141 | 42 |
Match score weights: distance 35% · size 25% · config 20% · recency 20%. Top-matched comps best support the ARV.
Projected returns pro-forma
5.57% appreciation · 3.0% rent growth · sell at horizon
- IRR
- 74.4%
- Equity multiple
- 5.51×
- Total profit
- $55,812
- Equity at exit
- $26,551
- IRR
- 71.9%
- Equity multiple
- 11.52×
- Total profit
- $130,074
- Equity at exit
- $47,142
Cash invested: $12,362 (down + closing). Projections, not guarantees.
Landlord ↔ Tenant lean methodology
- Overall (STATE)
- 90 Strongly Landlord-Friendly
- State Indiana
- 90 Strongly Landlord-Friendly · R+11
- County
- — inherits STATE
- City
- — inherits STATE
ZIP-level market 47848
- Home prices YoY
- 3.2%
- Active inventory
- 6
- Price-to-rent
- 2.7×
Monthly cashflow live
- Estimated rent
- $1,357 medium interval (Pro) →
- Mortgage (P&I)
- −$232
- Tax from tax record
- −$129 /mo · $1,552/yr
- Insurance
- −$18
- HOA
- −$0
- Vacancy / Maint / Mgmt
- −$285
- Net cashflow
- $693
Break-even live
Sensitivity live
| Price | -10% $718 | -5% $705 | +0% $693 | +5% $680 | +10% $668 |
|---|---|---|---|---|---|
| Rent | -10% $586 | -5% $639 | +0% $693 | +5% $746 | +10% $800 |
| Rate | -1.0pp $715 | -0.5pp $704 | base $693 | +0.5pp $681 | +1.0pp $670 |
UW: 25.0% down · 7.5% · 30yr · 1.5% tax · 5.0% vac · 8.0% maint · 8.0% mgmt
Financing live
Cash to close
- Down payment
- $11,037
- Closing costs
- $1,324
- Reserves months
- —
- Total cash needed
- —
Loan-product check · same deal, 3 products live
Conventional
25% down · 7.5% · 30yr
- Down + closing
- —
- Monthly P&I
- —
- Monthly cashflow
- —
- DSCR
- —
- Eligible?
- —
Personal DTI + credit; lowest rate.
DSCR
20% down · 8.5% · 30yr
- Down + closing
- —
- Monthly P&I
- —
- Monthly cashflow
- —
- DSCR
- —
- Eligible?
- —
No personal income docs; deal must DSCR.
Hard money
10% down · 12.0% · 12mo
- Down + closing
- —
- Monthly P&I
- —
- Monthly cashflow
- —
- DSCR
- —
- Eligible?
- —
Short-term bridge; refi at stabilization.
Listing history 28 events
-
2026-06-21days on market $44,149 Active 373 DOM
-
2026-06-19days on market $44,149 Active 371 DOM
-
2026-06-18days on market $44,149 Active 370 DOM
-
2026-06-17days on market $44,149 Active 369 DOM
-
2026-06-16days on market $44,149 Active 368 DOM
-
2026-06-15days on market $44,149 Active 367 DOM
-
2026-06-14days on market $44,149 Active 365 DOM
-
2026-06-13days on market $44,149 Active 364 DOM
-
2026-06-10days on market $44,149 Active 362 DOM
-
2026-06-09days on market $44,149 Active 361 DOM
-
2026-06-08days on market $44,149 Active 360 DOM
-
2026-06-07days on market $44,149 Active 359 DOM
-
2026-06-05days on market $44,149 Active 356 DOM
-
2026-06-02days on market $44,149 Active 354 DOM
-
2026-06-01days on market $44,149 Active 353 DOM
-
2026-05-31days on market $44,149 Active 352 DOM
-
2026-05-30days on market $44,149 Active 351 DOM
-
2026-04-13status Active 319-char remark
Show marketing remark (319 chars)
240 x 129 - Almost 1 Acre! Over 2,000 Sq Ft Home with Large Rooms - All on 1 Level Priced to Sell - Finish as You Desire! Has replacement windows! Vaulted Ceilings! Concrete Floor, Covered Front Porch Partial Basement Outbuilding - 22 x 50/3 Bay 200 Amp Breaker Box Gas Meter on site - Electric wired for Electric Stove
-
2025-12-22price $44,149 319-char remark
Show marketing remark (319 chars)
240 x 129 - Almost 1 Acre! Over 2,000 Sq Ft Home with Large Rooms - All on 1 Level Priced to Sell - Finish as You Desire! Has replacement windows! Vaulted Ceilings! Concrete Floor, Covered Front Porch Partial Basement Outbuilding - 22 x 50/3 Bay 200 Amp Breaker Box Gas Meter on site - Electric wired for Electric Stove
-
2025-12-11status Active 319-char remark
Show marketing remark (319 chars)
240 x 129 - Almost 1 Acre! Over 2,000 Sq Ft Home with Large Rooms - All on 1 Level Priced to Sell - Finish as You Desire! Has replacement windows! Vaulted Ceilings! Concrete Floor, Covered Front Porch Partial Basement Outbuilding - 22 x 50/3 Bay 200 Amp Breaker Box Gas Meter on site - Electric wired for Electric Stove
-
2025-12-04status Pending 319-char remark
Show marketing remark (319 chars)
240 x 129 - Almost 1 Acre! Over 2,000 Sq Ft Home with Large Rooms - All on 1 Level Priced to Sell - Finish as You Desire! Has replacement windows! Vaulted Ceilings! Concrete Floor, Covered Front Porch Partial Basement Outbuilding - 22 x 50/3 Bay 200 Amp Breaker Box Gas Meter on site - Electric wired for Electric Stove
-
2025-09-05price $44,650 319-char remark
Show marketing remark (319 chars)
240 x 129 - Almost 1 Acre! Over 2,000 Sq Ft Home with Large Rooms - All on 1 Level Priced to Sell - Finish as You Desire! Has replacement windows! Vaulted Ceilings! Concrete Floor, Covered Front Porch Partial Basement Outbuilding - 22 x 50/3 Bay 200 Amp Breaker Box Gas Meter on site - Electric wired for Electric Stove
-
2025-02-03$47,000 Active 319-char remark
Show marketing remark (319 chars)
240 x 129 - Almost 1 Acre! Over 2,000 Sq Ft Home with Large Rooms - All on 1 Level Priced to Sell - Finish as You Desire! Has replacement windows! Vaulted Ceilings! Concrete Floor, Covered Front Porch Partial Basement Outbuilding - 22 x 50/3 Bay 200 Amp Breaker Box Gas Meter on site - Electric wired for Electric Stove
-
2024-12-05historical
-
2024-02-13$39,000 Active
-
2024-02-13$39,000 Active
-
2024-02-12$39,000 Active
-
2000-11-10soldstatus $15,000
ⓘ Source: listings_history table (triggers on properties + properties_extension) + one-shot
backfill from property_details.listing_events for pre-trigger history.
Tax reassessment forecast IN · Partial reset (capped growth)
- Current annual tax
- $1,552 · $129/mo
- Projected year-2 tax
- $1,552 · $129/mo
- Expected delta
- $0/yr ($0/mo · 0.0%)
ⓘ Screening estimate from a state-policy table — verify with the county assessor before closing.
Climate risk First Street
- Flood 1/10 Low 0% chance over 30 yrs
- Wildfire 2/10 Low
- Heat 4/10 Moderate 7 d/yr ≥104°F today · 19 d/yr by 30 yrs out
- Wind 2/10 Low 2% chance of damaging wind over 30 yrs
- Air quality 2/10 Low 1 unhealthy d/yr today · 2 by 30 yrs out
Nearby sold comps map
Loading sold comps map…
Walkable amenities ~0.75 mi
Loading nearby amenities…
Taxation est. · year 1
- Rental income
- $16,286
- − Mortgage interest
- −$2,473
- − Property taxes
- −$1,552
- − Insurance
- −$221
- − Repairs & maintenance
- −$1,303
- − Management
- −$1,303
- − Depreciation
- −$1,284
- Taxable income
- $8,150
- Est. tax owed @ 24.0%
- −$1,956
- After-tax cash flow
- $6,359/yr
For passive investors: Depreciation is non-cash, so a rental often shows a tax loss while cash-flowing — sheltering income. Rental losses are passive: they offset passive income freely, and up to $25,000/yr can offset ordinary (W-2) income if you actively participate and your MAGI is under $100k (phasing out to $0 by $150k); unused losses carry forward. On sale, claimed depreciation is recaptured at up to 25%, and gains may owe capital-gains tax (a 1031 exchange can defer both). Figures are a year-1 estimate at your 24.0% rate — not tax advice; consult a CPA.
Schools (NCES district)
- District
- Northeast School Corporation
- NCES district ID
- 1808160
- Math proficiency
- 29% ▼ -10.00%
- Reading proficiency
- 34% ▼ -7.00%
- Median HH income
- $45,565
- Composite
- 27.01/100
- National rank
- #7061
- State rank
- #228 of 301 in IN
Livability — Dugger
- Score
- 60/100
- State rank
- #530
- US rank
- #19113
Category grades
Schools grade is shown separately in the Schools card above.
Census & demographics
- Census place
- Dugger, IN
- Population (ZIP)
- 1,319
Population outlook (Sullivan County) Hauer SSP2
- Today (2025)
- 20,313 people
- By 2030
- 19,908 · -2.0%
- By 2040
- 19,009 · -6.4%
- By 2050
- 17,972 · -11.5%
- By 2075
- 14,929 · -26.5%
- By 2100
- 11,391 · -43.9%
Race, ethnicity, and origin ACS 2023
- Neighborhood character
- Predominantly White (98%)
- Race & ethnicity
- White 98% Hispanic / Latino 2% Two or more races 2%
- Common ancestry
- Iranian 2% Slovak 2% Italian 2%
- Languages at home
- 99% English-only · Spanish 1%
Political lean MEDSL · Sullivan
- 2024 margin
- Solid R (+52.7) · D 22.8% · R 75.5% · Other 1.7%
- 2008→2024 swing
- -52.0pp toward R · 2008: -0.7pp · 2024: -52.7pp
- All cycles
- 2024: R+52.7 2020: R+50.5 2016: R+47.0 2012: R+20.6 2008: R+0.7
Not yet ingested
- Civics
- —
Market trends
- HPI YoY
- ▲ 5.57%
- Current HPI
- 180.821
- Rent YoY
- —
- Metro
- —
- State GDP YoY
- ▲ 2.90%
- F500 in state
- 18
Industry mix (Fortune 500 HQ in IN)
| Industry | F500 HQs | Revenue |
|---|---|---|
| Industrial Machinery | 2 | $37B |
|
||
| Healthcare | 1 | $177B |
|
||
| Pharmaceuticals | 1 | $45B |
|
||
| Metals / Steel | 1 | $18B |
|
||
| Agriculture | 1 | $17B |
|
||
| Packaging | 1 | $12B |
|
||
Price history
+194.3% since first listed11 events — show timeline
- 2026-04-13 Relisted — IRMLS
- 2025-12-22 Price Changed $44,149 IRMLS
- 2025-12-11 Relisted — IRMLS
- 2025-12-04 Pending — IRMLS
- 2025-09-05 Price Changed $44,650 IRMLS
- 2025-02-03 Listed $47,000 IRMLS
- 2024-12-05 Listing Removed — MIBOR as Distributed by MLS Grid
- 2024-02-13 Listed $39,000 IRMLS
- 2024-02-13 Listed $39,000 THAAR
- 2024-02-12 Listed $39,000 MIBOR as Distributed by MLS Grid
- 2000-11-10 Sold (Public Records) $15,000 Public Records
Property tax history
-2.4%/yrLatest (2024): $1,552 · -0.8% YoY. Source: county tax records.
Cash-flow waterfall
monthlySold comps — $/sqft
last 12 mo · ≤1 miLoading sold comps…