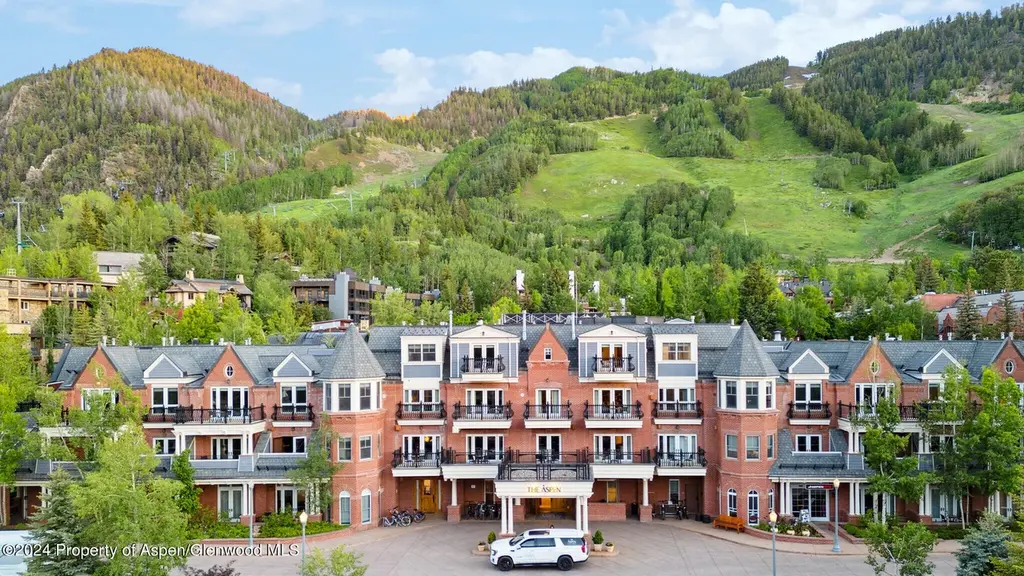
415 E Dean St., #7 Week 30 · Aspen, CO
Flood risk No data
- FEMA flood zone
- —
- Chance of flooding over 30 yrs
- —
- Est. flood insurance / yr
- —
Fire risk No data
- Est. fire insurance / yr
- —
Heat risk No data
- Hot days now (above threshold)
- —
- Hot days in 30 yrs
- —
Wind risk No data
- Chance of severe wind over 30 yrs
- —
Air-quality risk No data
- Unhealthy air days now
- —
- Unhealthy air days in 30 yrs
- —
Risk factors via First Street. Map © Google.
Why this score? — see what drove the C grade
The composite is a weighted blend of 9 inputs, each scored 0–100. Each bar is that input's sub-score; the figure is the points it added to the 100-point composite (weight × sub-score).
- Cash flow +15.0/30.0
- Appreciation +10.0/10.0
- ARV discount +7.5/15.0
- 1% rule +5.0/10.0
- DSCR +5.0/10.0
- Rent growth +5.0/5.0
- Schools +4.1/10.0
- Livability +3.3/5.0
- Condition / age +2.5/5.0
$125,000
🖨 Deal sheet (PDF) 📄 Offer letter ✓ Due diligence
Listing remarks MLS
Luxury one bedroom condominium. Large size with high ceilings. Located on first floor with convenient access to fire pit, gym, pool, hot tubs and members lounge. Walk to restaurants, shopping, parks and everything Aspen has to offer. The Aspen Mountain Residences offer outstanding service and amenities. Enjoy winter ski week #6 every year together with additional float time. 2025 dates: Sat, February 8 to Saturday, February 15. 2025 Float weeks are 10/18 thru 10/25 and 11/22 thru 11/29. 2026 Float week is 12/5-12/12.
Key facts
- $360 HOA
- Garage
- Pool
Property features AI
Finance
- HOA & community: Association present; Annual association fee of $4,320.91; Association amenities include professional management and locker/ski storage; Association fee covers contingency fund, insurance, sewer, unit heat, trash, snow removal and cable TV
Exterior
- Parking: Common parking; Has garage; Has carport
- Home design: Condominium
- Exterior features: Not new construction; Located downtown Aspen (corner of Dean and Mill Street); Part of G.A. resort condos / The Aspen Mountain Residences
Interior
- Kitchen: Refrigerator; Microwave
- Bathrooms: 1 full bathroom
- Heating & cooling: Forced air heating; Cooling present
- Interior features: Gas fireplace; Excellent condition
Neighborhood map
What this means for you Summary
Snapshot
- This is a 1-bed/1.0-bath condo listed at $125k.
Deal economics
- At list price, monthly cash flow is $3k ($40k/yr) — positive.
- The deal already cash-flows at list — no discount required.
- Meets the 1% rule at list price ($6k rent vs $125k).
- Recommended offer: $123k (1.5% below list) — sets the bar for market timing.
Location & tenants
- Location reads 66/100 on livability (#142 in CO) — a middle-class / working-renter tenant base. Strengths: commute A+, employment A+; Watch: amenities F, cost of living F, health & safety F.
- Aspen School District No. 1 In The County Of Pitkin And Sta (rural): math 36% / reading 56% proficiency, ranked #18 of 86 in CO (top 21%) — families likely to look elsewhere, expect single-tenant / working-renter base with shorter leases; only 4% free/reduced lunch — higher-income household profile.
- Zoned schools: Aspen Elementary School (math 32% / reading 52%, grade F, #321 of 966 statewide, top 35%, 440 students, 0% FRL); Aspen Middle School (math 30% / reading 49%, grade F, #84 of 270 statewide, top 32%, 443 students, 0% FRL); Aspen High School (math 47% / reading 72%, grade C+, #53 of 381 statewide, top 17%, 529 students, 0% FRL) — zoned schools at 0% FRL track the district average.
- Market conditions: Rents rising fast (+22.1%/yr); 324 active listings in the ZIP; solid renter incomes; 145 units permitted in Pitkin County in 2024 (89 in 5+ unit buildings).
- At $6,077/mo this rent would consume 88% of the median local household income ($83k/yr) (locally 566% of renters already pay >50% of income on rent) — very limited rent-growth headroom before tenants either downsize or default.
Forward outlook
- In year one you build about $13k of equity ($864 loan paydown + $12k appreciation (10.0% local appreciation)).
- Pitkin County population projected at +20% by 2050 — long-run rental-demand tailwind backs the buy-and-hold thesis.
- At projected returns (10.0% appreciation + 8.0% rent growth), your $35k cash investment doubles in ~1 year — after that, you're playing with house money.
- By year 3, paydown + projected appreciation supports a ~$34k cash-out refi (75% LTV) — recoverable capital for the next deal without selling this one.
Negotiation context
- It's been on market 17 days — a 2% lower offer ($123k) is reasonable based on typical stale-listing flexibility.
- 4 sale attempts since 3y ago with the ask held roughly flat each time — persistent listings suggest the price (not the market) is what's stuck; bring a comps-based counter.
- Current owner paid $90k; 39% above their basis — modest negotiation headroom, anchor on the comps not their cost.
Risks & watch-outs
- Watch-outs: property tax is 3.7% of price.
Questions for the listing agent
- Property tax is high relative to price — has the assessment been appealed recently, and will the sale trigger a re-assessment?
- What does the HOA fee cover, when was the last increase, and are there any pending special assessments or reserve-fund shortfalls?
- Any open or pending special assessments — roof, HVAC, plumbing, elevator, façade? What's the per-unit balance and payoff schedule, and is the seller paying it off at close or rolling it to the buyer?
- Is there a deadline driving the sale (1031 exchange, divorce, estate, relocation)? That informs how much negotiation room exists.
- Schools are B-rated — typically a magnet for longer-tenancy family renters. What's the average tenant stay here, and is there a school-zone premium baked into asking?
- What's the average days-on-market for RENTAL listings here right now (not sales)? A rising rental-DOM trend means longer vacancies and softer asking-rent achievability than the comps imply.
- What's the recent tenant-quality profile in this submarket — average credit score on applications, eviction rate, late-payment / NSF rate, and stable-employment percentage? A property-management company in the area should have these aggregated.
- How much new apartment / multifamily construction is in the pipeline within 1–3 miles? Heavy new supply (>2% of stock underway) typically softens rents 12–24 months out; light construction supports rent growth.
Investment metrics
- 1% rule
- 4.86% ✓
- Cap rate
- 38.40%
- Cash-on-cash
- 114.67%
- DSCR
- 6.10
- GRM
- 1.7
CMA / ARV
No comps found within radius.
Projected returns pro-forma
10.0% appreciation · 8.0% rent growth · sell at horizon
- IRR
- —
- Equity multiple
- 9.96×
- Total profit
- $313,673
- Equity at exit
- $112,610
- IRR
- —
- Equity multiple
- 24.90×
- Total profit
- $836,670
- Equity at exit
- $242,848
Cash invested: $35,000 (down + closing). Projections, not guarantees.
Landlord ↔ Tenant lean methodology
- Overall (STATE)
- 38 Tenant-Leaning
- State Colorado
- 38 Tenant-Leaning · D+4
- County
- — inherits STATE
- City
- — inherits STATE
ZIP-level market 81611
- Home prices YoY
- 3.6%
- Rents YoY
- 22.1%
- Active inventory
- 324
- Price-to-rent
- 1.7×
Monthly cashflow live
- Estimated rent
- $6,077 medium interval (Pro) →
- Mortgage (P&I)
- −$656
- Tax from tax record
- −$389 /mo · $4,667/yr
- Insurance
- −$52
- HOA
- −$360
- Vacancy / Maint / Mgmt
- −$1,276
- Net cashflow
- $3,345
Break-even live
Sensitivity live
| Price | -10% $3,415 | -5% $3,380 | +0% $3,345 | +5% $3,309 | +10% $3,274 |
|---|---|---|---|---|---|
| Rent | -10% $2,865 | -5% $3,105 | +0% $3,345 | +5% $3,585 | +10% $3,825 |
| Rate | -1.0pp $3,408 | -0.5pp $3,376 | base $3,345 | +0.5pp $3,312 | +1.0pp $3,279 |
UW: 25.0% down · 7.5% · 30yr · 1.5% tax · 5.0% vac · 8.0% maint · 8.0% mgmt
Financing live
Cash to close
- Down payment
- $31,250
- Closing costs
- $3,750
- Reserves months
- —
- Total cash needed
- —
Loan-product check · same deal, 3 products live
Conventional
25% down · 7.5% · 30yr
- Down + closing
- —
- Monthly P&I
- —
- Monthly cashflow
- —
- DSCR
- —
- Eligible?
- —
Personal DTI + credit; lowest rate.
DSCR
20% down · 8.5% · 30yr
- Down + closing
- —
- Monthly P&I
- —
- Monthly cashflow
- —
- DSCR
- —
- Eligible?
- —
No personal income docs; deal must DSCR.
Hard money
10% down · 12.0% · 12mo
- Down + closing
- —
- Monthly P&I
- —
- Monthly cashflow
- —
- DSCR
- —
- Eligible?
- —
Short-term bridge; refi at stabilization.
HOA detail condo
- Monthly dues
- $360 · $4,320/yr
- Likely covers
- poolgym
- Assessments
- None detected in remarks — confirm with the listing agent.
Listing history 32 events
-
2026-06-21days on market $125,000 Active 17 DOM
-
2026-06-19days on market $125,000 Active 15 DOM
-
2026-06-18days on market $125,000 Active 14 DOM
-
2026-06-17days on market $125,000 Active 13 DOM
-
2026-06-16days on market $125,000 Active 12 DOM
-
2026-06-15days on market $125,000 Active 11 DOM
-
2026-06-14days on market $125,000 Active 9 DOM
-
2026-06-12days on market $125,000 Active 8 DOM
-
2026-06-09days on market $125,000 Active 5 DOM
-
2026-06-08days on market $125,000 Active 4 DOM
-
2026-06-07days on market $125,000 Active 3 DOM
-
2026-06-05remarks 699-char remark
-
2026-06-05pricedays on market $125,000 Active 1 DOM
-
2026-06-02days on market $110,000 Active 520 DOM
-
2026-06-01days on market $110,000 Active 519 DOM
-
2026-05-31days on market $110,000 Active 518 DOM
-
2026-05-30days on market $110,000 Active 517 DOM
-
2025-10-29$210,000 Active 1040-char remark
-
2024-12-28$110,000 Active 526-char remark
Show marketing remark (526 chars)
Luxury one bedroom condominium. Large size with high ceilings. Located on first floor with convenient access to fire pit, gym, pool, hot tubs and members lounge. Walk to restaurants, shopping, parks and everything Aspen has to offer. The Aspen Mountain Residences offer outstanding service and amenities. Enjoy winter ski week #6 every year together with additional float time. 2025 dates: Sat, February 8 to Saturday, February 15. 2025 Float weeks are 10/18 thru 10/25 and 11/22 thru 11/29. 2026 Float week is 12/5-12/12.
-
2024-03-01soldstatus $90,000 Closed
Show marketing remark (587 chars)
Luxury one bedroom condominium. Large size, first floor with high ceilings. Great patio to enjoy the outside and convenient access to fire pit, breakfast/member's lounge, gym and pool/hot tubs. The Aspen Mountain Residences offers outstanding service and amenities. Perfect location...walk to restaurants, shopping, parks and everything Aspen has to offer. Enjoy prime spring break week 10 every year together with additional float time each year. 2024 dates: Fixed Week: Sat, July 27 to Sat, August 3. Float week: Sat, June 22 to Sat, June 29. 2025 dates: Sat, July 26 to Sat, August 2.
-
2024-02-19status Pending
Show marketing remark (587 chars)
Luxury one bedroom condominium. Large size, first floor with high ceilings. Great patio to enjoy the outside and convenient access to fire pit, breakfast/member's lounge, gym and pool/hot tubs. The Aspen Mountain Residences offers outstanding service and amenities. Perfect location...walk to restaurants, shopping, parks and everything Aspen has to offer. Enjoy prime spring break week 10 every year together with additional float time each year. 2024 dates: Fixed Week: Sat, July 27 to Sat, August 3. Float week: Sat, June 22 to Sat, June 29. 2025 dates: Sat, July 26 to Sat, August 2.
-
2023-10-11$110,000 Active
Show marketing remark (587 chars)
Luxury one bedroom condominium. Large size, first floor with high ceilings. Great patio to enjoy the outside and convenient access to fire pit, breakfast/member's lounge, gym and pool/hot tubs. The Aspen Mountain Residences offers outstanding service and amenities. Perfect location...walk to restaurants, shopping, parks and everything Aspen has to offer. Enjoy prime spring break week 10 every year together with additional float time each year. 2024 dates: Fixed Week: Sat, July 27 to Sat, August 3. Float week: Sat, June 22 to Sat, June 29. 2025 dates: Sat, July 26 to Sat, August 2.
-
2023-08-03soldstatus $100,000 Closed
-
2023-07-13status Pending
-
2023-01-27$120,000 Active
-
2021-11-08soldstatus $17,900
-
2021-10-04soldstatus $39,900
-
2021-02-16soldstatus $105,000
-
2019-01-22soldstatus $45,800
-
2018-05-14soldstatus $57,500
-
2013-02-26soldstatus $147,500
-
2009-03-31soldstatus $85,000
ⓘ Source: listings_history table (triggers on properties + properties_extension) + one-shot
backfill from property_details.listing_events for pre-trigger history.
Tax reassessment forecast CO · Resets to sale price
- Current annual tax
- $4,667 · $389/mo
- Projected year-2 tax
- $4,667 · $389/mo
- Expected delta
- $0/yr ($0/mo · 0.0%)
ⓘ Screening estimate from a state-policy table — verify with the county assessor before closing.
Nearby sold comps map
Loading sold comps map…
Walkable amenities ~0.75 mi
Loading nearby amenities…
Taxation est. · year 1
- Rental income
- $72,929
- − Mortgage interest
- −$7,002
- − Property taxes
- −$4,667
- − Insurance
- −$625
- − Repairs & maintenance
- −$5,834
- − Management
- −$5,834
- − HOA
- −$4,320
- − Depreciation
- −$3,636
- Taxable income
- $41,010
- Est. tax owed @ 24.0%
- −$9,842
- After-tax cash flow
- $30,293/yr
For passive investors: Depreciation is non-cash, so a rental often shows a tax loss while cash-flowing — sheltering income. Rental losses are passive: they offset passive income freely, and up to $25,000/yr can offset ordinary (W-2) income if you actively participate and your MAGI is under $100k (phasing out to $0 by $150k); unused losses carry forward. On sale, claimed depreciation is recaptured at up to 25%, and gains may owe capital-gains tax (a 1031 exchange can defer both). Figures are a year-1 estimate at your 24.0% rate — not tax advice; consult a CPA.
Schools (NCES district)
- District
- Aspen School District No. 1 In The County Of Pitkin And Sta
- NCES district ID
- 0802280
- Math proficiency
- 36% ▼ -5.00%
- Reading proficiency
- 56% ▼ -3.00%
- Median HH income
- $66,694
- Composite
- 40.98/100
- National rank
- #3595
- State rank
- #18 of 86 in CO
Livability — Aspen
- Score
- 66/100
- State rank
- #142
- US rank
- #11780
Category grades
Schools grade is shown separately in the Schools card above.
Census & demographics
- Census place
- Aspen, CO
- County
- Pitkin County · 9,068 people
- City population
- 9,068
- Metro
- Glenwood Springs, CO
- Population (ZIP)
- 9,068
- Household income
- $82,664
- Rent vs Own
- Severe rent burden
- 566.0
Population outlook (Pitkin County) Hauer SSP2
- Today (2025)
- 20,121 people
- By 2030
- 21,110 · +4.9%
- By 2040
- 22,707 · +12.9%
- By 2050
- 24,105 · +19.8%
- By 2075
- 27,933 · +38.8%
- By 2100
- 30,018 · +49.2%
Race, ethnicity, and origin ACS 2023
- Neighborhood character
- Predominantly White (81%)
- Race & ethnicity
- White 81% Hispanic / Latino 10% Two or more races 7% Asian 4%
- Hispanic origin (detail)
- Mexican 4% Salvadoran 4%
- Common ancestry
- Slovak 3% Iranian 3% Romanian 3%
- Foreign-born
- 15% · Canada, Dominican Republic, China
- Languages at home
- 82% English-only · Spanish 9% Other Indo-European 2% Chinese 2%
Political lean MEDSL · Pitkin
- 2024 margin
- Solid D (+44.2) · D 71.0% · R 26.8% · Other 2.2%
- 2008→2024 swing
- -4.6pp toward R · 2008: 48.8pp · 2024: 44.2pp
- All cycles
- 2024: D+44.2 2020: D+51.9 2016: D+45.4 2012: D+37.9 2008: D+48.8
Not yet ingested
- Civics
- —
Market trends
- HPI YoY
- ▲ 12.97%
- Current HPI
- 370.9593
- Rent YoY
- ▲ 22.07%
- Metro
- Glenwood Springs, CO
- State GDP YoY
- ▲ 1.95%
- F500 in state
- 14
Industry mix (Fortune 500 HQ in CO)
| Industry | F500 HQs | Revenue |
|---|---|---|
| Technology Distribution | 1 | $31B |
|
||
| Food / Agriculture | 1 | $18B |
|
||
| Packaging | 1 | $14B |
|
||
| Healthcare | 1 | $13B |
|
||
| Energy | 1 | $10B |
|
||
| Technology | 1 | $4B |
|
||
Price history
+47.1% since first listed15 events — show timeline
- 2026-06-04 Listed $125,000 AGMLS
- 2024-12-28 Listed $110,000 AGMLS
- 2024-03-01 Sold (MLS) $90,000 AGMLS
- 2024-02-19 Pending — AGMLS
- 2023-10-11 Listed $110,000 AGMLS
- 2023-08-03 Sold (MLS) $100,000 AGMLS
- 2023-07-13 Pending — AGMLS
- 2023-01-27 Listed $120,000 AGMLS
- 2021-11-08 Sold (Public Records) $17,900 Public Records
- 2021-10-04 Sold (MLS) $39,900 AGMLS
- 2021-02-16 Sold (Public Records) $105,000 Public Records
- 2019-01-22 Sold (MLS) $45,800 AGMLS
- 2018-05-14 Sold (Public Records) $57,500 Public Records
- 2013-02-26 Sold (Public Records) $147,500 Public Records
- 2009-03-31 Sold (MLS) $85,000 AGMLS
Property tax history
+1.6%/yrLatest (2025): $4,667 · +4.2% YoY. Source: county tax records.
Cash-flow waterfall
monthlySold comps — $/sqft
last 12 mo · ≤1 miLoading sold comps…