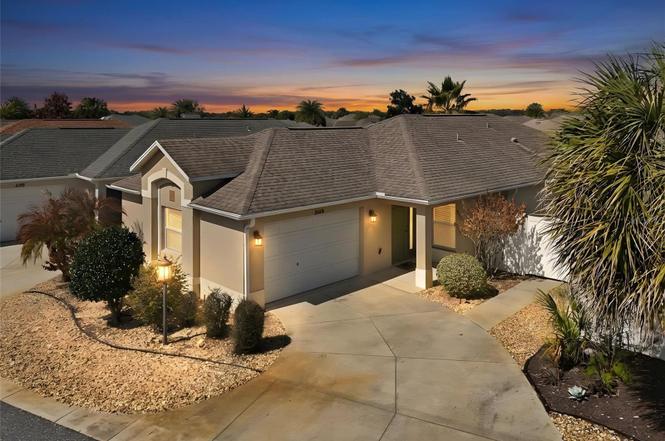
2149 Sandalwood Pl · The Villages, FL
Flood risk 1/10 · Minimal
- FEMA flood zone
- X (unshaded)
- Chance of flooding over 30 yrs
- 0.0%
- Est. flood insurance / yr
- $507 – $1,088
Fire risk 4/10 · Minor
- Est. fire insurance / yr
- $947 – $1,759
Heat risk 9/10 · Severe
- Hot days now (above 108°F)
- 7 days/yr
- Hot days in 30 yrs
- 22 days/yr
Wind risk 9/10 · Severe
- Chance of severe wind over 30 yrs
- 99.0%
Air-quality risk 2/10 · Minimal
- Unhealthy air days now
- 1 days/yr
- Unhealthy air days in 30 yrs
- 2 days/yr
Risk factors via First Street. Map © Google.
Why this score? — see what drove the D grade
The composite is a weighted blend of 9 inputs, each scored 0–100. Each bar is that input's sub-score; the figure is the points it added to the 100-point composite (weight × sub-score).
- Cash flow +10.5/30.0
- Appreciation +10.0/10.0
- Schools +5.2/10.0
- ARV discount +4.0/15.0
- Livability +3.5/5.0
- DSCR +3.0/10.0
- 1% rule +2.6/10.0
- Rent growth +2.5/5.0
- Condition / age +2.5/5.0
$369,900
🖨 Deal sheet 📄 Offer letter ✓ Due diligence
Listing remarks
Welcome to 2149 Sandwood Place! BOND PAID on this beautifully maintained Anaheim Courtyard Villa located in the highly desirable Village of COLLIER. This BLOCK & STUCCO Villa is having NEW STAINLESS STEEL APPLIANCES installed and NEW LUXURY VINYL FLOORS installed! This charming home offers the perfect blend of comfort, privacy, and the convenience in the heart of The Villages. Step inside to find a light and bright designed OPEN FLOOR PLAN designed for easy Florida living and entertaining. The spacious kitchen flows seamlessly into the dining and living areas, while the split-bedroom layout provides privacy for both homeowners and guests. The courtyard-style setting offers a peaceful
Key facts
- Open floor plan
- 3,987 sq ft lot
- Garage
Tags
Property features AI
Finance
- Other: Unfurnished; No lease restrictions; Approximately 0.09 acres lot (0 to less than 1/4 acre)
- HOA & community: Community includes a CDD; Senior community
Exterior
- Parking: Driveway; Off-street parking; Attached garage (1 space)
- Utilities: Public sewer; Water connected; Sewer connected; Electricity connected; Broadband/high-speed internet available; Water source: None
- Home design: Residential villa; One story; South-facing
- Construction: Concrete and stucco construction; Shingle roof; Other foundation
- Exterior features: Screened patio/porch; Sliding doors; Paved road access
Interior
- Kitchen: Built-in oven; Dishwasher; Microwave; Refrigerator
- Bedrooms: 3 bedrooms
- Flooring: Carpet
- Bathrooms: 2 full bathrooms
- Heating & cooling: Central heating; Central air conditioning
- Interior features: Ceiling fans; High ceilings; Open floor plan; Tray ceilings; Walk-in closets
- Laundry & utility: Inside laundry; Washer; Dryer; Irrigation equipment
Neighborhood map
What this means for you Summary
Snapshot
- This is a 3-bed/2.0-bath single-family listed at $370k.
Deal economics
- At list price, monthly cash flow is $-187 ($-2k/yr) — negative.
- To cash-flow at today's rent, offer at most $337k (8.9% below list).
- To meet the 1% rule (rent ≥ 1% of price), the offer needs to be $282k (23.7% below list).
- Recommended offer: $282k (23.7% below list) — sets the bar for 1% rule.
Location & tenants
- Location reads 70/100 on livability (#431 in FL) — a middle-class / working-renter tenant base. Strengths: crime A+, housing A, employment B+; Watch: amenities F, commute F, health & safety F.
- Sumter (rural): math 61% / reading 61% proficiency, ranked #11 of 73 in FL (top 15%) — acceptable for families but not a draw, mixed tenant base, ~2y average lease.
- Zoned schools: Wildwood Elementary School (math 49% / reading 52%, grade D+, #1,055 of 2,144 statewide, top 50%, 940 students, 76% FRL); Wildwood Middle/ High School (math 29% / reading 41%, grade F, #379 of 667 statewide, top 58%, 843 students, 63% FRL) — zoned schools average 69% FRL vs 51% district-wide (19 pts higher); higher-poverty schools than district average — tighter screening recommended.
- Zoned-school proficiency averages 43% at this address vs 61% district-wide (-18 pts) — the specific schools serving this property underperform the Sumter average; the district grade overstates school quality for this exact location.
- Market conditions: 265 active listings in the ZIP; 9 comparable units currently listed for rent nearby; rentals at typical pace (median 21d on market — plan ~3-4 weeks tenant-placement turnaround); solid renter incomes; 3,961 units permitted in Sumter County in 2024 (248 in 5+ unit buildings).
- This rent runs 35% of the median local income ($97k/yr) — at the standard rent-burdened threshold; future hikes will face affordability resistance.
Forward outlook
- In year one you build about $40k of equity ($3k loan paydown + $37k appreciation (10.0% local appreciation)).
- Sumter County population projected at +45% by 2050 — long-run rental-demand tailwind backs the buy-and-hold thesis.
- By year 2, paydown + projected appreciation supports a ~$64k cash-out refi (75% LTV) — recoverable capital for the next deal without selling this one.
Negotiation context
- It's been on market 121 days — a 12% lower offer ($326k) is reasonable based on typical stale-listing flexibility.
- 2 sale attempts with the ask held roughly flat each time — persistent listings suggest the price (not the market) is what's stuck; bring a comps-based counter.
Risks & watch-outs
- Climate carrying-cost: severe wind risk, 99% chance of damaging wind over 30y; extreme-heat days projected 7→22/yr by 2055 (HVAC capex compounding) — expect insurance premiums to compound above CPI over the hold.
Questions for the listing agent
- What do current leases actually rent for vs. the listed asking? Can we see a recent rent roll and the last 12 months of T-12 income?
- It's been on market 121 days. Have you received any prior offers? Is the seller open to a 24% concession, seller financing, or rate buy-down credit?
- Why hasn't it sold? Are there any deal-killer items the seller is aware of (foundation, flood, title, zoning, code violations)?
- Is there a deadline driving the sale (1031 exchange, divorce, estate, relocation)? That informs how much negotiation room exists.
- Schools are A-rated — typically a magnet for longer-tenancy family renters. What's the average tenant stay here, and is there a school-zone premium baked into asking?
- The area grade is low — what's the realistic commute time and amenity access for the typical tenant pool here? Any planned neighborhood developments (good or bad) we should know about?
- What's the average days-on-market for RENTAL listings here right now (not sales)? A rising rental-DOM trend means longer vacancies and softer asking-rent achievability than the comps imply.
- What's the recent tenant-quality profile in this submarket — average credit score on applications, eviction rate, late-payment / NSF rate, and stable-employment percentage? A property-management company in the area should have these aggregated.
- How much new for-sale + rental construction is in the pipeline within 1–3 miles? Heavy new supply typically softens prices + rents 12–24 months out; constrained supply supports both.
Investment metrics
- 1% rule
- 0.76% ✗
- Cap rate
- 5.69%
- Cash-on-cash
- -2.17%
- DSCR
- 0.90
- GRM
- 10.9
CMA / ARV
- ARV (on-the-fly)
- $343,321
- Comps found
- 12
Show comp detail 12 sales within ~0.75 mi
| Address | Dist | Beds/Ba | Sqft | Sold | Price | $/sf | Match |
|---|---|---|---|---|---|---|---|
| 3493 Habersham Ct | 0.31mi | 3/2.0 | 1,446 (+7%) | 6mo | $438,000 | $303 | 70 |
| 3481 Oldham Ln | 0.26mi | 3/2.0 | 1,504 (+11%) | 2mo | $385,000 | $256 | 68 |
| 3459 Oldham Ln | 0.27mi | 3/2.0 | 1,446 (+7%) | 15mo | $420,000 | $290 | 64 |
| 3554 Marianna Pl | 0.36mi | 3/2.0 | 1,416 (+4%) | 17mo | $410,000 | $290 | 62 |
| 3407 Melbourne Ln | 0.16mi | 3/2.0 | 1,559 (+15%) | 11mo | $394,000 | $253 | 59 |
| 3810 Cosmos Way | 0.53mi | 3/2.0 | 1,501 (+11%) | 10mo | $350,000 | $233 | 50 |
| 2080 Nordic Ln | 0.30mi | 3/2.0 | 1,559 (+15%) | 15mo | $390,000 | $250 | 49 |
| 3734 Viscaya Ct | 0.41mi | 2/2.0 (-1) | 1,156 (-15%) | 5mo | $257,500 | $223 | 47 |
| 5708 CR 173 | 0.71mi | 3/2.0 | 1,417 (+4%) | 21mo | $345,000 | $243 | 42 |
| 3780 Viscaya Ct | 0.50mi | 2/2.0 (-1) | 1,156 (-15%) | 10mo | $294,900 | $255 | 39 |
| 3764 Ivey Ter | 0.47mi | 2/2.0 (-1) | 1,156 (-15%) | 13mo | $255,000 | $221 | 38 |
| 3503 Nance Run | 0.46mi | 3/2.0 | 1,559 (+15%) | 20mo | $392,000 | $251 | 37 |
Match score weights: distance 35% · size 25% · config 20% · recency 20%. Top-matched comps best support the ARV.
Projected returns pro-forma
10.0% appreciation · 3.0% rent growth · sell at horizon
- IRR
- 22.7%
- Equity multiple
- 2.83×
- Total profit
- $189,484
- Equity at exit
- $333,235
- IRR
- 20.3%
- Equity multiple
- 6.48×
- Total profit
- $567,296
- Equity at exit
- $718,634
Cash invested: $103,572 (down + closing). Projections, not guarantees.
Landlord ↔ Tenant lean methodology
- Overall (STATE)
- 87 Strongly Landlord-Friendly
- State Florida
- 87 Strongly Landlord-Friendly · R+3
- County
- — inherits STATE
- City
- — inherits STATE
ZIP-level market 32163
- Home prices YoY
- 9.8%
- Active inventory
- 265
- Price-to-rent
- 10.9×
Monthly cashflow live
- Estimated rent
- $2,822 high interval (Pro) →
- Mortgage (P&I)
- −$1,940
- Tax from tax record
- −$323 /mo · $3,874/yr
- Insurance
- −$154
- HOA
- −$0
- Vacancy / Maint / Mgmt
- −$593
- Net cashflow
- $-187
Break-even live
UW: 25.0% down · 7.5% · 30yr · 1.5% tax · 5.0% vac · 8.0% maint · 8.0% mgmt
Financing live
Cash to close
- Down payment
- $92,475
- Closing costs
- $11,097
- Reserves months
- —
- Total cash needed
- —
Loan-product check · same deal, 3 products live
Conventional
25% down · 7.5% · 30yr
- Down + closing
- —
- Monthly P&I
- —
- Monthly cashflow
- —
- DSCR
- —
- Eligible?
- —
Personal DTI + credit; lowest rate.
DSCR
20% down · 8.5% · 30yr
- Down + closing
- —
- Monthly P&I
- —
- Monthly cashflow
- —
- DSCR
- —
- Eligible?
- —
No personal income docs; deal must DSCR.
Hard money
10% down · 12.0% · 12mo
- Down + closing
- —
- Monthly P&I
- —
- Monthly cashflow
- —
- DSCR
- —
- Eligible?
- —
Short-term bridge; refi at stabilization.
Rent comps 9 comps
| Address | Beds | Baths | Sqft | Rent | $/sqft | DOM | Units | Dist |
|---|---|---|---|---|---|---|---|---|
| 2577 Lindewood St The Villages, FL | 2.0 | 2.0 | 1206 | $2,495 | $2.07 | 21d | 1 | 0.69mi |
| 3064 Gulfport Ct The Villages, FL | 2.0 | 2.0 | 1602 | $2,800 | $1.75 | 21d | 1 | 0.87mi |
| 3025 Bartow Ln The Villages, FL | 3.0 | 2.0 | 1415 | $3,500 | $2.47 | 21d | 1 | 0.91mi |
| 3394 Ridgewood Path The Villages, FL | 3.0 | 2.0 | 1559 | $4,000 | $2.57 | 21d | 1 | 1.05mi |
| 7011 Homestead Lp Wildwood, FL | 1.0–3.0 | 1.0–2.0 | 998 | $1,759 | $1.76 | 21d | 22 | 1.11mi |
| 6629 Dan DiCiolla Dr Wildwood, FL | 1.0–3.0 | 1.0–2.5 | 1075 | $2,399 | $2.23 | 21d | 44 | 1.25mi |
| 3480 Kewadin Ave The Villages, FL | 2.0 | 2.0 | 1758 | $2,500 | $1.42 | 21d | 1 | 1.30mi |
| 5267 Dragonfly Dr Wildwood, FL | 3.0 | 2.5 | 1688 | $1,945 | $1.15 | 21d | 1 | 1.42mi |
| 5339 Loblolly Ln Wildwood, FL | 3.0 | 2.5 | 1688 | $2,000 | $1.18 | 21d | 1 | 1.47mi |
Listing history 19 events
-
2026-06-19days on market $369,900 Active 121 DOM
-
2026-06-18days on market $369,900 Active 120 DOM
-
2026-06-17days on market $369,900 Active 119 DOM
-
2026-06-16days on market $369,900 Active 118 DOM
-
2026-06-15days on market $369,900 Active 117 DOM
-
2026-06-14days on market $369,900 Active 115 DOM
-
2026-06-13days on market $369,900 Active 114 DOM
-
2026-06-10days on market $369,900 Active 112 DOM
-
2026-06-09days on market $369,900 Active 111 DOM
-
2026-06-08days on market $369,900 Active 110 DOM
-
2026-06-07days on market $369,900 Active 109 DOM
-
2026-06-02days on market $369,900 Active 104 DOM
-
2026-06-01days on market $369,900 Active 103 DOM
-
2026-05-31days on market $369,900 Active 102 DOM
-
2026-05-30days on market $369,900 Active 101 DOM
-
2026-03-25price $369,900
-
2026-02-18$375,000 Active
-
2026-02-16historical
-
2025-11-11$364,900 Active
ⓘ Source: listings_history table (triggers on properties + properties_extension) + one-shot
backfill from property_details.listing_events for pre-trigger history.
Tax reassessment forecast FL · Resets to sale price
- Current annual tax
- $3,874 · $323/mo
- Projected year-2 tax
- $3,874 · $323/mo
- Expected delta
- $0/yr ($0/mo · 0.0%)
ⓘ Screening estimate from a state-policy table — verify with the county assessor before closing.
Climate risk First Street
- Flood 1/10 Low FEMA zone X (unshaded) · 0% chance over 30 yrs
- Wildfire 4/10 Moderate
- Heat 9/10 Extreme 7 d/yr ≥108°F today · 22 d/yr by 30 yrs out
- Wind 9/10 Extreme 99% chance of damaging wind over 30 yrs
- Air quality 2/10 Low 1 unhealthy d/yr today · 2 by 30 yrs out
Nearby sold comps map
Loading sold comps map…
Walkable amenities ~0.75 mi
Loading nearby amenities…
Taxation est. · year 1
- Rental income
- $33,864
- − Mortgage interest
- −$20,720
- − Property taxes
- −$3,874
- − Insurance
- −$1,850
- − Repairs & maintenance
- −$2,709
- − Management
- −$2,709
- − Depreciation
- −$10,761
- Taxable loss
- −$8,758
- Est. tax savings @ 24.0%
- +$2,102
- After-tax cash flow
- $-146/yr
For passive investors: Depreciation is non-cash, so a rental often shows a tax loss while cash-flowing — sheltering income. Rental losses are passive: they offset passive income freely, and up to $25,000/yr can offset ordinary (W-2) income if you actively participate and your MAGI is under $100k (phasing out to $0 by $150k); unused losses carry forward. On sale, claimed depreciation is recaptured at up to 25%, and gains may owe capital-gains tax (a 1031 exchange can defer both). Figures are a year-1 estimate at your 24.0% rate — not tax advice; consult a CPA.
Schools (NCES district)
- District
- Sumter
- NCES district ID
- 1201800
- Math proficiency
- 61% ▼ -4.00%
- Reading proficiency
- 61% ▼ -2.00%
- Median HH income
- $48,240
- Composite
- 51.74/100
- National rank
- #1682
- State rank
- #11 of 73 in FL
Livability — The Villages
- Score
- 70/100
- State rank
- #431
- US rank
- #7363
Category grades
Schools grade is shown separately in the Schools card above.
Census & demographics
- Census place
- The Villages, FL
- County
- Sumter County · 110,591 people
- City population
- 83,973
- Metro
- The Villages, FL
- Population (ZIP)
- 28,549
- Household income
- $96,775
- Rent vs Own
- Severe rent burden
- 307.0
Population outlook (Sumter County) Hauer SSP2
- Today (2025)
- 161,172 people
- By 2030
- 180,083 · +11.7%
- By 2040
- 209,892 · +30.2%
- By 2050
- 234,186 · +45.3%
- By 2075
- 284,602 · +76.6%
- By 2100
- 317,039 · +96.7%
Race, ethnicity, and origin ACS 2023
- Neighborhood character
- Predominantly White (95%)
- Race & ethnicity
- White 95% Two or more races 2% Hispanic / Latino 2% Asian 1%
- Common ancestry
- Romanian 6% Lithuanian 3% Iranian 3%
- Foreign-born
- 6% · Canada, Vietnam
- Languages at home
- 96% English-only · Spanish 2% Vietnamese 1% Other Indo-European 0%
Political lean MEDSL · Sumter
- 2024 margin
- Solid R (+37.6) · D 30.9% · R 68.6%
- 2008→2024 swing
- -10.6pp toward R · 2008: -27.0pp · 2024: -37.6pp
- All cycles
- 2024: R+37.6 2020: R+36.1 2016: R+39.2 2012: R+34.9 2008: R+27.0
Not yet ingested
- Civics
- —
Market trends
- HPI YoY
- ▲ 20.47%
- Current HPI
- 229.0075
- Rent YoY
- —
- Metro
- The Villages, FL
- State GDP YoY
- ▲ 3.28%
- F500 in state
- 36
Industry mix (Fortune 500 HQ in FL)
| Industry | F500 HQs | Revenue |
|---|---|---|
| Industrial Technology | 2 | $29B |
|
||
| Insurance | 2 | $17B |
|
||
| Retail | 1 | $60B |
|
||
| Technology Distribution | 1 | $58B |
|
||
| Homebuilding | 1 | $35B |
|
||
| Technology Manufacturing | 1 | $35B |
|
||
Price history
+1.4% since first listed4 events — show timeline
- 2026-03-25 Price Changed $369,900 Stellar MLS as Distributed by MLS Grid
- 2026-02-18 Listed $375,000 Stellar MLS as Distributed by MLS Grid
- 2026-02-16 Listing Removed — Stellar MLS as Distributed by MLS Grid
- 2025-11-11 Listed $364,900 Stellar MLS as Distributed by MLS Grid
Property tax history
+8.6%/yrLatest (2025): $3,874 · +0.4% YoY. Source: county tax records.
Cash-flow waterfall
monthlySold comps — $/sqft
last 12 mo · ≤1 miLoading sold comps…