1501 NW 3rd Way · Pompano Beach, FL
Flood risk 1/10 · Minimal
- FEMA flood zone
- X (shaded)
- Chance of flooding over 30 yrs
- 0.0%
- Est. flood insurance / yr
- $507 – $1,088
Fire risk 1/10 · Minimal
- Est. fire insurance / yr
- $947 – $1,759
Heat risk 10/10 · Severe
- Hot days now (above 106°F)
- 7 days/yr
- Hot days in 30 yrs
- 27 days/yr
Wind risk 10/10 · Severe
- Chance of severe wind over 30 yrs
- 99.0%
Air-quality risk 2/10 · Minimal
- Unhealthy air days now
- 1 days/yr
- Unhealthy air days in 30 yrs
- 2 days/yr
Risk factors via First Street. Map © Google.
Why this score? — see what drove the C grade
The composite is a weighted blend of 9 inputs, each scored 0–100. Each bar is that input's sub-score; the figure is the points it added to the 100-point composite (weight × sub-score).
- Cash flow +20.7/30.0
- ARV discount +15.0/15.0
- DSCR +6.6/10.0
- 1% rule +4.4/10.0
- Schools +4.1/10.0
- Livability +3.7/5.0
- Rent growth +3.0/5.0
- Condition / age +2.5/5.0
- Appreciation +0.0/10.0
$349,900
🖨 Deal sheet (PDF) 📄 Offer letter ✓ Due diligence
Listing remarks
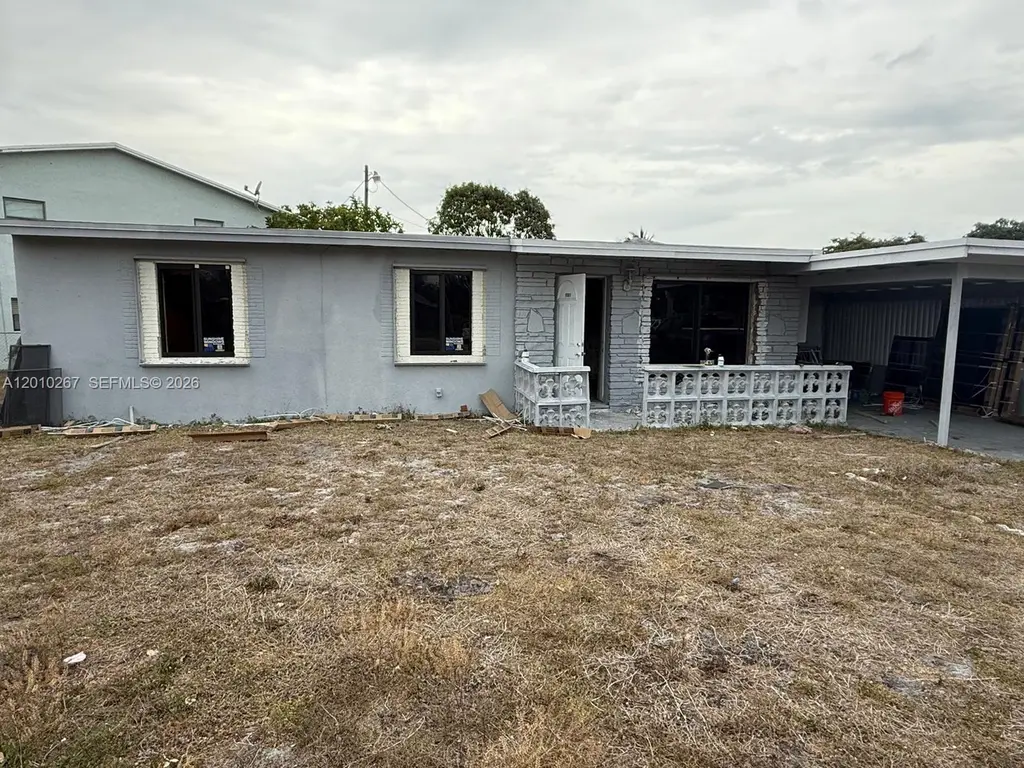
This is a diamond in the rough—a hidden gem in a spectacular location—offering the opportunity to transform it into the home of your dreams; it represents a fantastic project to undertake. The property sustained fire damage affecting no more than 25–30% of the structure; a complete roof replacement is not required, as the damaged section can be repaired. Impact-resistant doors and windows were installed throughout the property in 2025. The fascia has been repaired, the home's exterior has been painted, and the lawn is mowed regularly in compliance with city requirements. The seller is highly motivated to close the transaction as soon as possible.
Key facts
- 6,806 sq ft lot
- Parking
- Built 1954
Property features AI
Exterior
- Parking: Covered driveway parking; Has a 1-space carport
- Utilities: Public water
- Home design: Single-story; Faces southwest; Property listed as fixer
- Construction: Block construction; Effective year built
- Exterior features: No notable exterior features listed; Lot is less than a quarter acre
Interior
- Bedrooms: Bedroom located on the main level
- Bathrooms: 2 full bathrooms
- Interior features: Unfurnished; Bedroom on main level; First-floor entry; Florida room; Other room(s)
Neighborhood map
What this means for you Summary
Snapshot
- This is a 3-bed/2.0-bath single-family listed at $350k.
Deal economics
- At list price, monthly cash flow is $471 ($6k/yr) — positive.
- The deal already cash-flows at list — no discount required.
- To meet the 1% rule (rent ≥ 1% of price), the offer needs to be $329k (6.0% below list).
- Recommended offer: $329k (6.0% below list) — sets the bar for 1% rule.
- Cap rate 7.9% vs local median 3.1% in Pompano Beach — top-decile yield for the area; either an underpriced asset or a hidden risk that comps aren't pricing in. Stress-test before assuming the spread holds.
Location & tenants
- Location reads 74/100 on livability (#284 in FL, #4,541 nationally) — a middle-class / working-renter tenant base. Strengths: commute A+, housing A+, cost of living B+; Watch: employment D+, amenities F.
- Broward (suburban): math 42% / reading 53% proficiency, ranked #46 of 73 in FL (top 63%) — families likely to look elsewhere, expect single-tenant / working-renter base with shorter leases.
- Zoned schools: Nova Blanche Forman Elementary (math 35% / reading 55%, grade D-, #1,271 of 2,144 statewide, top 60%, 769 students, 72% FRL); Nova Middle School (math 44% / reading 53%, grade C-, #274 of 571 statewide, top 50%, 1,284 students, 68% FRL); Nova High School (math 22% / reading 56%, grade F, #312 of 667 statewide, top 48%, 2,227 students, 59% FRL) — zoned schools average 66% FRL vs 51% district-wide (15 pts higher); higher-poverty schools than district average — tighter screening recommended.
- Market conditions: Rents rising (+2.1%/yr); 339 active listings in the ZIP; 40 comparable units currently listed for rent nearby; rentals at typical pace (median 26d on market — plan ~3-4 weeks tenant-placement turnaround); 2,111 units permitted in Broward County in 2024 (1,265 in 5+ unit buildings).
- At $3,288/mo this rent would consume 61% of the median local household income ($65k/yr) (locally 2870% of renters already pay >50% of income on rent) — very limited rent-growth headroom before tenants either downsize or default.
Forward outlook
- Local home prices are declining (-3.0%/yr); year-one equity from $2k of loan paydown is wiped out by about $10k of value loss. Plan a longer hold.
- Broward County population projected at +34% by 2050 — long-run rental-demand tailwind backs the buy-and-hold thesis.
Negotiation context
- It's been on market 53 days — a 3% lower offer ($339k) is reasonable based on typical stale-listing flexibility.
- 4 sale attempts since 2y ago with the ask held roughly flat each time — persistent listings suggest the price (not the market) is what's stuck; bring a comps-based counter.
Risks & watch-outs
- Watch-outs: built in 1954 — expect roof / HVAC / electrical / plumbing capex.
- Climate carrying-cost: severe wind risk, 99% chance of damaging wind over 30y; extreme-heat days projected 7→27/yr by 2055 (HVAC capex compounding) — expect insurance premiums to compound above CPI over the hold.
Questions for the listing agent
- It's been on market 53 days. Have you received any prior offers? Is the seller open to a 6% concession, seller financing, or rate buy-down credit?
- Built in 1954 — when were the roof, HVAC, electrical panel, plumbing, and water heater last replaced?
- Is there a deadline driving the sale (1031 exchange, divorce, estate, relocation)? That informs how much negotiation room exists.
- Schools are D-rated, which usually means shorter tenancies and higher turnover. Who's the typical renter profile here, and what's been the actual vacancy rate?
- What's the average days-on-market for RENTAL listings here right now (not sales)? A rising rental-DOM trend means longer vacancies and softer asking-rent achievability than the comps imply.
- What's the recent tenant-quality profile in this submarket — average credit score on applications, eviction rate, late-payment / NSF rate, and stable-employment percentage? A property-management company in the area should have these aggregated.
- How much new for-sale + rental construction is in the pipeline within 1–3 miles? Heavy new supply typically softens prices + rents 12–24 months out; constrained supply supports both.
Investment metrics
- 1% rule
- 0.94% ✗
- Cap rate
- 7.91%
- Cash-on-cash
- 5.77%
- DSCR
- 1.26
- GRM
- 8.9
CMA / ARV
- ARV (on-the-fly)
- $560,714
- Comps found
- 4
Show comp detail 4 sales within ~0.75 mi
| Address | Dist | Beds/Ba | Sqft | Sold | Price | $/sf | Match |
|---|---|---|---|---|---|---|---|
| 1460 NW 3rd Ter | 0.03mi | 4/2.5 (+1) | 1,634 (-4%) | 4mo | $350,000 | $214 | 82 |
| 1121 NW 4th Ave | 0.29mi | 4/3.0 (+1) | 1,618 (-4%) | 15mo | $535,000 | $331 | 57 |
| 631 NW 18 Ct | 0.65mi | 4/2.0 (+1) | 1,739 (+3%) | 4mo | $616,000 | $354 | 56 |
| 1538 NW 7th Ln | 0.47mi | 4/2.0 (+1) | 1,809 (+7%) | 10mo | $530,000 | $293 | 54 |
Match score weights: distance 35% · size 25% · config 20% · recency 20%. Top-matched comps best support the ARV.
Projected returns pro-forma
-3.0% appreciation · 2.12% rent growth · sell at horizon
- IRR
- -8.3%
- Equity multiple
- 0.70×
- Total profit
- $-29,733
- Equity at exit
- $52,171
- IRR
- 0.1%
- Equity multiple
- 1.01×
- Total profit
- $554
- Equity at exit
- $30,253
Cash invested: $97,972 (down + closing). Projections, not guarantees.
Landlord ↔ Tenant lean methodology
- Overall (STATE)
- 87 Strongly Landlord-Friendly
- State Florida
- 87 Strongly Landlord-Friendly · R+3
- County
- — inherits STATE
- City
- — inherits STATE
ZIP-level market 33060
- Home prices YoY
- -23.6%
- Rents YoY
- 2.1%
- Active inventory
- 339
- Price-to-rent
- 8.9×
Monthly cashflow live
- Estimated rent
- $3,288 high interval (Pro) →
- Mortgage (P&I)
- −$1,835
- Tax from tax record
- −$146 /mo · $1,749/yr
- Insurance
- −$146
- HOA
- −$0
- Vacancy / Maint / Mgmt
- −$690
- Net cashflow
- $471
Break-even live
Sensitivity live
| Price | -10% $669 | -5% $570 | +0% $471 | +5% $372 | +10% $273 |
|---|---|---|---|---|---|
| Rent | -10% $211 | -5% $341 | +0% $471 | +5% $601 | +10% $730 |
| Rate | -1.0pp $647 | -0.5pp $560 | base $471 | +0.5pp $380 | +1.0pp $288 |
UW: 25.0% down · 7.5% · 30yr · 1.5% tax · 5.0% vac · 8.0% maint · 8.0% mgmt
Financing live
Cash to close
- Down payment
- $87,475
- Closing costs
- $10,497
- Reserves months
- —
- Total cash needed
- —
Loan-product check · same deal, 3 products live
Conventional
25% down · 7.5% · 30yr
- Down + closing
- —
- Monthly P&I
- —
- Monthly cashflow
- —
- DSCR
- —
- Eligible?
- —
Personal DTI + credit; lowest rate.
DSCR
20% down · 8.5% · 30yr
- Down + closing
- —
- Monthly P&I
- —
- Monthly cashflow
- —
- DSCR
- —
- Eligible?
- —
No personal income docs; deal must DSCR.
Hard money
10% down · 12.0% · 12mo
- Down + closing
- —
- Monthly P&I
- —
- Monthly cashflow
- —
- DSCR
- —
- Eligible?
- —
Short-term bridge; refi at stabilization.
Rent comps 40 comps
| Address | Beds | Baths | Sqft | Rent | $/sqft | DOM | Units | Dist |
|---|---|---|---|---|---|---|---|---|
| 981 NW 4th Ave Pompano Beach, FL | 4.0 | 2.0 | 1520 | $3,234 | $2.13 | 26d | 1 | 0.37mi |
| 981 NW 4th Ave Pompano Beach, FL | 4.0 | 2.0 | 1530 | $3,997 | $2.61 | 26d | 1 | 0.37mi |
| 880 NW 3rd Way Unit 880 Pompano Beach, FL | 3.0 | 2.5 | 1597 | $3,600 | $2.25 | 26d | 1 | 0.43mi |
| 880 NW 3rd Way Unit 880 Pompano Beach, FL | 3.0 | 2.5 | 1597 | $3,600 | $2.25 | 9d | 1 | 0.43mi |
| 844 NW 3rd Way Unit 844 Pompano Beach, FL | 3.0 | 2.5 | 1621 | $3,500 | $2.16 | 26d | 1 | 0.46mi |
| 844 NW 3rd Way Unit 844 Pompano Beach, FL | 3.0 | 2.5 | 1621 | $3,500 | $2.16 | 12d | 1 | 0.46mi |
| 861 NW 6th Ave Pompano Beach, FL | 4.0 | 2.0 | 1528 | $3,652 | $2.39 | 26d | 1 | 0.48mi |
| 861 NW 6th Ave Unit 1 Pompano Beach, FL | 4.0 | 2.0 | 1528 | $3,652 | $2.39 | 0d | 1 | 0.48mi |
| 816 NW 3rd Ter Unit 818 Pompano Beach, FL | 3.0 | 2.5 | 1597 | $3,350 | $2.10 | 7d | 1 | 0.48mi |
| 816 NW 3rd Ter Unit 818 Pompano Beach, FL | 3.0 | 2.5 | 1597 | $3,350 | $2.10 | 26d | 1 | 0.48mi |
| 774 NW 16th Pl Pompano Beach, FL | 3.0 | 2.0 | 1446 | $3,000 | $2.07 | 26d | 1 | 0.49mi |
| 1670 NE 1st Ave Pompano Beach, FL | 3.0 | 2.0 | 1200 | $3,300 | $2.75 | 26d | 1 | 0.52mi |
| 920 NW 8th Ave Unit 3 Pompano Beach, FL | 2.0 | 1.5 | 1150 | $1,900 | $1.65 | 13d | 1 | 0.53mi |
| 720 NW 6th Ave Unit 5 Pompano Beach, FL | 2.0 | 1.0 | 2026 | $1,900 | $0.94 | 26d | 1 | 0.54mi |
| 704 NW 3rd Ave Pompano Beach, FL | 3.0 | 1.0 | 1156 | $2,600 | $2.25 | 26d | 1 | 0.55mi |
| 1731 NE 1st Ave Pompano Beach, FL | 4.0 | 2.0 | 1848 | $3,500 | $1.89 | 26d | 1 | 0.57mi |
| 1881 NW 5th Ter Pompano Beach, FL | 3.0 | 2.0 | 1152 | $3,400 | $2.95 | 9d | 1 | 0.61mi |
| 1881 NW 5th Ter Unit 1881 Pompano Beach, FL | 3.0 | 2.0 | 1152 | $3,400 | $2.95 | 26d | 1 | 0.61mi |
| 612 NW 6th Ave Pompano Beach, FL | 4.0 | 2.0 | 1750 | $3,700 | $2.11 | 7d | 1 | 0.61mi |
| 10 NW 19th St Pompano Beach, FL | 4.0 | 2.0 | 1215 | $2,990 | $2.46 | 26d | 1 | 0.62mi |
| 171 NW 19th St Pompano Beach, FL | 3.0 | 2.0 | 1215 | $3,250 | $2.67 | 26d | 1 | 0.63mi |
| 812 NE 4th Ave Pompano Beach, FL | 2.0 | 2.0 | 1056 | $3,000 | $2.84 | 16d | 1 | 0.71mi |
| 1921 NE 2nd Ave Pompano Beach, FL | 3.0 | 2.0 | 1261 | $2,960 | $2.35 | 23d | 1 | 0.72mi |
| 200 NE 1st Ave Pompano Beach, FL | 2.0 | 1.0–2.5 | 1149 | $3,600 | $3.13 | 0d | 47 | 0.89mi |
| 939 NW 3rd St Unit 939 Pompano Beach, FL | 3.0 | 2.5 | 1597 | $3,300 | $2.07 | 26d | 1 | 0.90mi |
| 939 NW 3rd St Unit 939 Pompano Beach, FL | 3.0 | 2.5 | 1597 | $3,100 | $1.94 | 0d | 1 | 0.90mi |
| 20 NW 7th Ave #6 Pompano Beach, FL | 3.0 | 1.5 | 1088 | $2,150 | $1.98 | 16d | 1 | 0.94mi |
| 909 NE 7th St Pompano Beach, FL | 3.0 | 2.0 | 1152 | $5,000 | $4.34 | 5d | 1 | 1.01mi |
| 909 NE 7th St Pompano Beach, FL | 3.0 | 2.0 | 1152 | $5,000 | $4.34 | 26d | 1 | 1.01mi |
| 425 NE 1st St Pompano Beach, FL | 4.0 | 3.5 | 1864 | $3,900 | $2.09 | 5d | 1 | 1.03mi |
| 425 NE 1st St Pompano Beach, FL | 4.0 | 3.5 | 1864 | $3,900 | $2.09 | 22d | 1 | 1.03mi |
| 425 NE 1st St Pompano Beach, FL | 4.0 | 3.5 | 1864 | $3,700 | $1.98 | 3d | 1 | 1.03mi |
| 310 Leisure Blvd Pompano Beach, FL | 2.0 | 2.0 | 1331 | $2,250 | $1.69 | 26d | 1 | 1.06mi |
| 38 Leisure Blvd Pompano Beach, FL | 2.0 | 2.0 | 1248 | $2,400 | $1.92 | 15d | 1 | 1.07mi |
| 38 Leisure Blvd Pompano Beach, FL | 2.0 | 2.0 | 1248 | $2,400 | $1.92 | 16d | 1 | 1.07mi |
| 218 SW 1st Ct Pompano Beach, FL | 2.0 | 2.0 | 1912 | $2,100 | $1.10 | 26d | 1 | 1.11mi |
| 475 SE 1st St Pompano Beach, FL | 3.0 | 1.0–2.0 | 1017 | $4,345 | $4.27 | 0d | 17 | 1.15mi |
| 613 NW 15th Ave Unit 1-E Pompano Beach, FL | 2.0 | 1.0 | 2246 | $1,750 | $0.78 | 26d | 1 | 1.16mi |
| 1204 NE 7th St Pompano Beach, FL | 3.0 | 2.0 | 1747 | $6,200 | $3.55 | 26d | 1 | 1.17mi |
| 111 SE 7th Ave Pompano Beach, FL | 4.0 | 3.5 | 2161 | $3,900 | $1.80 | 26d | 1 | 1.28mi |
Listing history 23 events
-
2026-06-21days on market $349,900 Active 53 DOM
-
2026-06-18days on market $349,900 Active 50 DOM
-
2026-06-17days on market $349,900 Active 49 DOM
-
2026-06-16days on market $349,900 Active 48 DOM
-
2026-06-15days on market $349,900 Active 47 DOM
-
2026-06-13days on market $349,900 Active 45 DOM
-
2026-06-09days on market $349,900 Active 41 DOM
-
2026-06-08days on market $349,900 Active 40 DOM
-
2026-06-07days on market $349,900 Active 39 DOM
-
2026-06-04remarks 654-char remark
-
2026-06-04statusdays on market $349,900 Active 36 DOM
-
2026-06-03days on market $349,900 Active Under Contract 35 DOM
-
2026-06-02days on market $349,900 Active Under Contract 34 DOM
-
2026-06-01days on market $349,900 Active Under Contract 33 DOM
-
2026-05-31days on market $349,900 Active Under Contract 32 DOM
-
2026-05-15status Active
-
2026-05-08historical Active Under Contract
-
2026-04-29$349,900 Active
-
2025-08-05historical
-
2025-06-24$350,000 Active
-
2025-01-21historical
-
2024-11-25$350,000 Active
-
2024-07-01soldstatus $350,000
ⓘ Source: listings_history table (triggers on properties + properties_extension) + one-shot
backfill from property_details.listing_events for pre-trigger history.
Tax reassessment forecast FL · Resets to sale price
- Current annual tax
- $1,749 · $146/mo
- Projected year-2 tax
- $2,904 · $242/mo
- Expected delta
- +$1,155/yr (+$96/mo · 66.1%)
ⓘ Screening estimate from a state-policy table — verify with the county assessor before closing.
Climate risk First Street
- Flood 1/10 Low FEMA zone X (shaded) · 0% chance over 30 yrs
- Wildfire 1/10 Low
- Heat 10/10 Extreme 7 d/yr ≥106°F today · 27 d/yr by 30 yrs out
- Wind 10/10 Extreme 99% chance of damaging wind over 30 yrs
- Air quality 2/10 Low 1 unhealthy d/yr today · 2 by 30 yrs out
Nearby sold comps map
Loading sold comps map…
Walkable amenities ~0.75 mi
Loading nearby amenities…
Taxation est. · year 1
- Rental income
- $39,451
- − Mortgage interest
- −$19,600
- − Property taxes
- −$1,749
- − Insurance
- −$1,750
- − Repairs & maintenance
- −$3,156
- − Management
- −$3,156
- − Depreciation
- −$10,179
- Taxable loss
- −$138
- Est. tax savings @ 24.0%
- +$33
- After-tax cash flow
- $5,682/yr
For passive investors: Depreciation is non-cash, so a rental often shows a tax loss while cash-flowing — sheltering income. Rental losses are passive: they offset passive income freely, and up to $25,000/yr can offset ordinary (W-2) income if you actively participate and your MAGI is under $100k (phasing out to $0 by $150k); unused losses carry forward. On sale, claimed depreciation is recaptured at up to 25%, and gains may owe capital-gains tax (a 1031 exchange can defer both). Figures are a year-1 estimate at your 24.0% rate — not tax advice; consult a CPA.
Schools (NCES district)
- District
- Broward
- NCES district ID
- 1200180
- Math proficiency
- 42% ▼ -18.00%
- Reading proficiency
- 53% ▼ -5.00%
- Median HH income
- $52,139
- Composite
- 40.88/100
- National rank
- #3621
- State rank
- #46 of 73 in FL
Livability — Pompano Beach
- Score
- 74/100
- State rank
- #284
- US rank
- #4541
Category grades
Schools grade is shown separately in the Schools card above.
Census & demographics
- Census place
- Pompano Beach, FL
- County
- Broward County · 1,963,430 people
- City population
- 155,861
- Metro
- Miami-Fort Lauderdale-Pompano Beach, FL
- Population (ZIP)
- 37,233
- Household income
- $64,819
- Rent vs Own
- Severe rent burden
- 2870.0
Population outlook (Broward County) Hauer SSP2
- Today (2025)
- 2,207,033 people
- By 2030
- 2,360,704 · +7.0%
- By 2040
- 2,661,208 · +20.6%
- By 2050
- 2,946,698 · +33.5%
- By 2075
- 3,602,273 · +63.2%
- By 2100
- 3,970,984 · +79.9%
Race, ethnicity, and origin ACS 2023
- Neighborhood character
- Diverse neighborhood (Simpson 0.69)
- Race & ethnicity
- Black 38% White 33% Hispanic / Latino 26% Two or more races 14%
- Hispanic origin (detail)
- Mexican 9% Puerto Rican 2% Cuban 3% Dominican 1%
- Common ancestry
- Hispanic 13% Romanian 2% Slovak 1%
- Foreign-born
- 31% · Canada, Jamaica
- Languages at home
- 60% English-only · Spanish 23% French/Haitian/Cajun 13% Other Indo-European 2%
Political lean MEDSL · Broward
- 2024 margin
- D (+17.0) · D 58.0% · R 41.0%
- 2008→2024 swing
- -17.8pp toward R · 2008: 34.7pp · 2024: 17.0pp
- All cycles
- 2024: D+17.0 2020: D+29.8 2016: D+35.0 2012: D+34.9 2008: D+34.7
Not yet ingested
- Civics
- —
Market trends
- HPI YoY
- ▼ -131.09%
- Current HPI
- 425.3083
- Rent YoY
- ▲ 2.12%
- Metro
- Miami-Fort Lauderdale-Pompano Beach, FL
- State GDP YoY
- ▲ 3.28%
- F500 in state
- 36
Industry mix (Fortune 500 HQ in FL)
| Industry | F500 HQs | Revenue |
|---|---|---|
| Industrial Technology | 2 | $29B |
|
||
| Insurance | 2 | $17B |
|
||
| Retail | 1 | $60B |
|
||
| Technology Distribution | 1 | $58B |
|
||
| Homebuilding | 1 | $35B |
|
||
| Technology Manufacturing | 1 | $35B |
|
||
Price history
-0.0% since first listed8 events — show timeline
- 2026-05-15 Relisted — MARMLS
- 2026-05-08 Contingent — MARMLS
- 2026-04-29 Listed $349,900 MARMLS
- 2025-08-05 Listing Removed — MARMLS
- 2025-06-24 Listed $350,000 MARMLS
- 2025-01-21 Listing Removed — MARMLS
- 2024-11-25 Listed $350,000 MARMLS
- 2024-07-01 Sold (Public Records) $350,000 Public Records
Property tax history
+6.4%/yrLatest (2025): $1,749 · +1.2% YoY. Source: county tax records.
Cash-flow waterfall
monthlySold comps — $/sqft
last 12 mo · ≤1 miLoading sold comps…