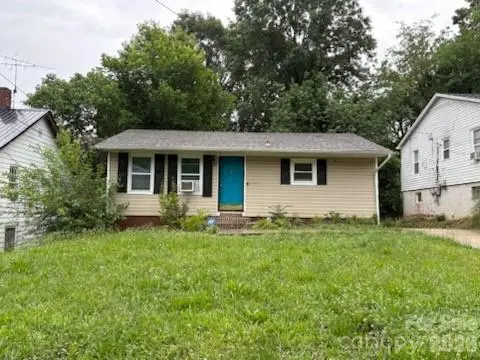
38 8th Avenue Dr SE · Hickory, NC
Flood risk 1/10 · Minimal
- FEMA flood zone
- X (unshaded)
- Chance of flooding over 30 yrs
- 0.0%
- Est. flood insurance / yr
- $473 – $860
Fire risk 1/10 · Minimal
- Est. fire insurance / yr
- $906 – $1,684
Heat risk 5/10 · Moderate
- Hot days now (above 103°F)
- 7 days/yr
- Hot days in 30 yrs
- 17 days/yr
Wind risk 2/10 · Minimal
- Chance of severe wind over 30 yrs
- 2.0%
Air-quality risk 3/10 · Minor
- Unhealthy air days now
- 2 days/yr
- Unhealthy air days in 30 yrs
- 2 days/yr
Risk factors via First Street. Map © Google.
Why this score? — see what drove the B+ grade
The composite is a weighted blend of 9 inputs, each scored 0–100. Each bar is that input's sub-score; the figure is the points it added to the 100-point composite (weight × sub-score).
- Cash flow +30.0/30.0
- ARV discount +15.0/15.0
- DSCR +10.0/10.0
- 1% rule +8.2/10.0
- Schools +3.6/10.0
- Livability +3.6/5.0
- Rent growth +3.5/5.0
- Condition / age +2.5/5.0
- Appreciation +0.0/10.0
$95,000
🖨 Deal sheet (PDF) 📄 Offer letter ✓ Due diligence
Listing remarks MLS
Come visit this cozy home just around the corner from Downtown Hickory! 2 bedrooms and 1 full bathroom located on the main floor. The home has a full basement with plenty of flex space or potential extra living area. The basement offers an exit to the back yard for easy access to and from the back yard and is currently heated using space heaters. At .24+/- acres this backyard gives you plenty of space to entertain. The Outbuilding is perfect for projects and a workspace! This home is located just a short drive to The Catawba Science Center, parks, restaurants, and more! Access to I-40 and Highway 321 are close by. This property could make for a great starter home or an investment property.
Key facts
- 0.23 acre lot
- Built 1957
- Listed 14 days
Tags
Property features AI
Finance
- HOA & community: No HOA
Exterior
- Parking: Driveway parking
- Utilities: City water; Public sewer
- Home design: Single-family residential; Site-built construction; One level; R-4 zoning
- Construction: Vinyl exterior; Basement foundation; Built on site
- Exterior features: Concrete and paved driveway and road access; Publicly maintained road; Yard with shed(s)
Interior
- Kitchen: Electric range; Microwave; Refrigerator
- Bedrooms: 2 bedrooms on the main level
- Bathrooms: 1 full bathroom on the main level
- Heating & cooling: No central heating listed; Window unit(s) for cooling
- Interior features: 6 total rooms; Full basement
- Laundry & utility: Laundry in basement
Neighborhood map
What this means for you Summary
Snapshot
- This is a 2-bed/1.0-bath single-family listed at $95k.
Deal economics
- At list price, monthly cash flow is $385 ($5k/yr) — positive.
- The deal already cash-flows at list — no discount required.
- Meets the 1% rule at list price ($1k rent vs $95k).
- Cap rate 11.2% vs local median 2.9% in Hickory — top-decile yield for the area; either an underpriced asset or a hidden risk that comps aren't pricing in. Stress-test before assuming the spread holds.
Location & tenants
- Location reads 71/100 on livability (#92 in NC) — a middle-class / working-renter tenant base. Strengths: cost of living A+, housing A+, health & safety A+; Watch: crime F, amenities F, commute F.
- Hickory City Schools (urban): math 43% / reading 44% proficiency, ranked #95 of 178 in NC (top 53%) — families likely to look elsewhere, expect single-tenant / working-renter base with shorter leases.
- Zoned schools: Hickory High (math 44% / reading 56%, grade D+, #309 of 535 statewide, top 58%, 1,014 students, 62% FRL).
- Market conditions: Rents rising fast (+4.2%/yr); 212 active listings in the ZIP; 9 comparable units currently listed for rent nearby; rentals at typical pace (median 15d on market — plan ~3-4 weeks tenant-placement turnaround); 2,016 units permitted in Catawba County in 2024 (255 in 5+ unit buildings).
Forward outlook
- Local home prices are declining (-3.0%/yr); year-one equity from $657 of loan paydown is wiped out by about $3k of value loss. Plan a longer hold.
- Catawba County population projected to shrink 7% by 2050 — rents likely to lag national; underwrite the cash flow, not the appreciation.
- At projected returns (-3.0% appreciation + 4.2% rent growth), your $27k cash investment doubles in ~7 years — after that, you're playing with house money.
Negotiation context
- Only 14 days on market — expect competitive offers; lowballing is unlikely to land.
- 6 sale attempts since 7y ago with the ask held roughly flat each time — persistent listings suggest the price (not the market) is what's stuck; bring a comps-based counter.
Risks & watch-outs
- Watch-outs: built in 1957 — expect roof / HVAC / electrical / plumbing capex.
- Climate carrying-cost: extreme-heat days projected 7→17/yr by 2055 (HVAC capex compounding) — expect insurance premiums to compound above CPI over the hold.
Questions for the listing agent
- Built in 1957 — when were the roof, HVAC, electrical panel, plumbing, and water heater last replaced?
- Is there a deadline driving the sale (1031 exchange, divorce, estate, relocation)? That informs how much negotiation room exists.
- Crime grade is F in this area — have there been break-ins, vandalism, or insurance claims at this property in the last 3 years? What carrier currently insures it and at what premium?
- What's the average days-on-market for RENTAL listings here right now (not sales)? A rising rental-DOM trend means longer vacancies and softer asking-rent achievability than the comps imply.
- What's the recent tenant-quality profile in this submarket — average credit score on applications, eviction rate, late-payment / NSF rate, and stable-employment percentage? A property-management company in the area should have these aggregated.
- How much new for-sale + rental construction is in the pipeline within 1–3 miles? Heavy new supply typically softens prices + rents 12–24 months out; constrained supply supports both.
Investment metrics
- 1% rule
- 1.32% ✓
- Cap rate
- 11.15%
- Cash-on-cash
- 17.36%
- DSCR
- 1.77
- GRM
- 6.3
CMA / ARV
- ARV (on-the-fly)
- $134,400
- Comps found
- 6
Show comp detail 6 sales within ~0.75 mi
| Address | Dist | Beds/Ba | Sqft | Sold | Price | $/sf | Match |
|---|---|---|---|---|---|---|---|
| 450 2nd Street Pl SE | 0.23mi | 2/1.0 | 720 (-6%) | 7mo | $176,000 | $244 | 73 |
| 119 4th Avenue Ct SW | 0.31mi | 1/1.0 (-1) | 798 (+4%) | 18mo | $107,000 | $134 | 59 |
| 948 3rd Street Ct SW | 0.38mi | 2/1.0 | 833 (+8%) | 12mo | $132,500 | $159 | 58 |
| 244 6th Ave SW | 0.31mi | 3/1.0 (+1) | 838 (+9%) | 9mo | $170,000 | $203 | 58 |
| 812 4th Street Pl SE | 0.33mi | 2/1.0 | 838 (+9%) | 24mo | $135,800 | $162 | 50 |
| 626 1st Ave SE | 0.73mi | 2/1.0 | 815 (+6%) | 9mo | $143,000 | $175 | 48 |
Match score weights: distance 35% · size 25% · config 20% · recency 20%. Top-matched comps best support the ARV.
Projected returns pro-forma
-3.0% appreciation · 4.16% rent growth · sell at horizon
- IRR
- 10.0%
- Equity multiple
- 1.40×
- Total profit
- $10,590
- Equity at exit
- $14,165
- IRR
- 20.0%
- Equity multiple
- 2.77×
- Total profit
- $46,982
- Equity at exit
- $8,214
Cash invested: $26,600 (down + closing). Projections, not guarantees.
Landlord ↔ Tenant lean methodology
- Overall (STATE)
- 85 Strongly Landlord-Friendly
- State North Carolina
- 85 Strongly Landlord-Friendly · R+3
- County
- — inherits STATE
- City
- — inherits STATE
ZIP-level market 28602
- Home prices YoY
- -13.6%
- Rents YoY
- 4.2%
- Active inventory
- 212
- Price-to-rent
- 6.3×
Monthly cashflow live
- Estimated rent
- $1,259 high interval (Pro) →
- Mortgage (P&I)
- −$498
- Tax from tax record
- −$72 /mo · $861/yr
- Insurance
- −$40
- HOA
- −$0
- Vacancy / Maint / Mgmt
- −$264
- Net cashflow
- $385
Break-even live
Sensitivity live
| Price | -10% $439 | -5% $412 | +0% $385 | +5% $358 | +10% $331 |
|---|---|---|---|---|---|
| Rent | -10% $285 | -5% $335 | +0% $385 | +5% $435 | +10% $484 |
| Rate | -1.0pp $433 | -0.5pp $409 | base $385 | +0.5pp $360 | +1.0pp $335 |
UW: 25.0% down · 7.5% · 30yr · 1.5% tax · 5.0% vac · 8.0% maint · 8.0% mgmt
Financing live
Cash to close
- Down payment
- $23,750
- Closing costs
- $2,850
- Reserves months
- —
- Total cash needed
- —
Loan-product check · same deal, 3 products live
Conventional
25% down · 7.5% · 30yr
- Down + closing
- —
- Monthly P&I
- —
- Monthly cashflow
- —
- DSCR
- —
- Eligible?
- —
Personal DTI + credit; lowest rate.
DSCR
20% down · 8.5% · 30yr
- Down + closing
- —
- Monthly P&I
- —
- Monthly cashflow
- —
- DSCR
- —
- Eligible?
- —
No personal income docs; deal must DSCR.
Hard money
10% down · 12.0% · 12mo
- Down + closing
- —
- Monthly P&I
- —
- Monthly cashflow
- —
- DSCR
- —
- Eligible?
- —
Short-term bridge; refi at stabilization.
Rent comps 9 comps
| Address | Beds | Baths | Sqft | Rent | $/sqft | DOM | Units | Dist |
|---|---|---|---|---|---|---|---|---|
| 211 8th Avenue Dr SE Apt 3 Hickory, NC | 2.0 | 1.0 | 736 | $1,100 | $1.49 | 14d | 1 | 0.12mi |
| 1020 3rd St SE Hickory, NC | 1.0 | 1.0 | 625 | $900 | $1.44 | 22d | 1 | 0.27mi |
| 1051 3rd St SE Unit 1069 Hickory, NC | 2.0 | 1.5 | 963 | $1,325 | $1.38 | 14d | 1 | 0.31mi |
| 347 4th St SE Unit 3A Hickory, NC | 2.0 | 1.0 | 728 | $1,100 | $1.51 | 14d | 1 | 0.43mi |
| 1 N Center St Hickory, NC | 1.0–2.0 | 1.0–2.0 | 991 | $2,344 | $2.36 | 14d | 6 | 0.66mi |
| 723 Highland Ave SE Hickory, NC | 2.0 | 1.0 | 985 | $1,500 | $1.52 | 22d | 1 | 0.91mi |
| 1620 2nd St SW Hickory, NC | 3.0 | 1.0 | 1054 | $1,350 | $1.28 | 4d | 1 | 1.18mi |
| 1131 3rd Ave SW Hickory, NC | 2.0 | 1.5 | 1024 | $1,100 | $1.07 | 14d | 1 | 1.27mi |
| 818 2nd Street Pl NE Hickory, NC | 1.0–2.0 | 1.0–1.5 | 875 | $1,306 | $1.49 | 14d | 6 | 1.46mi |
Listing history 13 events
-
2026-06-16status $95,000 Pending 14 DOM
-
2026-06-16days on market $95,000 Active Under Contract 14 DOM
-
2026-06-15days on market $95,000 Active Under Contract 13 DOM
-
2026-06-14days on market $95,000 Active Under Contract 11 DOM
-
2026-06-13statusdays on market $95,000 Active Under Contract 10 DOM
-
2026-06-10days on market $95,000 Active 8 DOM
-
2026-06-09days on market $95,000 Active 7 DOM
-
2026-06-09remarks 699-char remark
-
2026-06-08days on market $95,000 Active 6 DOM
-
2026-06-07days on market $95,000 Active 5 DOM
-
2026-06-05days on market $95,000 Active 2 DOM
-
2026-06-03remarks 631-char remark
-
2026-06-03$95,000 Active 1 DOM
ⓘ Source: listings_history table (triggers on properties + properties_extension) + one-shot
backfill from property_details.listing_events for pre-trigger history.
Tax reassessment forecast NC · Resets to sale price
- Current annual tax
- $861 · $72/mo
- Projected year-2 tax
- $861 · $72/mo
- Expected delta
- $0/yr ($0/mo · 0.0%)
ⓘ Screening estimate from a state-policy table — verify with the county assessor before closing.
Climate risk First Street
- Flood 1/10 Low FEMA zone X (unshaded) · 0% chance over 30 yrs
- Wildfire 1/10 Low
- Heat 5/10 Major 7 d/yr ≥103°F today · 17 d/yr by 30 yrs out
- Wind 2/10 Low 2% chance of damaging wind over 30 yrs
- Air quality 3/10 Moderate 2 unhealthy d/yr today · 2 by 30 yrs out
Nearby sold comps map
Loading sold comps map…
Walkable amenities ~0.75 mi
Loading nearby amenities…
Taxation est. · year 1
- Rental income
- $15,104
- − Mortgage interest
- −$5,321
- − Property taxes
- −$861
- − Insurance
- −$475
- − Repairs & maintenance
- −$1,208
- − Management
- −$1,208
- − Depreciation
- −$2,764
- Taxable income
- $3,266
- Est. tax owed @ 24.0%
- −$784
- After-tax cash flow
- $3,834/yr
For passive investors: Depreciation is non-cash, so a rental often shows a tax loss while cash-flowing — sheltering income. Rental losses are passive: they offset passive income freely, and up to $25,000/yr can offset ordinary (W-2) income if you actively participate and your MAGI is under $100k (phasing out to $0 by $150k); unused losses carry forward. On sale, claimed depreciation is recaptured at up to 25%, and gains may owe capital-gains tax (a 1031 exchange can defer both). Figures are a year-1 estimate at your 24.0% rate — not tax advice; consult a CPA.
Schools (NCES district)
- District
- Hickory City Schools
- NCES district ID
- 3702190
- Math proficiency
- 43% ▲ 2.00%
- Reading proficiency
- 44% ▼ -1.00%
- Median HH income
- $38,399
- Composite
- 36.29/100
- National rank
- #4700
- State rank
- #95 of 178 in NC
Livability — Hickory
- Score
- 71/100
- State rank
- #92
- US rank
- #6361
Category grades
Schools grade is shown separately in the Schools card above.
Census & demographics
- Census place
- Hickory, NC
- County
- Catawba County · 105,763 people
- City population
- 84,442
- Metro
- Hickory-Lenoir-Morganton, NC
- Population (ZIP)
- 31,113
- Household income
- $62,048
- Rent vs Own
- Severe rent burden
- 642.0
Population outlook (Catawba County) Hauer SSP2
- Today (2025)
- 156,513 people
- By 2030
- 155,267 · -0.8%
- By 2040
- 151,110 · -3.5%
- By 2050
- 145,524 · -7.0%
- By 2075
- 134,047 · -14.4%
- By 2100
- 119,424 · -23.7%
Race, ethnicity, and origin ACS 2023
- Neighborhood character
- Predominantly White (70%)
- Race & ethnicity
- White 70% Black 12% Hispanic / Latino 10% Two or more races 7% Asian 6%
- Hispanic origin (detail)
- Mexican 7%
- Common ancestry
- Slovak 3% Italian 3% Iranian 2%
- Foreign-born
- 6% · Canada, Dominican Republic
- Languages at home
- 88% English-only · Spanish 7% Other Asian/Pacific 4%
Political lean MEDSL · Catawba
- 2024 margin
- Solid R (+38.0) · D 30.6% · R 68.6%
- 2008→2024 swing
- -13.0pp toward R · 2008: -25.0pp · 2024: -38.0pp
- All cycles
- 2024: R+38.0 2020: R+37.0 2016: R+38.0 2012: R+29.6 2008: R+25.0
Not yet ingested
- Civics
- —
Market trends
- HPI YoY
- ▼ -41.01%
- Current HPI
- 259.947
- Rent YoY
- ▲ 4.16%
- Metro
- Hickory-Lenoir-Morganton, NC
- State GDP YoY
- ▲ 3.28%
- F500 in state
- 26
Industry mix (Fortune 500 HQ in NC)
| Industry | F500 HQs | Revenue |
|---|---|---|
| Financial Services | 2 | $213B |
|
||
| Retail | 2 | $95B |
|
||
| Industrial Conglomerate | 1 | $38B |
|
||
| Metals / Steel | 1 | $35B |
|
||
| Utilities | 1 | $30B |
|
||
| Industrial Machinery | 1 | $19B |
|
||
Price history
+216.7% since first listed13 events — show timeline
- 2026-06-02 Listed $95,000 CANOPYMLS as Distributed by MLS Grid
- 2024-12-02 Relisted — CANOPYMLS as Distributed by MLS Grid
- 2024-10-28 Price Changed $140,000 CANOPYMLS as Distributed by MLS Grid
- 2024-09-20 Price Changed $145,000 CANOPYMLS as Distributed by MLS Grid
- 2024-09-04 Relisted — CANOPYMLS as Distributed by MLS Grid
- 2024-08-24 Listed $150,000 CANOPYMLS as Distributed by MLS Grid
- 2024-08-22 Coming Soon — CANOPYMLS as Distributed by MLS Grid
- 2023-05-10 Sold (Public Records) $135,000 Public Records
- 2023-05-10 Sold (MLS) $135,000 CANOPYMLS as Distributed by MLS Grid
- 2023-03-27 Pending — CANOPYMLS as Distributed by MLS Grid
- 2023-03-23 Listed $139,900 CANOPYMLS as Distributed by MLS Grid
- 2019-04-24 Sold (MLS) $25,000 CANOPYMLS as Distributed by MLS Grid
- 2019-03-18 Listed $30,000 CANOPYMLS as Distributed by MLS Grid
Property tax history
+7.9%/yrLatest (2024): $861 · +3.0% YoY. Source: county tax records.
Cash-flow waterfall
monthlySold comps — $/sqft
last 12 mo · ≤1 miLoading sold comps…