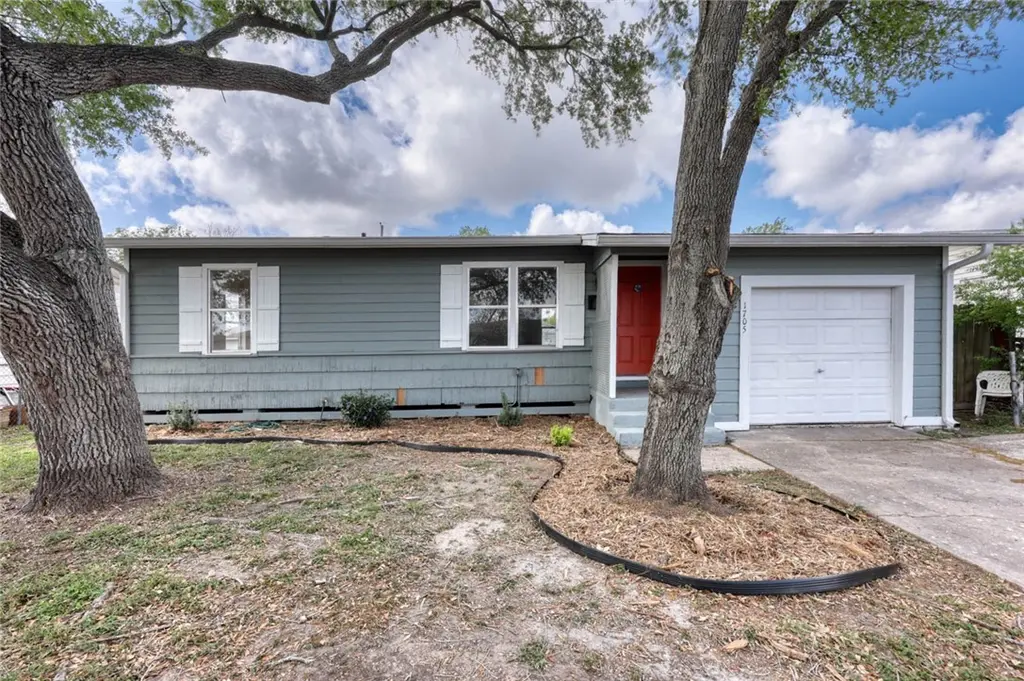
1705 Sycamore Pl · Corpus Christi, TX
Flood risk 3/10 · Minor
- FEMA flood zone
- X (shaded)
- Chance of flooding over 30 yrs
- 0.2%
- Est. flood insurance / yr
- $507 – $1,088
Fire risk 1/10 · Minimal
- Est. fire insurance / yr
- $1,222 – $2,270
Heat risk 10/10 · Severe
- Hot days now (above 107°F)
- 6 days/yr
- Hot days in 30 yrs
- 22 days/yr
Wind risk 9/10 · Severe
- Chance of severe wind over 30 yrs
- 99.0%
Air-quality risk 1/10 · Minimal
- Unhealthy air days now
- 0 days/yr
- Unhealthy air days in 30 yrs
- 0 days/yr
Risk factors via First Street. Map © Google.
Why this score? — see what drove the D grade
The composite is a weighted blend of 9 inputs, each scored 0–100. Each bar is that input's sub-score; the figure is the points it added to the 100-point composite (weight × sub-score).
- Cash flow +15.2/30.0
- Appreciation +7.2/10.0
- DSCR +4.7/10.0
- 1% rule +4.0/10.0
- Livability +3.9/5.0
- Schools +2.8/10.0
- Rent growth +2.5/5.0
- Condition / age +2.5/5.0
- ARV discount +0.0/15.0
$165,000
🖨 Deal sheet (PDF) 📄 Offer letter ✓ Due diligence
Listing remarks MLS
Welcome to 1705 Sycamore in Corpus Christi—a charming and budget-friendly opportunity you don’t want to miss! This 3-bedroom, 1-bath home offers timeless character with its original hardwood floors, bringing warmth and personality throughout the living spaces. Enjoy peace of mind with a brand new roof, giving you one less thing to worry about and adding long-term value. Whether you’re a first-time buyer, downsizing, or looking for an investment property, this home checks all the boxes with its extremely affordable price point. With a functional layout, cozy feel, and classic features, this home is full of potential and ready for its next chapter. Don’t miss your chance to own a piece of charm at a price that’s hard to beat—schedule your showing today!
Key facts
- Brand new roof
- 6,190 sq ft lot
- Garage
Tags
Neighborhood map
What this means for you Summary
Snapshot
- This is a 3-bed/1.0-bath single-family listed at $165k.
Deal economics
- At list price, monthly cash flow is $57 ($686/yr) — positive.
- The deal already cash-flows at list — no discount required.
- To meet the 1% rule (rent ≥ 1% of price), the offer needs to be $148k (10.0% below list).
- Recommended offer: $148k (10.0% below list) — sets the bar for 1% rule.
- Cap rate 6.7% vs local median 3.6% in Corpus Christi — top-decile yield for the area; either an underpriced asset or a hidden risk that comps aren't pricing in. Stress-test before assuming the spread holds.
Location & tenants
- Location reads 78/100 on livability (#66 in TX, #2,404 nationally) — a middle-class / working-renter tenant base. Strengths: commute A+, cost of living A+, housing A+; Watch: crime F.
- Corpus Christi ISD (urban): math 31% / reading 35% proficiency, ranked #562 of 826 in TX (top 68%) — families likely to look elsewhere, expect single-tenant / working-renter base with shorter leases; 63% free/reduced lunch — lower-income household profile, screen leases tightly.
- Zoned schools: Windsor Park G/T (math 85% / reading 90%, grade A+, #6 of 4,322 statewide, top 0%, 609 students, 29% FRL); Adkins Middle (math 40% / reading 39%, grade F, #660 of 1,662 statewide, top 41%, 956 students, 48% FRL); Moody H S (math 33% / reading 26%, grade F, #1,112 of 1,632 statewide, top 70%, 1,382 students, 84% FRL).
- Zoned-school proficiency averages 52% at this address vs 33% district-wide (+19 pts) — the actual schools serving this property are materially stronger than the Corpus Christi ISD average implies; a family-tenant draw the district grade alone would hide.
- Market conditions: 45 active listings in the ZIP; 8 comparable units currently listed for rent nearby; rentals at typical pace (median 16d on market — plan ~3-4 weeks tenant-placement turnaround); lower-income renter base — watch delinquency; 1,397 units permitted in Nueces County in 2024 (47 in 5+ unit buildings).
Forward outlook
- In year one you build about $8k of equity ($1k loan paydown + $7k appreciation (4.4% local appreciation)).
- Nueces County population projected at +36% by 2050 — long-run rental-demand tailwind backs the buy-and-hold thesis.
- At projected returns (4.4% appreciation + 3.0% rent growth), your $46k cash investment doubles in ~5 years — after that, you're playing with house money.
- By year 5, paydown + projected appreciation supports a ~$36k cash-out refi (75% LTV) — recoverable capital for the next deal without selling this one.
Negotiation context
- It's been on market 88 days — a 6% lower offer ($155k) is reasonable based on typical stale-listing flexibility.
Risks & watch-outs
- Watch-outs: built in 1955 — expect roof / HVAC / electrical / plumbing capex.
- Climate carrying-cost: severe wind risk, 99% chance of damaging wind over 30y; extreme-heat days projected 6→22/yr by 2055 (HVAC capex compounding) — expect insurance premiums to compound above CPI over the hold.
Questions for the listing agent
- It's been on market 88 days. Have you received any prior offers? Is the seller open to a 10% concession, seller financing, or rate buy-down credit?
- Built in 1955 — when were the roof, HVAC, electrical panel, plumbing, and water heater last replaced?
- Why hasn't it sold? Are there any deal-killer items the seller is aware of (foundation, flood, title, zoning, code violations)?
- Is there a deadline driving the sale (1031 exchange, divorce, estate, relocation)? That informs how much negotiation room exists.
- Crime grade is F in this area — have there been break-ins, vandalism, or insurance claims at this property in the last 3 years? What carrier currently insures it and at what premium?
- The area grade is low — what's the realistic commute time and amenity access for the typical tenant pool here? Any planned neighborhood developments (good or bad) we should know about?
- What's the average days-on-market for RENTAL listings here right now (not sales)? A rising rental-DOM trend means longer vacancies and softer asking-rent achievability than the comps imply.
- What's the recent tenant-quality profile in this submarket — average credit score on applications, eviction rate, late-payment / NSF rate, and stable-employment percentage? A property-management company in the area should have these aggregated.
- How much new for-sale + rental construction is in the pipeline within 1–3 miles? Heavy new supply typically softens prices + rents 12–24 months out; constrained supply supports both.
Investment metrics
- 1% rule
- 0.90% ✗
- Cap rate
- 6.71%
- Cash-on-cash
- 1.48%
- DSCR
- 1.07
- GRM
- 9.3
CMA / ARV
- ARV (median comp)
- $128,514
- List price
- $165,000
- Delta
- 28.39%
- Verdict
- OVERPRICED
- Comps
- 20 within 1.0 mi
Show comp detail 12 sales within ~0.75 mi
| Address | Dist | Beds/Ba | Sqft | Sold | Price | $/sf | Match |
|---|---|---|---|---|---|---|---|
| 1625 Birch Pl | 0.07mi | 3/1.0 | 1,124 (+2%) | 5mo | $80,000 | $71 | 89 |
| 1714 Sycamore Pl | 0.03mi | 3/1.0 | 1,086 (-2%) | 15mo | $149,900 | $138 | 83 |
| 1626 Birch Pl | 0.06mi | 4/2.0 (+1) | 1,055 (-4%) | 1mo | $155,000 | $147 | 80 |
| 4730 Orchid | 0.46mi | 3/1.5 | 1,098 (-0%) | 2mo | $159,900 | $146 | 75 |
| 4929 Dubose St | 0.35mi | 3/1.5 | 978 (-11%) | 4mo | $169,900 | $174 | 60 |
| 1605 Chula Vis | 0.71mi | 3/1.0 | 1,120 (+1%) | 9mo | $39,950 | $36 | 57 |
| 4922 Moody Dr | 0.37mi | 3/1.0 | 980 (-11%) | 9mo | $159,400 | $163 | 56 |
| 1630 Hudson St | 0.64mi | 3/2.0 | 1,040 (-6%) | 2mo | $172,999 | $166 | 55 |
| 4913 Dubose St | 0.30mi | 3/1.0 | 940 (-15%) | 8mo | $159,400 | $170 | 54 |
| 2009 Hudson St | 0.74mi | 3/2.0 | 1,043 (-6%) | 7mo | $179,900 | $172 | 47 |
| 4634 Elvira Dr | 0.61mi | 3/2.0 | 1,052 (-5%) | 17mo | $189,900 | $181 | 45 |
| 1941 Sherman St | 0.75mi | 3/2.0 | 1,158 (+5%) | 14mo | $150,500 | $130 | 41 |
Match score weights: distance 35% · size 25% · config 20% · recency 20%. Top-matched comps best support the ARV.
Projected returns pro-forma
4.38% appreciation · 3.0% rent growth · sell at horizon
- IRR
- 12.6%
- Equity multiple
- 1.78×
- Total profit
- $35,883
- Equity at exit
- $87,339
- IRR
- 13.8%
- Equity multiple
- 3.34×
- Total profit
- $108,318
- Equity at exit
- $145,870
Cash invested: $46,200 (down + closing). Projections, not guarantees.
Landlord ↔ Tenant lean methodology
- Overall (STATE)
- 87 Strongly Landlord-Friendly
- State Texas
- 87 Strongly Landlord-Friendly · R+5
- County
- — inherits STATE
- City
- — inherits STATE
ZIP-level market 78416
- Home prices YoY
- 3.2%
- Active inventory
- 45
- Price-to-rent
- 9.3×
Monthly cashflow live
- Estimated rent
- $1,485 high interval (Pro) →
- Mortgage (P&I)
- −$865
- Tax from tax record
- −$182 /mo · $2,183/yr
- Insurance
- −$69
- HOA
- −$0
- Vacancy / Maint / Mgmt
- −$312
- Net cashflow
- $57
Break-even live
Sensitivity live
| Price | -10% $151 | -5% $104 | +0% $57 | +5% $10 | +10% $-36 |
|---|---|---|---|---|---|
| Rent | -10% $-60 | -5% $-2 | +0% $57 | +5% $116 | +10% $174 |
| Rate | -1.0pp $140 | -0.5pp $99 | base $57 | +0.5pp $14 | +1.0pp $-29 |
UW: 25.0% down · 7.5% · 30yr · 1.5% tax · 5.0% vac · 8.0% maint · 8.0% mgmt
Financing live
Cash to close
- Down payment
- $41,250
- Closing costs
- $4,950
- Reserves months
- —
- Total cash needed
- —
Loan-product check · same deal, 3 products live
Conventional
25% down · 7.5% · 30yr
- Down + closing
- —
- Monthly P&I
- —
- Monthly cashflow
- —
- DSCR
- —
- Eligible?
- —
Personal DTI + credit; lowest rate.
DSCR
20% down · 8.5% · 30yr
- Down + closing
- —
- Monthly P&I
- —
- Monthly cashflow
- —
- DSCR
- —
- Eligible?
- —
No personal income docs; deal must DSCR.
Hard money
10% down · 12.0% · 12mo
- Down + closing
- —
- Monthly P&I
- —
- Monthly cashflow
- —
- DSCR
- —
- Eligible?
- —
Short-term bridge; refi at stabilization.
Rent comps 8 comps
| Address | Beds | Baths | Sqft | Rent | $/sqft | DOM | Units | Dist |
|---|---|---|---|---|---|---|---|---|
| 1458 W Point Rd Corpus Christi, TX | 2.0–3.0 | 1.0 | 777 | $980 | $1.26 | 15d | 2 | 0.26mi |
| 2041 Harvard St Corpus Christi, TX | 3.0 | 2.0 | 1230 | $1,400 | $1.14 | 15d | 1 | 0.73mi |
| 4326 Vestal St Corpus Christi, TX | 3.0 | 1.0 | 984 | $1,125 | $1.14 | 15d | 1 | 0.76mi |
| 2106 Harvard St Corpus Christi, TX | 3.0 | 1.0 | 912 | $1,225 | $1.34 | 45d | 1 | 0.77mi |
| 1837 Horne Rd Corpus Christi, TX | 3.0 | 2.0 | 1226 | $1,800 | $1.47 | 45d | 1 | 0.79mi |
| 2122 Harvard St Corpus Christi, TX | 2.0 | 1.0 | 858 | $1,250 | $1.46 | 15d | 1 | 0.80mi |
| 4313 Molina Dr Corpus Christi, TX | 2.0 | 1.0 | 904 | $1,250 | $1.38 | 45d | 1 | 1.03mi |
| 2709 Milo St Corpus Christi, TX | 3.0 | 2.0 | 1122 | $1,700 | $1.52 | 15d | 1 | 1.45mi |
Listing history 21 events
-
2026-06-21days on market $165,000 Active 88 DOM
-
2026-06-18days on market $165,000 Active 85 DOM
-
2026-06-17days on market $165,000 Active 84 DOM
-
2026-06-16days on market $165,000 Active 83 DOM
-
2026-06-15days on market $165,000 Active 82 DOM
-
2026-06-14days on market $165,000 Active 80 DOM
-
2026-06-10days on market $165,000 Active 77 DOM
-
2026-06-09days on market $165,000 Active 76 DOM
-
2026-06-08days on market $165,000 Active 75 DOM
-
2026-06-07days on market $165,000 Active 74 DOM
-
2026-06-05days on market $165,000 Active 71 DOM
-
2026-06-03days on market $165,000 Active 70 DOM
-
2026-06-02days on market $165,000 Active 69 DOM
-
2026-06-01days on market $165,000 Active 68 DOM
-
2026-05-31days on market $165,000 Active 67 DOM
-
2026-05-30days on market $165,000 Active 66 DOM
-
2026-05-11price $165,000 797-char remark
Show marketing remark (797 chars)
Welcome to 1705 Sycamore in Corpus Christi—a charming and budget-friendly opportunity you don’t want to miss! This 3-bedroom, 1-bath home offers timeless character with its original hardwood floors, bringing warmth and personality throughout the living spaces. Enjoy peace of mind with a brand new roof, giving you one less thing to worry about and adding long-term value. Whether you’re a first-time buyer, downsizing, or looking for an investment property, this home checks all the boxes with its extremely affordable price point. With a functional layout, cozy feel, and classic features, this home is full of potential and ready for its next chapter. Don’t miss your chance to own a piece of charm at a price that’s hard to beat—schedule your showing today!
-
2026-03-25$175,000 Active 797-char remark
Show marketing remark (797 chars)
Welcome to 1705 Sycamore in Corpus Christi—a charming and budget-friendly opportunity you don’t want to miss! This 3-bedroom, 1-bath home offers timeless character with its original hardwood floors, bringing warmth and personality throughout the living spaces. Enjoy peace of mind with a brand new roof, giving you one less thing to worry about and adding long-term value. Whether you’re a first-time buyer, downsizing, or looking for an investment property, this home checks all the boxes with its extremely affordable price point. With a functional layout, cozy feel, and classic features, this home is full of potential and ready for its next chapter. Don’t miss your chance to own a piece of charm at a price that’s hard to beat—schedule your showing today!
-
2016-03-23soldstatus
-
2014-01-31soldstatus
-
2013-05-01soldstatus
ⓘ Source: listings_history table (triggers on properties + properties_extension) + one-shot
backfill from property_details.listing_events for pre-trigger history.
Tax reassessment forecast TX · Resets to sale price
- Current annual tax
- $2,183 · $182/mo
- Projected year-2 tax
- $3,020 · $252/mo
- Expected delta
- +$836/yr (+$70/mo · 38.3%)
ⓘ Screening estimate from a state-policy table — verify with the county assessor before closing.
Climate risk First Street
- Flood 3/10 Moderate FEMA zone X (shaded) · 20% chance over 30 yrs
- Wildfire 1/10 Low
- Heat 10/10 Extreme 6 d/yr ≥107°F today · 22 d/yr by 30 yrs out
- Wind 9/10 Extreme 99% chance of damaging wind over 30 yrs
- Air quality 1/10 Low 0 unhealthy d/yr today · 0 by 30 yrs out
Nearby sold comps map
Loading sold comps map…
Walkable amenities ~0.75 mi
Loading nearby amenities…
Taxation est. · year 1
- Rental income
- $17,819
- − Mortgage interest
- −$9,243
- − Property taxes
- −$2,183
- − Insurance
- −$825
- − Repairs & maintenance
- −$1,426
- − Management
- −$1,426
- − Depreciation
- −$4,800
- Taxable loss
- −$2,083
- Est. tax savings @ 24.0%
- +$500
- After-tax cash flow
- $1,186/yr
For passive investors: Depreciation is non-cash, so a rental often shows a tax loss while cash-flowing — sheltering income. Rental losses are passive: they offset passive income freely, and up to $25,000/yr can offset ordinary (W-2) income if you actively participate and your MAGI is under $100k (phasing out to $0 by $150k); unused losses carry forward. On sale, claimed depreciation is recaptured at up to 25%, and gains may owe capital-gains tax (a 1031 exchange can defer both). Figures are a year-1 estimate at your 24.0% rate — not tax advice; consult a CPA.
Schools (NCES district)
- District
- Corpus Christi ISD
- NCES district ID
- 4815270
- Math proficiency
- 31% ▼ -18.00%
- Reading proficiency
- 35% ▼ -7.00%
- Median HH income
- $45,672
- Composite
- 28.27/100
- National rank
- #6793
- State rank
- #562 of 826 in TX
Livability — Corpus Christi
- Score
- 78/100
- State rank
- #66
- US rank
- #2404
Category grades
Schools grade is shown separately in the Schools card above.
Census & demographics
- Census place
- Corpus Christi, TX
- County
- Nueces County · 296,836 people
- City population
- 296,836
- Metro
- Corpus Christi, TX
- Population (ZIP)
- 12,480
- Household income
- $43,198
- Rent vs Own
- Severe rent burden
- 386.0
Population outlook (Nueces County) Hauer SSP2
- Today (2025)
- 418,037 people
- By 2030
- 447,123 · +7.0%
- By 2040
- 505,911 · +21.0%
- By 2050
- 567,522 · +35.8%
- By 2075
- 729,686 · +74.6%
- By 2100
- 847,087 · +102.6%
Race, ethnicity, and origin ACS 2023
- Neighborhood character
- Predominantly Hispanic (79%)
- Race & ethnicity
- Hispanic / Latino 79% Two or more races 38% Black 16% White 4%
- Hispanic origin (detail)
- Mexican 72%
- Foreign-born
- 12% · Canada
- Languages at home
- 50% English-only · Spanish 49%
Political lean MEDSL · Nueces
- 2024 margin
- R (+11.5) · D 43.8% · R 55.3%
- 2008→2024 swing
- -7.1pp toward R · 2008: -4.4pp · 2024: -11.5pp
- All cycles
- 2024: R+11.5 2020: R+2.9 2016: R+1.5 2012: R+3.2 2008: R+4.4
Not yet ingested
- Civics
- —
Market trends
- HPI YoY
- ▲ 4.38%
- Current HPI
- 139.6557
- Rent YoY
- —
- Metro
- Corpus Christi, TX
- State GDP YoY
- ▲ 3.95%
- F500 in state
- 110
Industry mix (Fortune 500 HQ in TX)
| Industry | F500 HQs | Revenue |
|---|---|---|
| Energy | 16 | $1,198B |
|
||
| Technology | 5 | $198B |
|
||
| Engineering / Construction | 4 | $72B |
|
||
| Energy Services | 3 | $60B |
|
||
| Utilities | 3 | $41B |
|
||
| Healthcare | 2 | $330B |
|
||
Price history
-5.7% since first listed5 events — show timeline
- 2026-05-11 Price Changed $165,000 CBMLS
- 2026-03-25 Listed $175,000 CBMLS
- 2016-03-23 Sold (Public Records) — Public Records
- 2014-01-31 Sold (Public Records) — Public Records
- 2013-05-01 Sold (Public Records) — Public Records
Property tax history
+7.8%/yrLatest (2025): $2,183 · +2.8% YoY. Source: county tax records.
Cash-flow waterfall
monthlySold comps — $/sqft
last 12 mo · ≤1 miLoading sold comps…