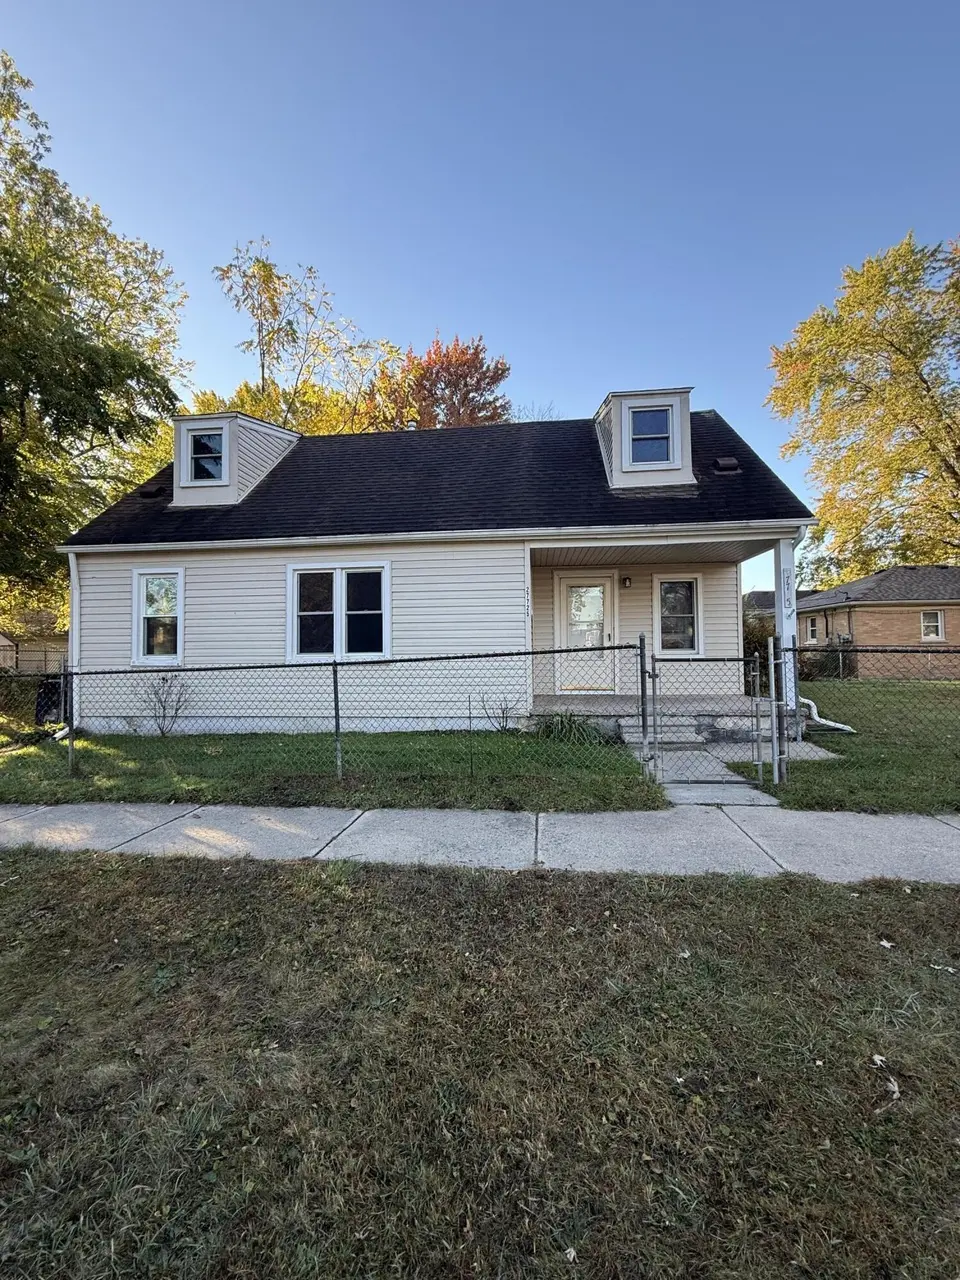
27725 Norfolk St · Livonia, MI
Flood risk 1/10 · Minimal
- FEMA flood zone
- X (unshaded)
- Chance of flooding over 30 yrs
- 0.0%
- Est. flood insurance / yr
- $507 – $1,088
Fire risk 1/10 · Minimal
- Est. fire insurance / yr
- $784 – $1,456
Heat risk 3/10 · Minor
- Hot days now (above 98°F)
- 7 days/yr
- Hot days in 30 yrs
- 15 days/yr
Wind risk 2/10 · Minimal
- Chance of severe wind over 30 yrs
- —
Air-quality risk 3/10 · Minor
- Unhealthy air days now
- 2 days/yr
- Unhealthy air days in 30 yrs
- 3 days/yr
Risk factors via First Street. Map © Google.
Why this score? — see what drove the C grade
The composite is a weighted blend of 9 inputs, each scored 0–100. Each bar is that input's sub-score; the figure is the points it added to the 100-point composite (weight × sub-score).
- Cash flow +19.4/30.0
- ARV discount +15.0/15.0
- DSCR +6.1/10.0
- 1% rule +5.2/10.0
- Livability +3.9/5.0
- Rent growth +2.5/5.0
- Condition / age +2.5/5.0
- Schools +2.2/10.0
- Appreciation +0.0/10.0
$154,900
🖨 Deal sheet (PDF) 📄 Offer letter ✓ Due diligence
Listing remarks MLS
Livonia Bungalow with 3 bedrooms with 1 bath with dining room! Move in ready. Great school district. Hardwood floors in the kitchen and the bedrooms. Large fenced corner yard!
Key facts
- Fenced corner yard
- Dining room
- Hardwood floors
Tags
Neighborhood map
What this means for you Summary
Snapshot
- This is a 3-bed/1.0-bath single-family listed at $155k.
Deal economics
- At list price, monthly cash flow is $172 ($2k/yr) — positive.
- The deal already cash-flows at list — no discount required.
- Meets the 1% rule at list price ($2k rent vs $155k).
- Recommended offer: $136k (12.0% below list) — sets the bar for market timing.
- Cap rate 7.6% vs local median 4.9% in Livonia — top-decile yield for the area; either an underpriced asset or a hidden risk that comps aren't pricing in. Stress-test before assuming the spread holds.
Location & tenants
- Location reads 77/100 on livability (#116 in MI, #2,784 nationally) — a middle-class / working-renter tenant base. Strengths: employment A+, cost of living A+, housing A+; Watch: amenities D, health & safety D, commute F.
- Clarenceville School District (urban): math 18% / reading 33% proficiency, ranked #421 of 540 in MI (top 78%) — low school quality limits family demand, transient renter base, plan for 1-2y turnover.
- Market conditions: 117 active listings in the ZIP; 16 comparable units currently listed for rent nearby; rentals at typical pace (median 25d on market — plan ~3-4 weeks tenant-placement turnaround); solid renter incomes; 2,639 units permitted in Wayne County in 2024 (1,216 in 5+ unit buildings).
Forward outlook
- Local home prices are declining (-3.0%/yr); year-one equity from $1k of loan paydown is wiped out by about $5k of value loss. Plan a longer hold.
- Wayne County population projected at -17% by 2050 — secular population decline; favor cash flow + early exit over multi-decade hold.
Negotiation context
- It's been on market 241 days — a 12% lower offer ($136k) is reasonable based on typical stale-listing flexibility.
- 16 sale attempts since 16y ago; this cycle's ask has dropped $10k (6%) from the opening price — seller is motivated, your offer sets the floor, not the list.
- Current owner paid $103k; list at $155k implies a 50% gain — meaningful room to come down on a strong offer.
Risks & watch-outs
- Watch-outs: built in 1939 — expect roof / HVAC / electrical / plumbing capex.
Questions for the listing agent
- It's been on market 241 days. Have you received any prior offers? Is the seller open to a 12% concession, seller financing, or rate buy-down credit?
- Built in 1939 — when were the roof, HVAC, electrical panel, plumbing, and water heater last replaced?
- Why hasn't it sold? Are there any deal-killer items the seller is aware of (foundation, flood, title, zoning, code violations)?
- Is there a deadline driving the sale (1031 exchange, divorce, estate, relocation)? That informs how much negotiation room exists.
- Schools are B-rated — typically a magnet for longer-tenancy family renters. What's the average tenant stay here, and is there a school-zone premium baked into asking?
- What's the average days-on-market for RENTAL listings here right now (not sales)? A rising rental-DOM trend means longer vacancies and softer asking-rent achievability than the comps imply.
- What's the recent tenant-quality profile in this submarket — average credit score on applications, eviction rate, late-payment / NSF rate, and stable-employment percentage? A property-management company in the area should have these aggregated.
- How much new for-sale + rental construction is in the pipeline within 1–3 miles? Heavy new supply typically softens prices + rents 12–24 months out; constrained supply supports both.
Investment metrics
- 1% rule
- 1.02% ✓
- Cap rate
- 7.63%
- Cash-on-cash
- 4.76%
- DSCR
- 1.21
- GRM
- 8.1
CMA / ARV
- ARV (median comp)
- $187,134
- List price
- $154,900
- Delta
- -17.22%
- Verdict
- UNDERPRICED
- Comps
- 20 within 1.0 mi
Show comp detail 12 sales within ~0.75 mi
| Address | Dist | Beds/Ba | Sqft | Sold | Price | $/sf | Match |
|---|---|---|---|---|---|---|---|
| 27440 Fargo St | 0.22mi | 3/1.0 | 1,223 (+3%) | 6mo | $195,000 | $159 | 79 |
| 20558 Seminole | 0.37mi | 3/2.0 | 1,200 (+1%) | 3mo | $204,900 | $171 | 74 |
| 19350 Antago St | 0.54mi | 3/1.0 | 1,179 (-1%) | 3mo | $215,000 | $182 | 71 |
| 20406 Floral St | 0.18mi | 2/1.0 (-1) | 1,033 (-13%) | 3mo | $175,000 | $169 | 62 |
| 20509 Poinciana | 0.37mi | 4/1.0 (+1) | 1,092 (-8%) | 4mo | $130,000 | $119 | 61 |
| 20307 Parkville St | 0.62mi | 2/2.0 (-1) | 1,200 (+1%) | 2mo | $215,000 | $179 | 59 |
| 19910 Seminole | 0.37mi | 3/1.0 | 1,026 (-14%) | 2mo | $108,000 | $105 | 58 |
| 19800 Poinciana | 0.44mi | 3/1.0 | 1,014 (-15%) | 6mo | $140,000 | $138 | 50 |
| 21208 Poinciana St | 0.72mi | 4/1.0 (+1) | 1,138 (-4%) | 7mo | $162,500 | $143 | 49 |
| 20999 Seminole St | 0.57mi | 3/1.0 | 1,359 (+14%) | 4mo | $197,000 | $145 | 46 |
| 21304 Colwell St | 0.66mi | 3/2.0 | 1,320 (+11%) | 5mo | $275,000 | $208 | 42 |
| 21122 Waldron St | 0.65mi | 2/1.0 (-1) | 1,012 (-15%) | 6mo | $148,687 | $147 | 35 |
Match score weights: distance 35% · size 25% · config 20% · recency 20%. Top-matched comps best support the ARV.
Projected returns pro-forma
-3.0% appreciation · 3.0% rent growth · sell at horizon
- IRR
- -8.9%
- Equity multiple
- 0.67×
- Total profit
- $-14,104
- Equity at exit
- $23,096
- IRR
- 0.6%
- Equity multiple
- 1.05×
- Total profit
- $1,963
- Equity at exit
- $13,393
Cash invested: $43,372 (down + closing). Projections, not guarantees.
Landlord ↔ Tenant lean methodology
- Overall (STATE)
- 62 Landlord-Friendly
- State Michigan
- 62 Landlord-Friendly · EVEN
- County
- — inherits STATE
- City
- — inherits STATE
ZIP-level market 48152
- Active inventory
- 117
- Price-to-rent
- 8.1×
Monthly cashflow live
- Estimated rent
- $1,586 high interval (Pro) →
- Mortgage (P&I)
- −$812
- Tax from tax record
- −$204 /mo · $2,449/yr
- Insurance
- −$65
- HOA
- −$0
- Vacancy / Maint / Mgmt
- −$333
- Net cashflow
- $172
Break-even live
Sensitivity live
| Price | -10% $260 | -5% $216 | +0% $172 | +5% $128 | +10% $84 |
|---|---|---|---|---|---|
| Rent | -10% $47 | -5% $110 | +0% $172 | +5% $235 | +10% $297 |
| Rate | -1.0pp $250 | -0.5pp $212 | base $172 | +0.5pp $132 | +1.0pp $91 |
UW: 25.0% down · 7.5% · 30yr · 1.5% tax · 5.0% vac · 8.0% maint · 8.0% mgmt
Financing live
Cash to close
- Down payment
- $38,725
- Closing costs
- $4,647
- Reserves months
- —
- Total cash needed
- —
Loan-product check · same deal, 3 products live
Conventional
25% down · 7.5% · 30yr
- Down + closing
- —
- Monthly P&I
- —
- Monthly cashflow
- —
- DSCR
- —
- Eligible?
- —
Personal DTI + credit; lowest rate.
DSCR
20% down · 8.5% · 30yr
- Down + closing
- —
- Monthly P&I
- —
- Monthly cashflow
- —
- DSCR
- —
- Eligible?
- —
No personal income docs; deal must DSCR.
Hard money
10% down · 12.0% · 12mo
- Down + closing
- —
- Monthly P&I
- —
- Monthly cashflow
- —
- DSCR
- —
- Eligible?
- —
Short-term bridge; refi at stabilization.
Rent comps 16 comps
| Address | Beds | Baths | Sqft | Rent | $/sqft | DOM | Units | Dist |
|---|---|---|---|---|---|---|---|---|
| 20091 Inkster Rd Livonia, MI | 2.0 | 1.0 | 756 | $1,400 | $1.85 | 6d | 1 | 0.19mi |
| 20745 Saint Francis Unit 101 Farmington Hills, MI | 2.0 | 1.0 | 900 | $1,495 | $1.66 | 44d | 1 | 0.37mi |
| 20745 Saint Francis Unit 208 Farmington Hills, MI | 2.0 | 1.0 | 900 | $1,395 | $1.55 | 15d | 1 | 0.37mi |
| 20524 Indian Redford, MI | 3.0 | 1.0 | 988 | $1,600 | $1.62 | 25d | 1 | 0.51mi |
| 20516 Denby Redford, MI | 4.0 | 1.5 | 950 | $1,800 | $1.89 | 18d | 1 | 0.58mi |
| 19354 Seminole Redford, MI | 3.0 | 1.0 | 1050 | $1,450 | $1.38 | 25d | 1 | 0.61mi |
| 28532 Grayling Ave Farmington Hills, MI | 2.0 | 1.0 | 700 | $1,395 | $1.99 | 25d | 1 | 0.61mi |
| 20772 Indian St Southfield, MI | 4.0 | 1.0 | 1272 | $1,800 | $1.42 | 44d | 1 | 0.61mi |
| 21337 Inkster Rd Unit (NO) Farmington Hills, MI | 2.0 | 1.0 | 811 | $1,295 | $1.60 | 44d | 1 | 0.72mi |
| 21335 Negaunee Unit 1542196P Southfield, MI | 3.0 | 1.0 | 850 | $2,415 | $2.84 | 0d | 1 | 0.79mi |
| 27045 Shiawassee Rd Southfield, MI | 3.0 | 1.0 | 705 | $1,450 | $2.06 | 18d | 1 | 0.84mi |
| 29599 Nottingham Cir Livonia, MI | 2.0 | 2.0 | 1302 | $1,800 | $1.38 | 4d | 1 | 0.98mi |
| 18405 Gillman St Livonia, MI | 3.0 | 2.0 | 1014 | $1,950 | $1.92 | 6d | 1 | 1.06mi |
| 29200 Dardanella St Livonia, MI | 1.0–2.0 | 1.0 | 825 | $1,230 | $1.49 | 0d | 5 | 1.10mi |
| 26539 Clarita Redford, MI | 3.0 | 1.5 | 931 | $1,875 | $2.01 | 25d | 1 | 1.11mi |
| 25740 Shiawassee St Southfield, MI | 1.0–2.0 | 1.0 | 850 | $1,253 | $1.47 | 44d | 10 | 1.47mi |
Listing history 50 events
-
2026-06-18days on market $154,900 Active 241 DOM
-
2026-06-18price $154,900 Active 240 DOM
-
2026-06-17days on market $160,000 Active 240 DOM
-
2026-06-16days on market $160,000 Active 239 DOM
-
2026-06-15days on market $160,000 Active 238 DOM
-
2026-06-13days on market $160,000 Active 236 DOM
-
2026-06-13days on market $160,000 Active 235 DOM
-
2026-06-09days on market $160,000 Active 232 DOM
-
2026-06-08days on market $160,000 Active 231 DOM
-
2026-06-07days on market $160,000 Active 230 DOM
-
2026-06-04days on market $160,000 Active 227 DOM
-
2026-06-03days on market $160,000 Active 226 DOM
-
2026-06-02days on market $160,000 Active 225 DOM
-
2026-06-01days on market $160,000 Active 224 DOM
-
2026-05-31days on market $160,000 Active 223 DOM
-
2026-03-25price $160,000 175-char remark
Show marketing remark (175 chars)
Livonia Bungalow with 3 bedrooms with 1 bath with dining room! Move in ready. Great school district. Hardwood floors in the kitchen and the bedrooms. Large fenced corner yard!
-
2026-03-25price $160,000 175-char remark
Show marketing remark (175 chars)
Livonia Bungalow with 3 bedrooms with 1 bath with dining room! Move in ready. Great school district. Hardwood floors in the kitchen and the bedrooms. Large fenced corner yard!
-
2026-03-25price $160,000
Show marketing remark (175 chars)
Livonia Bungalow with 3 bedrooms with 1 bath with dining room! Move in ready. Great school district. Hardwood floors in the kitchen and the bedrooms. Large fenced corner yard!
-
2025-10-16$165,000 Active 175-char remark
Show marketing remark (175 chars)
Livonia Bungalow with 3 bedrooms with 1 bath with dining room! Move in ready. Great school district. Hardwood floors in the kitchen and the bedrooms. Large fenced corner yard!
-
2025-10-16$165,000 Active 175-char remark
Show marketing remark (175 chars)
Livonia Bungalow with 3 bedrooms with 1 bath with dining room! Move in ready. Great school district. Hardwood floors in the kitchen and the bedrooms. Large fenced corner yard!
-
2025-10-16$165,000 Active
Show marketing remark (175 chars)
Livonia Bungalow with 3 bedrooms with 1 bath with dining room! Move in ready. Great school district. Hardwood floors in the kitchen and the bedrooms. Large fenced corner yard!
-
2022-09-12historical
-
2022-09-12historical
-
2022-07-22status Active
-
2022-07-05historical
-
2022-05-09$155,000 Active
-
2022-05-09$155,000 Active
-
2022-04-30historical
-
2022-04-29historical
-
2022-02-01$165,000 Active
-
2022-02-01$165,000 Active
-
2020-04-27soldstatus $103,000
-
2015-06-05soldstatus $950
-
2015-05-20historical
-
2015-04-21$950
-
2015-02-27soldstatus $50,000
-
2015-01-30soldstatus $50,000 Sold
-
2015-01-30soldstatus $50,000
-
2015-01-16historical
-
2015-01-16historical
-
2014-12-16historical
-
2014-12-16$57,500 Active
-
2014-12-16$57,500
-
2014-12-16historical
-
2014-12-16price $57,500
-
2014-12-09price $59,000
-
2014-12-09status Active
-
2014-12-05historical
-
2014-11-08price $59,900
-
2014-10-06$61,500 Active
ⓘ Source: listings_history table (triggers on properties + properties_extension) + one-shot
backfill from property_details.listing_events for pre-trigger history.
Tax reassessment forecast MI · Partial reset (capped growth)
- Current annual tax
- $2,449 · $204/mo
- Projected year-2 tax
- $2,449 · $204/mo
- Expected delta
- $0/yr ($0/mo · 0.0%)
ⓘ Screening estimate from a state-policy table — verify with the county assessor before closing.
Climate risk First Street
- Flood 1/10 Low FEMA zone X (unshaded) · 0% chance over 30 yrs
- Wildfire 1/10 Low
- Heat 3/10 Moderate 7 d/yr ≥98°F today · 15 d/yr by 30 yrs out
- Wind 2/10 Low
- Air quality 3/10 Moderate 2 unhealthy d/yr today · 3 by 30 yrs out
Nearby sold comps map
Loading sold comps map…
Walkable amenities ~0.75 mi
Loading nearby amenities…
Taxation est. · year 1
- Rental income
- $19,035
- − Mortgage interest
- −$8,677
- − Property taxes
- −$2,449
- − Insurance
- −$774
- − Repairs & maintenance
- −$1,523
- − Management
- −$1,523
- − Depreciation
- −$4,506
- Taxable loss
- −$417
- Est. tax savings @ 24.0%
- +$100
- After-tax cash flow
- $2,166/yr
For passive investors: Depreciation is non-cash, so a rental often shows a tax loss while cash-flowing — sheltering income. Rental losses are passive: they offset passive income freely, and up to $25,000/yr can offset ordinary (W-2) income if you actively participate and your MAGI is under $100k (phasing out to $0 by $150k); unused losses carry forward. On sale, claimed depreciation is recaptured at up to 25%, and gains may owe capital-gains tax (a 1031 exchange can defer both). Figures are a year-1 estimate at your 24.0% rate — not tax advice; consult a CPA.
Schools (NCES district)
- District
- Clarenceville School District
- NCES district ID
- 2609840
- Math proficiency
- 18% ▼ -7.00%
- Reading proficiency
- 33% ▼ -5.00%
- Median HH income
- $42,069
- Composite
- 21.65/100
- National rank
- #8282
- State rank
- #421 of 540 in MI
Livability — Livonia
- Score
- 77/100
- State rank
- #116
- US rank
- #2784
Category grades
Schools grade is shown separately in the Schools card above.
Census & demographics
- Census place
- Livonia, MI
- County
- Wayne County · 1,562,939 people
- City population
- 56,806
- Metro
- Detroit-Warren-Dearborn, MI
- Population (ZIP)
- 30,119
- Household income
- $88,288
- Rent vs Own
- Severe rent burden
- 475.0
Population outlook (Wayne County) Hauer SSP2
- Today (2025)
- 1,675,273 people
- By 2030
- 1,620,300 · -3.3%
- By 2040
- 1,502,341 · -10.3%
- By 2050
- 1,384,039 · -17.4%
- By 2075
- 1,124,592 · -32.9%
- By 2100
- 881,193 · -47.4%
Race, ethnicity, and origin ACS 2023
- Neighborhood character
- Predominantly White (78%)
- Race & ethnicity
- White 78% Asian 8% Black 6% Two or more races 5% Hispanic / Latino 5%
- Common ancestry
- Romanian 12% Lithuanian 4% Slovak 3%
- Foreign-born
- 11% · Canada, South Korea, China
- Languages at home
- 84% English-only · Other Indo-European 5% Arabic 3% Spanish 2%
Political lean MEDSL · Wayne
- 2024 margin
- Strong D (+29.0) · D 62.7% · R 33.7% · Other 3.6%
- 2008→2024 swing
- -20.5pp toward R · 2008: 49.5pp · 2024: 29.0pp
- All cycles
- 2024: D+29.0 2020: D+38.1 2016: D+37.3 2012: D+46.9 2008: D+49.5
Not yet ingested
- Civics
- —
Market trends
- HPI YoY
- ▼ -260.38%
- Current HPI
- 178.5761
- Rent YoY
- —
- Metro
- Detroit-Warren-Dearborn, MI
- State GDP YoY
- ▲ 1.37%
- F500 in state
- 28
Industry mix (Fortune 500 HQ in MI)
| Industry | F500 HQs | Revenue |
|---|---|---|
| Automotive Parts | 3 | $48B |
|
||
| Automotive | 2 | $372B |
|
||
| Chemicals | 1 | $45B |
|
||
| Automotive Retail | 1 | $29B |
|
||
| Healthcare / Medical Devices | 1 | $23B |
|
||
| Automotive Technology | 1 | $20B |
|
||
Price history
+220.0% since first listed40 events — show timeline
- 2026-03-25 Price Changed $160,000 MiRealSource-MiMLS
- 2026-03-25 Price Changed $160,000 REALCOMP
- 2026-03-25 Price Changed $160,000 SW Michigan MLS
- 2025-10-16 Listed $165,000 SW Michigan MLS
- 2025-10-16 Listed $165,000 REALCOMP
- 2025-10-16 Listed $165,000 MiRealSource-MiMLS
- 2022-09-12 Listing Removed — REALCOMP
- 2022-09-12 Listing Removed — MiRealSource-MiMLS
- 2022-07-22 Relisted — REALCOMP
- 2022-07-05 Listing Removed — REALCOMP
- 2022-05-09 Listed $155,000 MiRealSource-MiMLS
- 2022-05-09 Listed $155,000 REALCOMP
- 2022-04-30 Listing Removed — REALCOMP
- 2022-04-29 Listing Removed — MiRealSource-MiMLS
- 2022-02-01 Listed $165,000 MiRealSource-MiMLS
- 2022-02-01 Listed $165,000 REALCOMP
- 2020-04-27 Sold (Public Records) $103,000 Public Records
- 2015-06-05 Sold (MLS) $950 MiRealSource-MiMLS
- 2015-05-20 Listing Removed — MiRealSource-MiMLS
- 2015-04-21 Listed $950 MiRealSource-MiMLS
- 2015-02-27 Sold (Public Records) $50,000 Public Records
- 2015-01-30 Sold (MLS) $50,000 MiRealSource-MiMLS
- 2015-01-30 Sold (MLS) $50,000 REALCOMP
- 2015-01-16 Listing Removed — REALCOMP
- 2015-01-16 Listing Removed — MiRealSource-MiMLS
- 2014-12-16 Listing Removed — REALCOMP
- 2014-12-16 Listed $57,500 REALCOMP
- 2014-12-16 Listing Removed — MiRealSource-MiMLS
- 2014-12-16 Listed $57,500 MiRealSource-MiMLS
- 2014-12-16 Price Changed $57,500 REALCOMP
- 2014-12-09 Price Changed $59,000 REALCOMP
- 2014-12-09 Relisted — REALCOMP
- 2014-12-05 Listing Removed — REALCOMP
- 2014-11-08 Price Changed $59,900 REALCOMP
- 2014-10-06 Listed $57,500 MiRealSource-MiMLS
- 2014-10-06 Listed $61,500 REALCOMP
- 2010-12-22 Delisted — AAMLS
- 2010-12-22 Listing Removed — MiRealSource-MiMLS
- 2010-11-18 Listed — AAMLS
- 2010-11-18 Listed $50,000 MiRealSource-MiMLS
Property tax history
+7.6%/yrLatest (2025): $2,449 · -27.0% YoY. Source: county tax records.
Cash-flow waterfall
monthlySold comps — $/sqft
last 12 mo · ≤1 miLoading sold comps…