7042 W Main Road Site #42 · Lima, NY
Flood risk 1/10 · Minimal
- FEMA flood zone
- X
- Chance of flooding over 30 yrs
- 0.0%
- Est. flood insurance / yr
- $507 – $1,088
Fire risk 2/10 · Minimal
- Est. fire insurance / yr
- $691 – $1,283
Heat risk 2/10 · Minimal
- Hot days now (above 94°F)
- 7 days/yr
- Hot days in 30 yrs
- 15 days/yr
Wind risk 1/10 · Minimal
- Chance of severe wind over 30 yrs
- —
Air-quality risk 2/10 · Minimal
- Unhealthy air days now
- 0 days/yr
- Unhealthy air days in 30 yrs
- 1 days/yr
Risk factors via First Street. Map © Google.
Why this score? — see what drove the B grade
The composite is a weighted blend of 9 inputs, each scored 0–100. Each bar is that input's sub-score; the figure is the points it added to the 100-point composite (weight × sub-score).
- Cash flow +29.2/30.0
- DSCR +10.0/10.0
- 1% rule +8.2/10.0
- ARV discount +7.5/15.0
- Schools +6.5/10.0
- Condition / age +5.0/5.0
- Livability +3.4/5.0
- Rent growth +2.5/5.0
- Appreciation +0.0/10.0
$84,900
🖨 Deal sheet 📄 Offer letter ✓ Due diligence
Listing remarks MLS
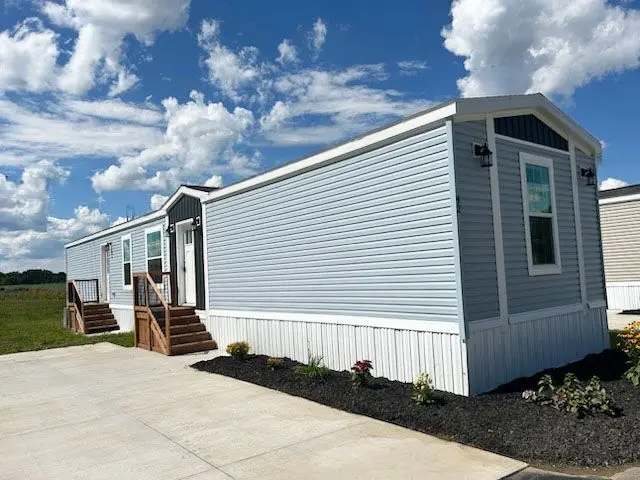
Brand New - Must See Homes! Ready for Move In!
Key facts
- Built 2025
- Listed 278 days
Neighborhood map
What this means for you Summary
Snapshot
- This is a 3-bed/2.0-bath manufactured listed at $85k. Condition is rated excellent.
Deal economics
- At list price, monthly cash flow is $295 ($4k/yr) — positive.
- The deal already cash-flows at list — no discount required.
- Meets the 1% rule at list price ($1k rent vs $85k).
- Recommended offer: $75k (12.0% below list) — sets the bar for market timing.
Location & tenants
- Location reads 68/100 on livability (#545 in NY) — a middle-class / working-renter tenant base. Strengths: housing A+, health & safety A, crime A-; Watch: schools D+, amenities F, commute F.
- Honeoye Falls-Lima Central School District (town): math 74% / reading 73% proficiency, ranked #96 of 590 in NY (top 16%) — strong family-tenant draw, lease renewals of 3-5y typical; only 10% free/reduced lunch — higher-income household profile.
- Market conditions: 19 active listings in the ZIP; 86 units permitted in Livingston County in 2024 (0 in 5+ unit buildings).
Forward outlook
- Local home prices are declining (-3.0%/yr); year-one equity from $587 of loan paydown is wiped out by about $3k of value loss. Plan a longer hold.
- Livingston County population projected at -13% by 2050 — secular population decline; favor cash flow + early exit over multi-decade hold.
- At projected returns (-3.0% appreciation + 3.0% rent growth), your $24k cash investment doubles in ~8 years — after that, you're playing with house money.
Negotiation context
- It's been on market 278 days — a 12% lower offer ($75k) is reasonable based on typical stale-listing flexibility.
- 2 sale attempts; this cycle's ask has dropped $14k (14%) from the opening price — seller is motivated, your offer sets the floor, not the list.
Questions for the listing agent
- It's been on market 278 days. Have you received any prior offers? Is the seller open to a 12% concession, seller financing, or rate buy-down credit?
- Why hasn't it sold? Are there any deal-killer items the seller is aware of (foundation, flood, title, zoning, code violations)?
- Is there a deadline driving the sale (1031 exchange, divorce, estate, relocation)? That informs how much negotiation room exists.
- Schools are D-rated, which usually means shorter tenancies and higher turnover. Who's the typical renter profile here, and what's been the actual vacancy rate?
- What's the average days-on-market for RENTAL listings here right now (not sales)? A rising rental-DOM trend means longer vacancies and softer asking-rent achievability than the comps imply.
- What's the recent tenant-quality profile in this submarket — average credit score on applications, eviction rate, late-payment / NSF rate, and stable-employment percentage? A property-management company in the area should have these aggregated.
- How much new for-sale + rental construction is in the pipeline within 1–3 miles? Heavy new supply typically softens prices + rents 12–24 months out; constrained supply supports both.
Investment metrics
- 1% rule
- 1.32% ✓
- Cap rate
- 10.47%
- Cash-on-cash
- 14.92%
- DSCR
- 1.66
- GRM
- 6.3
CMA / ARV
No comps found within radius.
Projected returns pro-forma
-3.0% appreciation · 3.0% rent growth · sell at horizon
- IRR
- 5.5%
- Equity multiple
- 1.21×
- Total profit
- $5,080
- Equity at exit
- $12,659
- IRR
- 14.9%
- Equity multiple
- 2.21×
- Total profit
- $28,726
- Equity at exit
- $7,341
Cash invested: $23,772 (down + closing). Projections, not guarantees.
Landlord ↔ Tenant lean methodology
- Overall (STATE)
- 15 Strongly Tenant-Friendly
- State New York
- 15 Strongly Tenant-Friendly · D+10
- County
- — inherits STATE
- City
- — inherits STATE
ZIP-level market 14485
- Home prices YoY
- -18.7%
- Active inventory
- 19
- Price-to-rent
- 6.3×
Monthly cashflow live
- Estimated rent
- $1,117 medium interval (Pro) →
- Mortgage (P&I)
- −$445
- Tax est. 1.5%
- −$106 /mo · $1,274/yr
- Insurance
- −$35
- HOA
- −$0
- Vacancy / Maint / Mgmt
- −$235
- Net cashflow
- $295
Break-even live
UW: 25.0% down · 7.5% · 30yr · 1.5% tax · 5.0% vac · 8.0% maint · 8.0% mgmt
Financing live
Cash to close
- Down payment
- $21,225
- Closing costs
- $2,547
- Reserves months
- —
- Total cash needed
- —
Loan-product check · same deal, 3 products live
Conventional
25% down · 7.5% · 30yr
- Down + closing
- —
- Monthly P&I
- —
- Monthly cashflow
- —
- DSCR
- —
- Eligible?
- —
Personal DTI + credit; lowest rate.
DSCR
20% down · 8.5% · 30yr
- Down + closing
- —
- Monthly P&I
- —
- Monthly cashflow
- —
- DSCR
- —
- Eligible?
- —
No personal income docs; deal must DSCR.
Hard money
10% down · 12.0% · 12mo
- Down + closing
- —
- Monthly P&I
- —
- Monthly cashflow
- —
- DSCR
- —
- Eligible?
- —
Short-term bridge; refi at stabilization.
Listing history 16 events
-
2026-06-18days on market $84,900 Active 278 DOM
-
2026-06-17days on market $84,900 Active 277 DOM
-
2026-06-16days on market $84,900 Active 276 DOM
-
2026-06-15days on market $84,900 Active 275 DOM
-
2026-06-13days on market $84,900 Active 273 DOM
-
2026-06-10days on market $84,900 Active 270 DOM
-
2026-06-09days on market $84,900 Active 269 DOM
-
2026-06-09days on market $84,900 Active 268 DOM
-
2026-06-07pricedays on market $84,900 Active 267 DOM
-
2026-06-03days on market $98,900 Active 263 DOM
-
2026-06-03days on market $98,900 Active 262 DOM
-
2026-06-01days on market $98,900 Active 261 DOM
-
2026-05-31days on market $98,900 Active 260 DOM
-
2026-03-03status Active 46-char remark
Show marketing remark (46 chars)
Brand New - Must See Homes! Ready for Move In!
-
2026-02-20historical 46-char remark
Show marketing remark (46 chars)
Brand New - Must See Homes! Ready for Move In!
-
2025-09-01$98,900 Active 46-char remark
Show marketing remark (46 chars)
Brand New - Must See Homes! Ready for Move In!
ⓘ Source: listings_history table (triggers on properties + properties_extension) + one-shot
backfill from property_details.listing_events for pre-trigger history.
Climate risk First Street
- Flood 1/10 Low FEMA zone X · 0% chance over 30 yrs
- Wildfire 2/10 Low
- Heat 2/10 Low 7 d/yr ≥94°F today · 15 d/yr by 30 yrs out
- Wind 1/10 Low
- Air quality 2/10 Low 0 unhealthy d/yr today · 1 by 30 yrs out
Nearby sold comps map
Loading sold comps map…
Walkable amenities ~0.75 mi
Loading nearby amenities…
Taxation est. · year 1
- Rental income
- $13,401
- − Mortgage interest
- −$4,756
- − Property taxes
- −$1,274
- − Insurance
- −$424
- − Repairs & maintenance
- −$1,072
- − Management
- −$1,072
- − Depreciation
- −$2,470
- Taxable income
- $2,333
- Est. tax owed @ 24.0%
- −$560
- After-tax cash flow
- $2,986/yr
For passive investors: Depreciation is non-cash, so a rental often shows a tax loss while cash-flowing — sheltering income. Rental losses are passive: they offset passive income freely, and up to $25,000/yr can offset ordinary (W-2) income if you actively participate and your MAGI is under $100k (phasing out to $0 by $150k); unused losses carry forward. On sale, claimed depreciation is recaptured at up to 25%, and gains may owe capital-gains tax (a 1031 exchange can defer both). Figures are a year-1 estimate at your 24.0% rate — not tax advice; consult a CPA.
Condition & rehab AI · 1 photo
This brand new manufactured home is move-in ready with excellent condition and no visible repairs or maintenance needed. It offers a great opportunity for both resale and rental with potential for minor updates to further enhance its value.
Value-add opportunities
- Both Landscaping improvements — Enhances curb appeal and adds value for both resale and rental.
- Both Interior updates — Fresh paint and minor updates can significantly boost the home's appeal and value.
- Both Appliance upgrades — Modern appliances can attract more buyers and renters, increasing both resale and rental value.
- Both Smart home integration — Adding smart home features can enhance convenience and attract tech-savvy buyers and renters, increasing both resale and rental value.
Renovation cost estimate screening
Value-add ROI direction
- Both Landscaping improvements — Enhances curb appeal and adds value for both resale and rental. ↑
- Both Interior updates — Fresh paint and minor updates can significantly boost the home's appeal and value. ↑
- Both Appliance upgrades — Modern appliances can attract more buyers and renters, increasing both resale and rental value. ↑
- Both Smart home integration — Adding smart home features can enhance convenience and attract tech-savvy buyers and renters, increasing both resale and rental value. ↑
ⓘ Cost ranges are severity-bucket heuristics (US national rule-of-thumb). Get contractor quotes + a written scope before underwriting a rehab budget.
Schools (NCES district)
- District
- Honeoye Falls-Lima Central School District
- NCES district ID
- 3614700
- Math proficiency
- 74% ▼ -4.00%
- Reading proficiency
- 73% ▲ 3.00%
- Median HH income
- $76,376
- Composite
- 64.8/100
- National rank
- #518
- State rank
- #96 of 590 in NY
Livability — Lima
- Score
- 68/100
- State rank
- #545
- US rank
- #9779
Category grades
Schools grade is shown separately in the Schools card above.
Census & demographics
- Population (ZIP)
- 4,163
Population outlook (Livingston County) Hauer SSP2
- Today (2025)
- 63,466 people
- By 2030
- 61,966 · -2.4%
- By 2040
- 58,398 · -8.0%
- By 2050
- 54,955 · -13.4%
- By 2075
- 49,958 · -21.3%
- By 2100
- 43,944 · -30.8%
Race, ethnicity, and origin ACS 2023
- Neighborhood character
- Predominantly White (87%)
- Race & ethnicity
- White 87% Two or more races 6% Hispanic / Latino 4% Asian 1%
- Common ancestry
- Iranian 6% Romanian 6% Italian 3%
- Foreign-born
- 3% · Canada
- Languages at home
- 96% English-only · Spanish 2% German/W. Germanic 1%
Political lean MEDSL · Livingston
- 2024 margin
- Strong R (+21.4) · D 39.3% · R 60.7%
- 2008→2024 swing
- -13.6pp toward R · 2008: -7.9pp · 2024: -21.4pp
- All cycles
- 2024: R+21.4 2020: R+18.2 2016: R+27.8 2012: R+9.4 2008: R+7.9
Not yet ingested
- Civics
- —
Market trends
- HPI YoY
- ▼ -58.25%
- Current HPI
- 252.8543
- Rent YoY
- —
- Metro
- —
- State GDP YoY
- ▲ 2.60%
- F500 in state
- 92
Industry mix (Fortune 500 HQ in NY)
| Industry | F500 HQs | Revenue |
|---|---|---|
| Financial Services | 10 | $950B |
|
||
| Consumer Goods | 9 | $162B |
|
||
| Insurance | 4 | $225B |
|
||
| Telecommunications | 2 | $144B |
|
||
| Pharmaceuticals | 2 | $112B |
|
||
| Media / Entertainment | 2 | $69B |
|
||
Price history
3 events — show timeline
- 2026-03-03 Relisted — Zillow
- 2026-02-20 Delisted — Zillow
- 2025-09-01 Listed $98,900 Zillow
Cash-flow waterfall
monthlySold comps — $/sqft
last 12 mo · ≤1 miLoading sold comps…