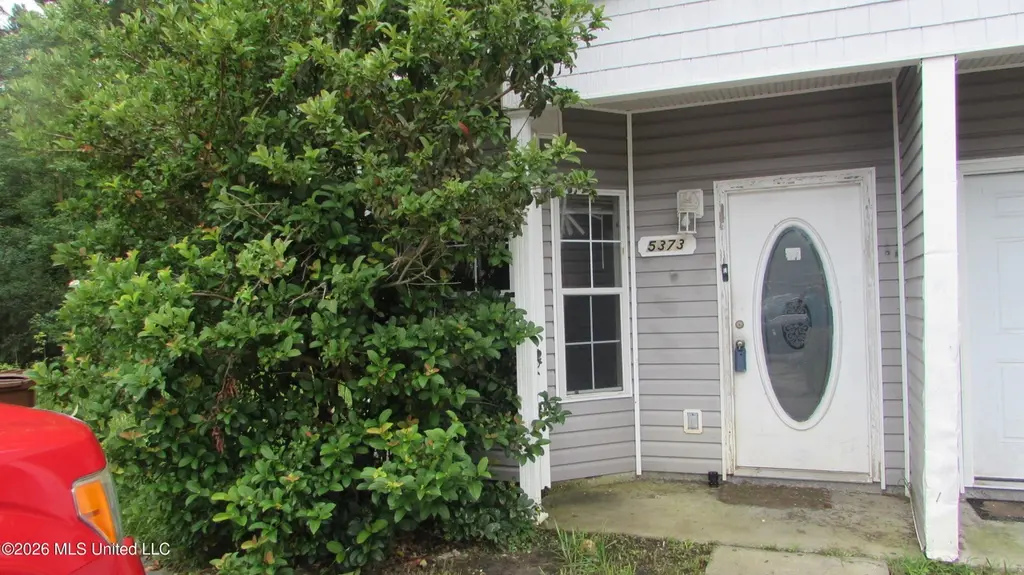
5373 Quail Creek Cir · D'Iberville, MS
Flood risk 1/10 · Minimal
- FEMA flood zone
- X (unshaded)
- Chance of flooding over 30 yrs
- 0.0%
- Est. flood insurance / yr
- $507 – $1,088
Fire risk 4/10 · Minor
- Est. fire insurance / yr
- $1,241 – $2,305
Heat risk 10/10 · Severe
- Hot days now (above 107°F)
- 7 days/yr
- Hot days in 30 yrs
- 23 days/yr
Wind risk 9/10 · Severe
- Chance of severe wind over 30 yrs
- 99.0%
Air-quality risk 2/10 · Minimal
- Unhealthy air days now
- 1 days/yr
- Unhealthy air days in 30 yrs
- 2 days/yr
Risk factors via First Street. Map © Google.
Why this score? — see what drove the B+ grade
The composite is a weighted blend of 9 inputs, each scored 0–100. Each bar is that input's sub-score; the figure is the points it added to the 100-point composite (weight × sub-score).
- Cash flow +30.0/30.0
- ARV discount +15.0/15.0
- DSCR +10.0/10.0
- 1% rule +9.7/10.0
- Schools +4.2/10.0
- Rent growth +3.2/5.0
- Livability +2.5/5.0
- Condition / age +2.5/5.0
- Appreciation +0.0/10.0
$100,000
🖨 Deal sheet (PDF) 📄 Offer letter ✓ Due diligence
Listing remarks
Affordable 3bdrm, 2bath townhome needing TLC but priced accordingly. Located in a rental community and would be a great investment property.
Key facts
- Built 2007
- Listed 17 days
Property features AI
Finance
- HOA & community: Community includes a park
Exterior
- Parking: Parking pad
- Utilities: Public water; Public sewer; Electricity connected; Water connected; Sewer connected
- Home design: Townhouse; Duplex; Two levels; Entry level information not provided; Facing direction not provided
- Construction: Vinyl exterior; Slab foundation; Built year available from public records
- Exterior features: Asphalt shingle roof; Pie-shaped lot; Street lights nearby; Park nearby
Interior
- Flooring: Carpet; Linoleum
- Bathrooms: 2 full bathrooms
- Heating & cooling: Central heating (electric); Central air conditioning; Ceiling fans
- Interior features: Carpet and linoleum flooring; Ceiling fans
Neighborhood map
What this means for you Summary
Snapshot
- This is a 3-bed/1.0-bath townhouse listed at $100k.
Deal economics
- At list price, monthly cash flow is $489 ($6k/yr) — positive.
- The deal already cash-flows at list — no discount required.
- Meets the 1% rule at list price ($1k rent vs $100k).
- Recommended offer: $98k (1.5% below list) — sets the bar for market timing.
- Cap rate 12.2% vs local median 5.4% in D'Iberville — top-decile yield for the area; either an underpriced asset or a hidden risk that comps aren't pricing in. Stress-test before assuming the spread holds.
Location & tenants
- Location reads: area grade B — affects rentability + tenant quality, not the cash-flow math above.
- Harrison County School District (rural): math 52% / reading 46% proficiency, ranked #14 of 130 in MS (top 11%) — families likely to look elsewhere, expect single-tenant / working-renter base with shorter leases; 62% free/reduced lunch — lower-income household profile, screen leases tightly.
- Market conditions: Rents rising (+3.0%/yr); 392 active listings in the ZIP; 6 comparable units currently listed for rent nearby; rentals at typical pace (median 22d on market — plan ~3-4 weeks tenant-placement turnaround); 2,194 units permitted in Harrison County in 2024 (0 in 5+ unit buildings).
Forward outlook
- Local home prices are declining (-3.0%/yr); year-one equity from $691 of loan paydown is wiped out by about $3k of value loss. Plan a longer hold.
- Harrison County population projected at +27% by 2050 — long-run rental-demand tailwind backs the buy-and-hold thesis.
- At projected returns (-3.0% appreciation + 3.0% rent growth), your $28k cash investment doubles in ~6 years — after that, you're playing with house money.
Negotiation context
- It's been on market 17 days — a 2% lower offer ($98k) is reasonable based on typical stale-listing flexibility.
Risks & watch-outs
- Climate carrying-cost: severe wind risk, 99% chance of damaging wind over 30y; extreme-heat days projected 7→23/yr by 2055 (HVAC capex compounding) — expect insurance premiums to compound above CPI over the hold.
Questions for the listing agent
- Is there a deadline driving the sale (1031 exchange, divorce, estate, relocation)? That informs how much negotiation room exists.
- What's the average days-on-market for RENTAL listings here right now (not sales)? A rising rental-DOM trend means longer vacancies and softer asking-rent achievability than the comps imply.
- What's the recent tenant-quality profile in this submarket — average credit score on applications, eviction rate, late-payment / NSF rate, and stable-employment percentage? A property-management company in the area should have these aggregated.
- How much new for-sale + rental construction is in the pipeline within 1–3 miles? Heavy new supply typically softens prices + rents 12–24 months out; constrained supply supports both.
Investment metrics
- 1% rule
- 1.47% ✓
- Cap rate
- 12.16%
- Cash-on-cash
- 20.97%
- DSCR
- 1.93
- GRM
- 5.7
CMA / ARV
- ARV (on-the-fly)
- $122,544
- Comps found
- 3
Show comp detail 3 sales within ~0.75 mi
| Address | Dist | Beds/Ba | Sqft | Sold | Price | $/sf | Match |
|---|---|---|---|---|---|---|---|
| 5421 Quail Creek Cir | 0.11mi | 3/2.0 | 1,131 (+2%) | 8mo | $125,900 | $111 | 80 |
| 5391 Quail Creek Cir | 0.05mi | 3/2.0 | 1,212 (+10%) | 12mo | $85,000 | $70 | 68 |
| 17292 Avondale Cir | 0.54mi | 3/2.0 | 1,071 (-3%) | 20mo | $134,999 | $126 | 49 |
Match score weights: distance 35% · size 25% · config 20% · recency 20%. Top-matched comps best support the ARV.
Projected returns pro-forma
-3.0% appreciation · 2.98% rent growth · sell at horizon
- IRR
- 13.4%
- Equity multiple
- 1.53×
- Total profit
- $14,943
- Equity at exit
- $14,910
- IRR
- 22.2%
- Equity multiple
- 2.90×
- Total profit
- $53,072
- Equity at exit
- $8,646
Cash invested: $28,000 (down + closing). Projections, not guarantees.
Landlord ↔ Tenant lean methodology
- Overall (STATE)
- 90 Strongly Landlord-Friendly
- State Mississippi
- 90 Strongly Landlord-Friendly · R+11
- County
- — inherits STATE
- City
- — inherits STATE
ZIP-level market 39532
- Rents YoY
- 3.0%
- Active inventory
- 392
- Price-to-rent
- 5.7×
Monthly cashflow live
- Estimated rent
- $1,475 high interval (Pro) →
- Mortgage (P&I)
- −$524
- Tax from tax record
- −$110 /mo · $1,315/yr
- Insurance
- −$42
- HOA
- −$0
- Vacancy / Maint / Mgmt
- −$310
- Net cashflow
- $489
Break-even live
Sensitivity live
| Price | -10% $546 | -5% $518 | +0% $489 | +5% $461 | +10% $433 |
|---|---|---|---|---|---|
| Rent | -10% $373 | -5% $431 | +0% $489 | +5% $548 | +10% $606 |
| Rate | -1.0pp $540 | -0.5pp $515 | base $489 | +0.5pp $463 | +1.0pp $437 |
UW: 25.0% down · 7.5% · 30yr · 1.5% tax · 5.0% vac · 8.0% maint · 8.0% mgmt
Financing live
Cash to close
- Down payment
- $25,000
- Closing costs
- $3,000
- Reserves months
- —
- Total cash needed
- —
Loan-product check · same deal, 3 products live
Conventional
25% down · 7.5% · 30yr
- Down + closing
- —
- Monthly P&I
- —
- Monthly cashflow
- —
- DSCR
- —
- Eligible?
- —
Personal DTI + credit; lowest rate.
DSCR
20% down · 8.5% · 30yr
- Down + closing
- —
- Monthly P&I
- —
- Monthly cashflow
- —
- DSCR
- —
- Eligible?
- —
No personal income docs; deal must DSCR.
Hard money
10% down · 12.0% · 12mo
- Down + closing
- —
- Monthly P&I
- —
- Monthly cashflow
- —
- DSCR
- —
- Eligible?
- —
Short-term bridge; refi at stabilization.
Rent comps 6 comps
| Address | Beds | Baths | Sqft | Rent | $/sqft | DOM | Units | Dist |
|---|---|---|---|---|---|---|---|---|
| 15075 Janus Rd Diberville, MS | 3.0 | 2.0 | 1200 | $1,200 | $1.00 | 14d | 1 | 0.07mi |
| 5467 Quail Creek Cir Diberville, MS | 3.0 | 2.0 | 1071 | $1,400 | $1.31 | 21d | 1 | 0.18mi |
| 17038 Date Palm Dr Diberville, MS | 3.0 | 2.0 | 1445 | $2,100 | $1.45 | 44d | 1 | 0.29mi |
| 17310 Avondale Cir Diberville, MS | 3.0 | 2.0 | 1200 | $1,200 | $1.00 | 21d | 1 | 0.54mi |
| 17281 Avondale Cir D'Iberville, MS | 3.0 | 2.0 | 1200 | $1,400 | $1.17 | 14d | 1 | 0.58mi |
| 17212 Avondale Cir Diberville, MS | 3.0 | 2.0 | 1200 | $1,200 | $1.00 | 14d | 1 | 0.58mi |
Listing history 12 events
-
2026-06-18days on market $100,000 Active 17 DOM
-
2026-06-17days on market $100,000 Active 16 DOM
-
2026-06-16days on market $100,000 Active 15 DOM
-
2026-06-15days on market $100,000 Active 14 DOM
-
2026-06-14days on market $100,000 Active 12 DOM
-
2026-06-13days on market $100,000 Active 11 DOM
-
2026-06-10days on market $100,000 Active 9 DOM
-
2026-06-09days on market $100,000 Active 8 DOM
-
2026-06-08days on market $100,000 Active 7 DOM
-
2026-06-07days on market $100,000 Active 6 DOM
-
2026-06-02remarks 140-char remark
-
2026-06-02$100,000 Active 1 DOM
ⓘ Source: listings_history table (triggers on properties + properties_extension) + one-shot
backfill from property_details.listing_events for pre-trigger history.
Tax reassessment forecast MS · Resets to sale price
- Current annual tax
- $1,315 · $110/mo
- Projected year-2 tax
- $1,315 · $110/mo
- Expected delta
- $0/yr ($0/mo · 0.0%)
ⓘ Screening estimate from a state-policy table — verify with the county assessor before closing.
Climate risk First Street
- Flood 1/10 Low FEMA zone X (unshaded) · 0% chance over 30 yrs
- Wildfire 4/10 Moderate
- Heat 10/10 Extreme 7 d/yr ≥107°F today · 23 d/yr by 30 yrs out
- Wind 9/10 Extreme 99% chance of damaging wind over 30 yrs
- Air quality 2/10 Low 1 unhealthy d/yr today · 2 by 30 yrs out
Nearby sold comps map
Loading sold comps map…
Walkable amenities ~0.75 mi
Loading nearby amenities…
Taxation est. · year 1
- Rental income
- $17,696
- − Mortgage interest
- −$5,602
- − Property taxes
- −$1,315
- − Insurance
- −$500
- − Repairs & maintenance
- −$1,416
- − Management
- −$1,416
- − Depreciation
- −$2,909
- Taxable income
- $4,539
- Est. tax owed @ 24.0%
- −$1,089
- After-tax cash flow
- $4,782/yr
For passive investors: Depreciation is non-cash, so a rental often shows a tax loss while cash-flowing — sheltering income. Rental losses are passive: they offset passive income freely, and up to $25,000/yr can offset ordinary (W-2) income if you actively participate and your MAGI is under $100k (phasing out to $0 by $150k); unused losses carry forward. On sale, claimed depreciation is recaptured at up to 25%, and gains may owe capital-gains tax (a 1031 exchange can defer both). Figures are a year-1 estimate at your 24.0% rate — not tax advice; consult a CPA.
Schools (NCES district)
- District
- Harrison County School District
- NCES district ID
- 2801770
- Math proficiency
- 52% ▼ -4.00%
- Reading proficiency
- 46% ▼ -4.00%
- Median HH income
- $46,504
- Composite
- 41.66/100
- National rank
- #3419
- State rank
- #14 of 130 in MS
Livability — D'Iberville
No livability data for this city. (Only ~50 U.S. cities are tracked.)
Census & demographics
- Census place
- D'Iberville, MS
- County
- Harrison County · 178,171 people
- Metro
- Gulfport-Biloxi, MS
- Population (ZIP)
- 36,662
- Household income
- $68,710
- Rent vs Own
- Severe rent burden
- 954.0
Population outlook (Harrison County) Hauer SSP2
- Today (2025)
- 228,444 people
- By 2030
- 241,942 · +5.9%
- By 2040
- 267,531 · +17.1%
- By 2050
- 291,062 · +27.4%
- By 2075
- 346,711 · +51.8%
- By 2100
- 378,165 · +65.5%
Race, ethnicity, and origin ACS 2023
- Neighborhood character
- Predominantly White (69%)
- Race & ethnicity
- White 69% Black 15% Two or more races 9% Hispanic / Latino 6% Asian 4%
- Hispanic origin (detail)
- Mexican 2%
- Common ancestry
- Lithuanian 5% Italian 2% Serbian 2%
- Foreign-born
- 4% · Vietnam, Canada
- Languages at home
- 94% English-only · Spanish 2% Vietnamese 1% Other Indo-European 1%
Political lean MEDSL · Harrison
- 2024 margin
- Strong R (+28.9) · D 35.0% · R 63.9% · Other 1.1%
- 2008→2024 swing
- -2.9pp toward R · 2008: -26.0pp · 2024: -28.9pp
- All cycles
- 2024: R+28.9 2020: R+25.2 2016: R+30.7 2012: R+26.6 2008: R+26.0
Not yet ingested
- Civics
- —
Market trends
- HPI YoY
- ▼ -90.04%
- Current HPI
- 154.9975
- Rent YoY
- ▲ 2.98%
- Metro
- Gulfport-Biloxi, MS
- State GDP YoY
- —
- F500 in state
- 0
Price history
4 events — show timeline
- 2026-06-01 Listed $100,000 MLSU
- 2013-08-26 Sold (Public Records) — Public Records
- 2007-08-10 Sold (Public Records) — Public Records
- 2005-11-10 Sold (Public Records) — Public Records
Property tax history
+3.6%/yrLatest (2025): $1,315 · +5.0% YoY. Source: county tax records.
Cash-flow waterfall
monthlySold comps — $/sqft
last 12 mo · ≤1 miLoading sold comps…