 Duplex
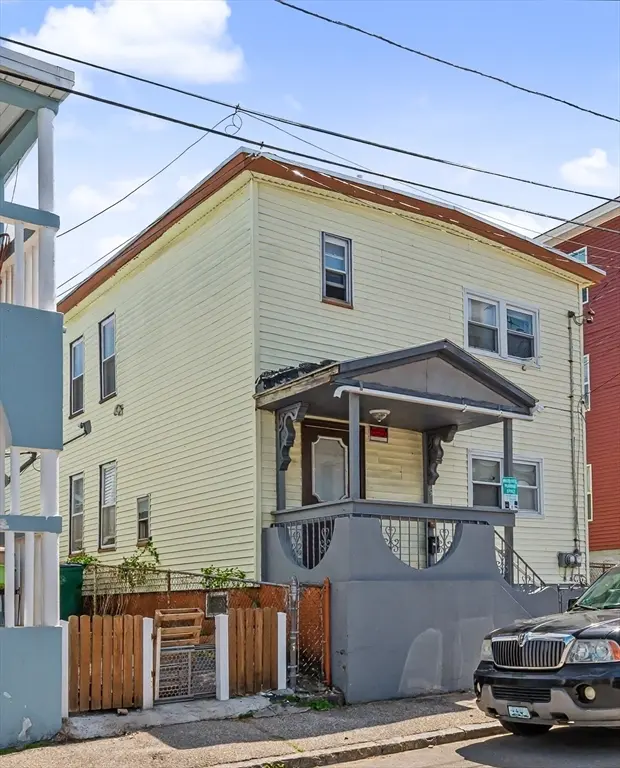
18 Pleasant St · Lowell, MA
Flood risk 1/10 · Minimal
- FEMA flood zone
- X (unshaded)
- Chance of flooding over 30 yrs
- 0.0%
- Est. flood insurance / yr
- $473 – $860
Fire risk 1/10 · Minimal
- Est. fire insurance / yr
- $915 – $1,699
Heat risk 5/10 · Moderate
- Hot days now (above 96°F)
- 7 days/yr
- Hot days in 30 yrs
- 16 days/yr
Wind risk 6/10 · Moderate
- Chance of severe wind over 30 yrs
- 27.0%
Air-quality risk 3/10 · Minor
- Unhealthy air days now
- 2 days/yr
- Unhealthy air days in 30 yrs
- 3 days/yr
Risk factors via First Street. Map © Google.
Why this score? — see what drove the D grade
The composite is a weighted blend of 9 inputs, each scored 0–100. Each bar is that input's sub-score; the figure is the points it added to the 100-point composite (weight × sub-score).
- Cash flow +13.9/30.0
- ARV discount +11.5/15.0
- DSCR +4.2/10.0
- Livability +4.0/5.0
- 1% rule +3.1/10.0
- Rent growth +2.5/5.0
- Condition / age +2.5/5.0
- Schools +2.1/10.0
- Appreciation +0.0/10.0
$524,900
🖨 Deal sheet (PDF) 📄 Offer letter ✓ Due diligence
Multi-family units
County records classify this as Multi-Family (2-4 Unit). Listing-text estimate: 2 units. confirmed
Listing remarks MLS
Two Family in Lower Belvidere area. Has vinyl siding, some new windows, fairly recent roof ; both units had lead compliance letters (check with appropriate agencies for verification). Needs some sheetrock repair; winterized, bring flashlight for showings.
Key facts
- Private deck
- Separate utilities
- Private backyard
Tags
Property features AI
Finance
- Other: Property contains two units (2-family, up/down); Basement is full, unfinished, with walk-out access and interior entry; Washer and dryer are tenant-owned (excluded)
- HOA & community: Neighborhood features include public transportation, shopping, parks, medical facility, laundromat, houses of worship, public schools, and a university; Not a senior community
Exterior
- Parking: On-street parking; Open parking available
- Utilities: Public water; Public sewer; Electric service with circuit breakers; Gas available for range; Electric hookup for dryer
- Home design: Two-family, up/down layout; 2 stories
- Construction: Frame construction; Stone and brick/mortar foundation; Rubber roof; Built (year per public records)
- Exterior features: Deck (wood); Balcony/deck; City views; Public road frontage
Interior
- Kitchen: Range; Range hood; Refrigerator
- Flooring: Vinyl flooring; Laminate flooring
- Bathrooms: 2 full bathrooms
- Heating & cooling: 2 heating units; No central cooling reported
- Interior features: Ceiling fans; Storage space; Bathtub with shower; Living room; Dining room; Total of 11 rooms
- Laundry & utility: Washer hookup; Dryer hookup (electric)
Neighborhood map
What this means for you Summary
Snapshot
- This is a 2 × 2-bed/1.0-bath units multifamily listed at $525k.
Deal economics
- At list price, monthly cash flow is $60 ($718/yr) — positive. Per door: $30/mo.
- The deal already cash-flows at list — no discount required.
- To meet the 1% rule (rent ≥ 1% of price), the offer needs to be $428k (18.5% below list).
- Recommended offer: $428k (18.5% below list) — sets the bar for 1% rule.
- Cap rate 6.4% vs local median 2.9% in Lowell — top-decile yield for the area; either an underpriced asset or a hidden risk that comps aren't pricing in. Stress-test before assuming the spread holds.
Location & tenants
- Location reads 80/100 on livability (#36 in MA, #1,677 nationally) — a professional / high-income tenant draw. Strengths: amenities A+, commute A+, health & safety A+; Watch: schools C-, crime F, cost of living F.
- Lowell (suburban): math 20% / reading 28% proficiency, ranked #277 of 302 in MA (top 92%) — low school quality limits family demand, transient renter base, plan for 1-2y turnover; 64% free/reduced lunch — lower-income household profile, screen leases tightly.
- Market conditions: Rents flat; 54 active listings in the ZIP; 23 comparable units currently listed for rent nearby; rentals at typical pace (median 27d on market — plan ~3-4 weeks tenant-placement turnaround); solid renter incomes; 3,670 units permitted in Middlesex County in 2024 (2,611 in 5+ unit buildings).
- At $4,276/mo this rent would consume 63% of the median local household income ($81k/yr) (locally 1816% of renters already pay >50% of income on rent) — very limited rent-growth headroom before tenants either downsize or default.
Forward outlook
- Local home prices are declining (-3.0%/yr); year-one equity from $4k of loan paydown is wiped out by about $16k of value loss. Plan a longer hold.
- Middlesex County population projected at +20% by 2050 — long-run rental-demand tailwind backs the buy-and-hold thesis.
Negotiation context
- It's been on market 45 days — a 3% lower offer ($509k) is reasonable based on typical stale-listing flexibility.
- 4 sale attempts since 29y ago with the ask held roughly flat each time — persistent listings suggest the price (not the market) is what's stuck; bring a comps-based counter.
- Current owner paid $95k; list at $525k implies a 453% gain — meaningful room to come down on a strong offer.
Risks & watch-outs
- Watch-outs: built in 1880 — expect roof / HVAC / electrical / plumbing capex.
- Climate carrying-cost: major wind risk, 27% chance of damaging wind over 30y; extreme-heat days projected 7→16/yr by 2055 (HVAC capex compounding) — expect insurance premiums to compound above CPI over the hold.
Questions for the listing agent
- It's been on market 45 days. Have you received any prior offers? Is the seller open to a 19% concession, seller financing, or rate buy-down credit?
- Can we see the unit-by-unit rent roll, current vacancy, and any below-market leases? What's the average tenancy length?
- What capital expenditures (roof, boiler, parking lot, exteriors) have been made in the last 5 years, and what's planned in the next 2?
- Built in 1880 — when were the roof, HVAC, electrical panel, plumbing, and water heater last replaced?
- Is there a deadline driving the sale (1031 exchange, divorce, estate, relocation)? That informs how much negotiation room exists.
- Crime grade is F in this area — have there been break-ins, vandalism, or insurance claims at this property in the last 3 years? What carrier currently insures it and at what premium?
- The area grade is low — what's the realistic commute time and amenity access for the typical tenant pool here? Any planned neighborhood developments (good or bad) we should know about?
- What's the average days-on-market for RENTAL listings here right now (not sales)? A rising rental-DOM trend means longer vacancies and softer asking-rent achievability than the comps imply.
- What's the recent tenant-quality profile in this submarket — average credit score on applications, eviction rate, late-payment / NSF rate, and stable-employment percentage? A property-management company in the area should have these aggregated.
- How much new apartment / multifamily construction is in the pipeline within 1–3 miles? Heavy new supply (>2% of stock underway) typically softens rents 12–24 months out; light construction supports rent growth.
Investment metrics
- 1% rule
- 0.81% ✗
- Cap rate
- 6.43%
- Cash-on-cash
- 0.49%
- DSCR
- 1.02
- GRM
- 10.2
CMA / ARV
- ARV (median comp)
- $576,572
- List price
- $524,900
- Delta
- -8.96%
- Verdict
- FAIR
- Comps
- 20 within 1.0 mi
Show comp detail 6 sales within ~0.75 mi
| Address | Dist | Beds/Ba | Sqft | Sold | Price | $/sf | Match |
|---|---|---|---|---|---|---|---|
| 66 Perry St | 0.10mi | 4/2.0 (-1) | 1,525 (-7%) | 4mo | $550,000 | $361 | 76 |
| 286 Pleasant St | 0.50mi | 4/2.0 (-1) | 1,764 (+8%) | 1mo | $685,000 | $388 | 57 |
| 8 Cedar Ct | 0.63mi | 6/2.0 (+1) | 1,534 (-6%) | 3mo | $430,000 | $280 | 53 |
| 47-49 Cedar St | 0.62mi | 5/2.0 | 1,707 (+5%) | 18mo | $495,500 | $290 | 48 |
| 5-7 Durant St | 0.58mi | 6/2.0 (+1) | 1,581 (-3%) | 20mo | $370,000 | $234 | 46 |
| 544 Concord St | 0.47mi | 4/2.0 (-1) | 1,467 (-10%) | 19mo | $525,000 | $358 | 41 |
Match score weights: distance 35% · size 25% · config 20% · recency 20%. Top-matched comps best support the ARV.
Projected returns pro-forma
-3.0% appreciation · 0.04% rent growth · sell at horizon
- IRR
- -18.6%
- Equity multiple
- 0.36×
- Total profit
- $-93,738
- Equity at exit
- $78,264
- IRR
- -17.8%
- Equity multiple
- 0.15×
- Total profit
- $-125,065
- Equity at exit
- $45,384
Cash invested: $146,972 (down + closing). Projections, not guarantees.
Landlord ↔ Tenant lean methodology
- Overall (STATE)
- 20 Strongly Tenant-Friendly
- State Massachusetts
- 20 Strongly Tenant-Friendly · D+15
- County
- — inherits STATE
- City
- — inherits STATE
ZIP-level market 01852
- Home prices YoY
- -23.2%
- Rents YoY
- 0.0%
- Active inventory
- 54
- Price-to-rent
- 20.5×
Monthly cashflow live
- Estimated rent
- $4,276 high interval (Pro) →
- Mortgage (P&I)
- −$2,753
- Tax from tax record
- −$347 /mo · $4,162/yr
- Insurance
- −$219
- HOA
- −$0
- Vacancy / Maint / Mgmt
- −$898
- Net cashflow
- $60
Break-even live
Sensitivity live
| Price | -10% $357 | -5% $208 | +0% $60 | +5% $-89 | +10% $-237 |
|---|---|---|---|---|---|
| Rent | -10% $-278 | -5% $-109 | +0% $60 | +5% $229 | +10% $398 |
| Rate | -1.0pp $324 | -0.5pp $193 | base $60 | +0.5pp $-76 | +1.0pp $-215 |
2-unit breakdown (identical units grouped — click to expand)
| Units | Beds | Baths | Est. rent |
|---|---|---|---|
| 2× units | 2 | 1 | $4,276 |
| #1 | 2 | 1 | $2,138 |
| #2 | 2 | 1 | $2,138 |
| Total (2 units) | $4,276 | ||
UW: 25.0% down · 7.5% · 30yr · 1.5% tax · 5.0% vac · 8.0% maint · 8.0% mgmt
Financing live
Cash to close
- Down payment
- $131,225
- Closing costs
- $15,747
- Reserves months
- —
- Total cash needed
- —
Loan-product check · same deal, 3 products live
Conventional
25% down · 7.5% · 30yr
- Down + closing
- —
- Monthly P&I
- —
- Monthly cashflow
- —
- DSCR
- —
- Eligible?
- —
Personal DTI + credit; lowest rate.
DSCR
20% down · 8.5% · 30yr
- Down + closing
- —
- Monthly P&I
- —
- Monthly cashflow
- —
- DSCR
- —
- Eligible?
- —
No personal income docs; deal must DSCR.
Hard money
10% down · 12.0% · 12mo
- Down + closing
- —
- Monthly P&I
- —
- Monthly cashflow
- —
- DSCR
- —
- Eligible?
- —
Short-term bridge; refi at stabilization.
Rent comps 23 comps
| Address | Beds | Baths | Sqft | Rent | $/sqft | DOM | Units | Dist |
|---|---|---|---|---|---|---|---|---|
| 58 Willow St Lowell, MA | 4.0 | 1.5 | 1233 | $3,000 | $2.43 | 45d | 1 | 0.16mi |
| 50 Willow St Unit 50 Lowell, MA | 5.0 | 1.5 | 1763 | $3,500 | $1.99 | 45d | 1 | 0.17mi |
| 277 E Merrimack St Unit 1 Lowell, MA | 4.0 | 1.0 | 1600 | $2,400 | $1.50 | 26d | 1 | 0.22mi |
| 738 Central St Unit 2 Lowell, MA | 4.0 | 1.0 | 1100 | $2,600 | $2.36 | 45d | 1 | 0.38mi |
| 17 Bassett St Unit A Lowell, MA | 5.0 | 1.5 | 1600 | $2,850 | $1.78 | 26d | 1 | 0.42mi |
| 17 Bassett St Lowell, MA | 5.0 | 1.0 | 1600 | $2,850 | $1.78 | 24d | 1 | 0.42mi |
| 1000 Central St Unit 2 Lowell, MA | 4.0 | 1.5 | 2060 | $2,750 | $1.33 | 45d | 1 | 0.63mi |
| 1 Merrimack Plz Lowell, MA | 1.0–4.0 | 1.0–2.0 | 823 | $3,600 | $4.37 | 0d | 13 | 0.69mi |
| 45 W 5th St Unit 2 Lowell, MA | 4.0 | 1.0 | 1200 | $2,750 | $2.29 | 17d | 1 | 0.80mi |
| 59 Fulton St Lowell, MA | 4.0 | 2.0 | 1793 | $3,500 | $1.95 | 26d | 1 | 0.88mi |
| 36 Cork St #36 Lowell, MA | 4.0 | 1.0 | 1092 | $3,150 | $2.88 | 45d | 1 | 0.88mi |
| 36 Cork St #36 Lowell, MA | 4.0 | 1.0 | 1092 | $3,150 | $2.88 | 26d | 1 | 0.88mi |
| 36 Cork St Lowell, MA | 4.0 | 1.0 | 1092 | $3,450 | $3.16 | 45d | 1 | 0.88mi |
| 25 Ware St Unit 1 Lowell, MA | 4.0 | 1.0 | 1450 | $3,000 | $2.07 | 45d | 1 | 0.96mi |
| 89 Bunker Hill Ave Unit 1 Lowell, MA | 4.0 | 1.0 | 1622 | $3,400 | $2.10 | 26d | 1 | 1.06mi |
| 58 Temple St Unit 58-60 Temple St, 1st Fl Lowell, MA | 4.0 | 2.0 | 1150 | $2,185 | $1.90 | 18d | 1 | 1.08mi |
| 58 Temple St Unit 58-60 Temple St, 2nd fl Lowell, MA | 4.0 | 1.0 | 1100 | $2,085 | $1.90 | 18d | 1 | 1.08mi |
| 151 Salem St Apt 1 Lowell, MA | 4.0 | 1.0 | 1200 | $2,900 | $2.42 | 45d | 1 | 1.20mi |
| 6 Dalton St Unit 3 Lowell, MA | 4.0 | 1.0 | 1150 | $2,750 | $2.39 | 22d | 1 | 1.23mi |
| 3 Butman Pl Lowell, MA | 4.0 | 1.0 | 1406 | $3,000 | $2.13 | 45d | 1 | 1.30mi |
| 76 Mount Vernon St Unit 1 Lowell, MA | 4.0 | 1.0 | 1400 | $2,995 | $2.14 | 7d | 1 | 1.32mi |
| 76 Mount Vernon St Lowell, MA | 4.0 | 1.0 | 1400 | $2,995 | $2.14 | 26d | 1 | 1.32mi |
| 21 Riverby St Lowell, MA | 4.0 | 2.0 | 2000 | $4,200 | $2.10 | 12d | 1 | 1.47mi |
Listing history 34 events
-
2026-06-21statusdays on market $524,900 Active 45 DOM
-
2026-06-18days on market $524,900 Price Changed 42 DOM
-
2026-06-17days on market $524,900 Price Changed 41 DOM
-
2026-06-16days on market $524,900 Price Changed 40 DOM
-
2026-06-15pricestatus $524,900 Price Changed 39 DOM
-
2026-06-15days on market $549,900 Active 39 DOM
-
2026-06-13days on market $549,900 Active 37 DOM
-
2026-06-13days on market $549,900 Active 36 DOM
-
2026-06-09days on market $549,900 Active 33 DOM
-
2026-06-08days on market $549,900 Active 32 DOM
-
2026-06-07days on market $549,900 Active 31 DOM
-
2026-06-04days on market $549,900 Active 28 DOM
-
2026-06-03days on market $549,900 Active 27 DOM
-
2026-06-02days on market $549,900 Active 26 DOM
-
2026-06-01days on market $549,900 Active 25 DOM
-
2026-05-31days on market $549,900 Active 24 DOM
-
2026-05-07$549,900 New 798-char remark
-
2008-04-11soldstatus $95,000 255-char remark
Show marketing remark (255 chars)
Two Family in Lower Belvidere area. Has vinyl siding, some new windows, fairly recent roof ; both units had lead compliance letters (check with appropriate agencies for verification). Needs some sheetrock repair; winterized, bring flashlight for showings.
-
2008-01-21historical 255-char remark
Show marketing remark (255 chars)
Two Family in Lower Belvidere area. Has vinyl siding, some new windows, fairly recent roof ; both units had lead compliance letters (check with appropriate agencies for verification). Needs some sheetrock repair; winterized, bring flashlight for showings.
-
2007-07-31$105,000 255-char remark
Show marketing remark (255 chars)
Two Family in Lower Belvidere area. Has vinyl siding, some new windows, fairly recent roof ; both units had lead compliance letters (check with appropriate agencies for verification). Needs some sheetrock repair; winterized, bring flashlight for showings.
-
2006-02-10soldstatus $319,000
-
2006-02-10soldstatus $319,000
-
2006-02-10soldstatus $319,000
-
2005-09-12soldstatus $258,000
Show marketing remark (214 chars)
BELVIDERE AREA, TWO FAMILY, VACANT WITH NEW WINDOWS, TWO-YEAR OLD ROOF, FINISHED BASEMENT. CLEAN AND READY TO GO!! LETTERS OF FULL LEAD COMPLIANCE ON FILE. MOTIVATED SELLER, “LET’S NEGOTIATE”!!
-
2005-09-08soldstatus $258,000
-
2005-09-08soldstatus $258,000
-
2005-07-21historical
Show marketing remark (214 chars)
BELVIDERE AREA, TWO FAMILY, VACANT WITH NEW WINDOWS, TWO-YEAR OLD ROOF, FINISHED BASEMENT. CLEAN AND READY TO GO!! LETTERS OF FULL LEAD COMPLIANCE ON FILE. MOTIVATED SELLER, “LET’S NEGOTIATE”!!
-
2005-06-02$249,900
Show marketing remark (214 chars)
BELVIDERE AREA, TWO FAMILY, VACANT WITH NEW WINDOWS, TWO-YEAR OLD ROOF, FINISHED BASEMENT. CLEAN AND READY TO GO!! LETTERS OF FULL LEAD COMPLIANCE ON FILE. MOTIVATED SELLER, “LET’S NEGOTIATE”!!
-
1999-03-01soldstatus $98,350
-
1999-03-01soldstatus $98,350
-
1997-10-31soldstatus $58,500
-
1997-09-11historical
-
1997-03-31$63,000
-
1994-01-19soldstatus $36,000
ⓘ Source: listings_history table (triggers on properties + properties_extension) + one-shot
backfill from property_details.listing_events for pre-trigger history.
Tax reassessment forecast MA · Partial reset (capped growth)
- Current annual tax
- $4,162 · $347/mo
- Projected year-2 tax
- $5,309 · $442/mo
- Expected delta
- +$1,147/yr (+$96/mo · 27.6%)
ⓘ Screening estimate from a state-policy table — verify with the county assessor before closing.
Climate risk First Street
- Flood 1/10 Low FEMA zone X (unshaded) · 0% chance over 30 yrs
- Wildfire 1/10 Low
- Heat 5/10 Major 7 d/yr ≥96°F today · 16 d/yr by 30 yrs out
- Wind 6/10 Major 27% chance of damaging wind over 30 yrs
- Air quality 3/10 Moderate 2 unhealthy d/yr today · 3 by 30 yrs out
Nearby sold comps map
Loading sold comps map…
Walkable amenities ~0.75 mi
Loading nearby amenities…
Taxation est. · year 1
- Rental income
- $51,312
- − Mortgage interest
- −$29,403
- − Property taxes
- −$4,162
- − Insurance
- −$2,624
- − Repairs & maintenance
- −$4,105
- − Management
- −$4,105
- − Depreciation
- −$15,270
- Taxable loss
- −$8,357
- Est. tax savings @ 24.0%
- +$2,006
- After-tax cash flow
- $2,724/yr
For passive investors: Depreciation is non-cash, so a rental often shows a tax loss while cash-flowing — sheltering income. Rental losses are passive: they offset passive income freely, and up to $25,000/yr can offset ordinary (W-2) income if you actively participate and your MAGI is under $100k (phasing out to $0 by $150k); unused losses carry forward. On sale, claimed depreciation is recaptured at up to 25%, and gains may owe capital-gains tax (a 1031 exchange can defer both). Figures are a year-1 estimate at your 24.0% rate — not tax advice; consult a CPA.
Schools (NCES district)
- District
- Lowell
- NCES district ID
- 2507020
- Math proficiency
- 20% ▼ -18.00%
- Reading proficiency
- 28% ▼ -11.00%
- Median HH income
- $49,291
- Composite
- 21.14/100
- National rank
- #8430
- State rank
- #277 of 302 in MA
Livability — Lowell
- Score
- 80/100
- State rank
- #36
- US rank
- #1677
Category grades
Schools grade is shown separately in the Schools card above.
Census & demographics
- Census place
- Lowell, MA
- County
- Middlesex County · 1,437,704 people
- City population
- 100,628
- Metro
- Boston-Cambridge-Newton, MA-NH
- Population (ZIP)
- 37,144
- Household income
- $80,906
- Rent vs Own
- Severe rent burden
- 1816.0
Population outlook (Middlesex County) Hauer SSP2
- Today (2025)
- 1,740,269 people
- By 2030
- 1,817,187 · +4.4%
- By 2040
- 1,963,195 · +12.8%
- By 2050
- 2,087,461 · +20.0%
- By 2075
- 2,344,036 · +34.7%
- By 2100
- 2,383,776 · +37.0%
Race, ethnicity, and origin ACS 2023
- Neighborhood character
- Diverse neighborhood (Simpson 0.66)
- Race & ethnicity
- White 53% Hispanic / Latino 17% Asian 15% Two or more races 9% Black 8%
- Hispanic origin (detail)
- Mexican 2% Puerto Rican 8% Dominican 2%
- Common ancestry
- Russian 7% Lithuanian 5% Estonian 4%
- Foreign-born
- 28% · Canada, Vietnam, Jamaica
- Languages at home
- 60% English-only · Other Indo-European 13% Spanish 12% Other Asian/Pacific 8%
Political lean MEDSL · Middlesex
- 2024 margin
- Solid D (+39.5) · D 68.5% · R 29.0% · Other 2.5%
- 2008→2024 swing
- +9.3pp toward D · 2008: 30.1pp · 2024: 39.5pp
- All cycles
- 2024: D+39.5 2020: D+45.2 2016: D+38.1 2012: D+26.9 2008: D+30.1
Not yet ingested
- Civics
- —
Market trends
- HPI YoY
- ▼ -125.95%
- Current HPI
- 416.1634
- Rent YoY
- ▬ 0.04%
- Metro
- Boston-Cambridge-Newton, MA-NH
- State GDP YoY
- ▲ 2.28%
- F500 in state
- 38
Industry mix (Fortune 500 HQ in MA)
| Industry | F500 HQs | Revenue |
|---|---|---|
| Technology | 3 | $17B |
|
||
| Insurance | 2 | $84B |
|
||
| Retail | 2 | $76B |
|
||
| Life Sciences | 1 | $43B |
|
||
| Energy Technology | 1 | $31B |
|
||
| Aerospace / Defense | 1 | $18B |
|
||
Price history
+1358.1% since first listed19 events — show timeline
- 2026-06-15 Price Changed $524,900 MLS PIN
- 2026-05-07 Listed $549,900 MLS PIN
- 2008-04-11 Sold (MLS) $95,000 MLS PIN
- 2008-01-21 Listing Removed — MLS PIN
- 2007-07-31 Listed $105,000 MLS PIN
- 2006-02-10 Sold (Public Records) $319,000 Public Records
- 2006-02-10 Sold (Public Records) $319,000 Public Records
- 2006-02-10 Sold (Public Records) $319,000 Public Records
- 2005-09-12 Sold (MLS) $258,000 MLS PIN
- 2005-09-08 Sold (Public Records) $258,000 Public Records
- 2005-09-08 Sold (Public Records) $258,000 Public Records
- 2005-07-21 Listing Removed — MLS PIN
- 2005-06-02 Listed $249,900 MLS PIN
- 1999-03-01 Sold (Public Records) $98,350 Public Records
- 1999-03-01 Sold (Public Records) $98,350 Public Records
- 1997-10-31 Sold (MLS) $58,500 MLS PIN
- 1997-09-11 Listing Removed — MLS PIN
- 1997-03-31 Listed $63,000 MLS PIN
- 1994-01-19 Sold (Public Records) $36,000 Public Records
Property tax history
+4.2%/yrLatest (2025): $4,162 · +6.1% YoY. Source: county tax records.
Cash-flow waterfall
monthlySold comps — $/sqft
last 12 mo · ≤1 miLoading sold comps…